Chapter 8
LOCAL GOVERNMENTS AND
DECENTRALISED PLANNING IN KERALA
Introduction
A new feature that has been introduced in this year’s Economic Review is a theme paper. This was a recommendation of the K.P. Kannan Committee, which looked into ways in which the Review could be made more meaningful. While other chapters in this Review deal with the current/recent status of various economic phenomena, this chapter is an analytical paper bringing out the unique features of Kerala’s LSGIs, its historic evolution, the major strides made in participatory governance through effective devolution of powers to panchayats, municipalities and municipal corporations. The paper will provide the reader a narrative account of the significant strides that Kerala has achieved while the rest of the country has yet to implement the 73rd and 74th amendment to the Constitution.
Decentralized Planning is an integral component of national planning and they complement each other. The major rationale of decentralization is to generate financial efficiency and quality gains by devolving resources and decision-making powers to local governments for the delivery of services and thereby produce and provide locally relevant public goods efficiently (Robinson 2003). Decentralisation is one of the most important subjects which has been debated over the years after independence. One of the basic reasons for this is that the Panchayats and urban local bodies could not function as democratic self governments due to lack of power and resources. Moreover, the inadequate mechanism to conduct elections at regular intervals diluted the democratic nature of the system. Understanding thoroughly the weakness of the system, the Central Government constituted various committees to get proper guidance to empower Local Governments. In 1958, on the basis of Balwanth Rai Mehta Committee Report, the three tier Panchayat Raj System was accepted by the Government. But it could not get a unique status as it is part of the state list and so many states have not implemented it in true spirit. Later, the Hanumantha Rao Committee suggested District Level Planning as part of decentralization in 1984 which was accepted by the Government. Later on the VKRV Rao Committee recommended that local level planning should be made participatory and that resources may be provided for the same. In 1988 the parliamentary consultative committee headed by Mr.Thungon recommended constitutional provision for the Panchayati Raj system. Ultimately in 1992, 73rd Amendment bill was introduced in the Parliament and in 1993, it was enacted.
In Kerala, following the recommendations of the Administrative Reforms Committee, Kerala Panchayat Bill and District Council Bill were placed in the Assembly in 1958 and 1959 respectively. But these bills could not be enacted into Law. Later on, in 1960, Kerala Panchayat Act was framed. Based on the Act, elections were held in 1963 and 922 village Panchayats came in to existence in 1964. In 1979, the State enacted the Kerala District Administration Act. In 1990, elections were held to District Councils in Kerala and District Councils came in to existence in February 1991. But the Districts councils were dissolved later on. It was at this point that the Historic 73rd and 74th Amendments came in to existence. Now Kerala is the torchbearer not only among Indian states but also internationally, for the way in which it has devolved powers and resources to local governments and the methods and processes it has followed in implementing decentralization.
Trajectory of Decentralised Planning in Kerala
8.2 Once the Panchayats and urban local bodies got the constitutional status through 73rd & 74th Amendment Acts of the Constitution, it was the responsibility of the states to implement it. But unfortunately there were no Laws and Rules in place. At this stage Kerala has adopted a separate model of its own. It has initiated a ‘reversal process against the traditional style of implementation by a campaign mode. As an entry point activity, local level planning was accepted and powers, functions and responsibilities have been devolved to lower levels. Simultaneously all efforts were taken at the Government level to make it a process to empower local bodies as Local Self Government having adequate power and resources to plan and implement projects with people’s participation.
8.3 Kerala initiated this revolutionary process of Democratic Decentralization and Decentralized Planning at the beginning of 9th Five Year Plan in 1996 in accordance with the 73rd & 74th amendments to the Constitution. This was a follow up of the legislations like the Panchayat Raj and the Municipality Acts of 1994. At present there are 1209 local bodies in Kerala. This includes 1144 rural local bodies (978 Grama Panchayats, 152 Block Panchayats and 14 District Panchayats) and 65 urban local bodies (60 Municipalities and 5 Corporations). The decentralized planning process in the state has now successfully been followed. It was initially launched in a campaign mode named as the ‘Peoples Plan Campaign’ deliberately since the concept of participatory planning was new to the people, people’s representatives and officials in local self governments (hereafter LGs). People’s Plan Campaign progressed with institutionalization at different levels. As a result, the powers were decentralized and the responsibilities of planning at local level were transferred to the local self-Governments. Under the 10th Plan (2002-03 to 2006-07) the decentralized programme in Kerala was restructured and named ‘Kerala Development Plan’ (KDP) after analyzing the experience of Peoples Plan Campaign. A number of innovative steps were taken under KDP to strengthen and institutionalize decentralization in the state. During 11th Plan, Government revamped the entire process giving stress to the concept of ‘People’s Planning’ focusing on completion of the process of institutionalization of decentralization (Working Group Report on LSGD, 2012).
Important Aspects of Decentralisation in Kerala
Administrative Decentralization
8.4 Decentralization methodology basically emphasises autonomy, role clarity, uniformity, people’s participation, accountability and transparency. Autonomy has the basic aspects of Functional autonomy, Financial autonomy and Administrative autonomy. In all these aspects, Kerala has given sufficient success. Kerala has taken keen initiatives right from the beginning to provide necessary administrative provisions for the smooth functioning of the local institutions. Certain functions and functionaries of different departments have been transferred to local bodies. Similarly constitutional safe guards have been taken from time and various amendments have been made to Panchayati Raj and Municipality Acts to empower LGs.
Development Decentralization
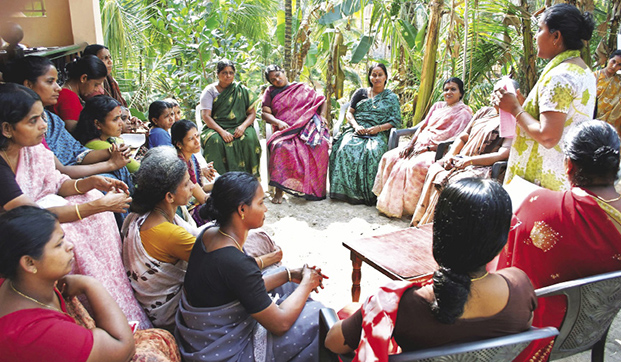
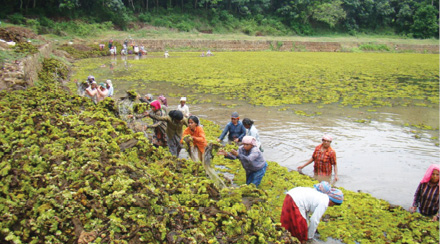
8.5 The significant aspect of Decentralisation in Kerala is the transfer of well defined development responsibilities to Local Governments. Many activities relating to agriculture including micro watershed development, dairy development, minor irrigation, inland fisheries, animal husbandry etc have been assigned to LGs. Similarly, most of the responsibilities related to human and social development infrastructure development, welfare schemes etc have also been transferred to LGs. In terms of poverty alleviation and rural development, Local Governments play a predominant role. Participatory planning with peoples’ participation and with the help of different participatory support systems like Grama/Ward Sabhas, Working Groups/Technical Support System etc are worth mentioning.
Fiscal Decentralization
8.6 Devolution of sizable amount of plan funds to the Local Bodies is a historical land mark in Development Planning in the State. Finance Commissions were set up periodically to study various aspects of State Finance and to provide recommendations to the Government in order to support the LGs financially. As per recommendations of State Finance Commissions, untied Funds are devolved to the Local Governments in three streams viz: General Purpose Fund for meeting the expenditure on traditional functions and establishment expenses, Maintenance Fund for maintaining the assets of Local Governments including those transferred as part of decentralization and Development Fund for development functions. Maintenance Fund is divided into two categories; one for the maintenance of Roads and the other for the maintenance of other assets. Development Fund comprises of three categories viz; General Sector, Special Component Plan and Tribal Sub Plan. The allocations for each category of funds are based on the indicators developed by the State Finance Commissions. The state plan allocations and LG share from 1997-98 is given in figure 8.1 and category wise allocations of Development Fund in figure 8.2.
Fig 8.1
Share of Grants-in-Aid in State Plan

Note: Figures in parenthesis are Grants-in-Aid as percent to State Plan
Source: Annual Plan Document & Budget Documents, various issues
Fig 8.2
Category wise Allocations during IXth, Xth and XIth 5 year Plans
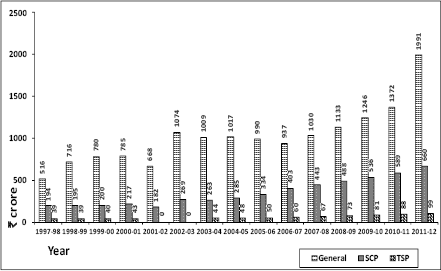
Source: Annual Plan Documents and Budget Documents, various issues
8.7 Apart from the grant from the Government, the Village Panchayats have their own funds consisting of property tax, profession tax, entertainment tax, advertisement tax etc. Further non tax revenues of Village Panchayat consists of rent from building, license fee etc.
Auditing
8.8 There are three types of auditing in the state. One is the auditing undertaken by the Director of Local Fund Audit. Secondly, the Accountant General audits about 10% of the Local Governments every year as part of the Technical Guidance Scheme. Third is the Performance Audit done by the State Performance Audit set up under LSGD. Apart from these audits, Finance Inspection Wing conducts checking of accounts.
Support Systems
8.9 In order to strengthen the Local Government system and to reduce government control, the Amendment Acts provide provisions to create separate institutions for specific purposes. They are given below:
i) The State Election Commission (SEC)
As per the provision of the Act, Kerala has constituted the State Election Commission with powers for control of the staff on election duty, preparation of voters list, verification of accounts, disqualification of candidates not submitting accounts in time and conduct of elections of President/Vice President of Local Bodies. Perhaps SEC of Kerala is one of the most powerful SECs in the country.
ii) Delimitation Commission
It is an independent body under the State Election Commision to carry out delimitation of wards of the Local Bodies for election.
iii) State Finance Commission
State has already constituted four State Finance Commissions in regular intervals; ie in 1994,1999, 2004 and 2009 and the state has implemented practically every recommendation accepted by the Government.This is a tremendous acheivement as other states lag far behind.
iv) Ombudsman
This is a high power institution to check malpractices in local bodies. Initially it was a seven member institution and later on it was made a one member institution by amending the law. Ombudsman is manned by a High Court Judge with vast powers.
v) Appellate Tribunals
It is a judicial setup in the state head quarters with a District Judge as Tribunal to consider appeals by citizens against decisions of Local Governments taken in exercise of their regulatory functions like issue of licenses, grants of permits etc.
vi) State Development Council (SDC)
SDC is set up in the State as a body like National Development Council at the centre. The council is headed by the Chief Minister and consists of the Cabinet, Leader of Opposition, Vice-Chairman of State Planning Board, Chief Secretary, DPC Chairpersons and representatives from LGs etc.
vii) District Planning Committees (DPCs)
The DPCs are constituted in each district to co-ordinate the preparation of plans by LGs, approval of Local Plans, providing suggestions to LGs, monitoring of Plan implementation etc. The DPC consists of 15 members headed by the District Panchayat President and District Collector is the Member Secretary. Twelve of the fifteen members are elected representatives from District Panchayat and Urban Local Governments in the ratio of rural -urban population in the District. One member is an expert nominated by the Government. All MPs and MLAs are permanent invitees of DPC and all the district level officers are ex-officio Joint Secretaries. The DPCs are fully functional in the State.
8.10 During the XIth plan, Kerala’s LGs have acquired some remarkable characteristics. In the last five years, the minimum ceiling prescribed to productive sector from the General Sector plan grant was increased from 30 per cent in the Xth plan to 40 per cent thus increasing capital asset creation. In the case of beneficiary oriented projects, it was prescribed that 3 per cent of beneficiaries would be disabled people with a view to ensure social security to them. Importantly, the Anti-poverty Sub Plan was included in the LGs plan as a mandatory item. The Asraya Project for destitutes has been extended to both rural and urban areas from 2007-08 onwards. Also the total Energy Security Mission was launched for implementing energy security through integrated energy plans of LGs.*
Financing of LGs plans
8.11 Financial devolution which is an important element of Kerala’s decentralization process has enabled the LGs to receive the required resources from various sources for their plan. LGs raise the resources for the local development activities from the state’s plan allocation as well from its own revenue. LGs are provided plan allocation from the state plan for two purposes1 . While the first one is for implementing LGs own schemes for local development (Development Dund or grants-in-aid) the second is to implement centrally sponsored and state sponsored schemes transferred to LGs. Figure 8.3 shows that LGs receive a major chunk of their financial resources in the form of grants–in-aid from the State.
Fig 8.3
Sources of Financing the LGs Plan

Note: Figures in parenthesis are percent of respective sources to total allocations
Source: Information Kerala Mission 2012
8.12 Compared to 2010-11, it can be seen that there is an increase in allocation in grants–in-aid with respect to other sources in 2011-122 . However, Other Sources of funds for LGs declined in the same period. Notably, there is a decline in the own fund mobilization by the LGs. This phenomenon is not limited to the last year, but has been happening for quite some time. This can be seen from the figure 8.4 provided below. It shows the share of various components to LGs plan for the last five years.
Fig 8.4
Share in LGs Plan during 2007-08 to 2011-12
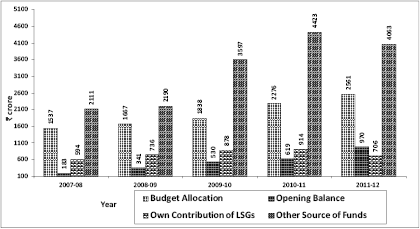
Source: Information Kerala Mission 2012
8.13 Among the various tiers of LGs, the lower tier, i.e., the Grama Panchayats receives majority of funds. However, there has been a decline in the total funds received by the Grama Panchayats in 2011-12 compared to 2010-11 (Figure 8.5). All the other tiers have improved overall fund mobilization.
Fig 8.5
Funds to Various Tiers of LGs from all Sources
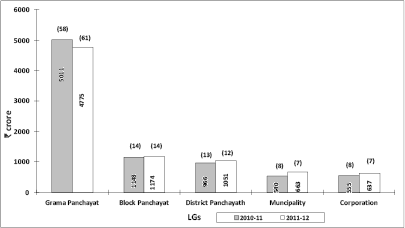
Note: Figures in parenthesis are percent to total funds received
Source: Information Kerala Mission 2012
Performance of LGs
8.14 Figure 8.6 shows utilisation of funds by LGs. Compared to 2010-11, the performance of the LGs has improved in 2011-12. However, it can be seen that all the tiers of the LGs are utilising only less than 60 percent of allocations to them.
Fig 8.6
Utilisation of Funds by LGs
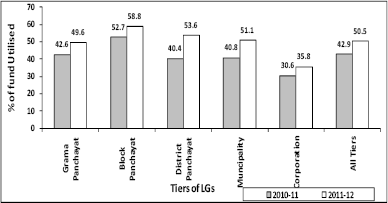
Source: Information Kerala Mission 2012
8.15 A glance over source wise utilisation of funds is provided in figure 8.7. It shows that there has been an increase in the utilisation of grants-in-aid, beneficiary contribution and other sources in 2011-12 compared to 2010-11. However, low percent of utilization is a glaring feature. Efforts have to be made to improve utilisation of resources.
Fig 8.7
Source wise utilisation of Funds by LGs
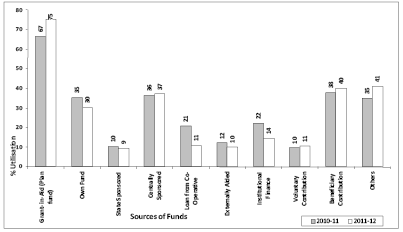
Source: Information Kerala Mission 2012
8.16 The importance of grants-in-aid in the LGs plan allocation has been brought out in the preceding analysis. A more in-depth analysis of the Grants-in-aid is given in the following sections.
Grants-in-Aid and its Utilisation
8.17 A fund is provided from the state plan to LGs in the form of un-tied plan grants (grants-in-aid) for imple-menting projects for local development. As noted earlier, it occupies a significant percent of the State’s plan outlay3 . Figure 8.8 shows state plan outlay and Grants-in-aid given to LGs for the last five years.
Fig 8.8
Grants-in-aid given to LGs

Source: Budget documents 2010-11, 2011-12
While there has been a gradual decline of the plan allocation to LGs in the last four years, it can be seen that during 2011-12 there is spike in the state’s allocations to LGs in the form grants-in- aid4.
Outlay and Expenditure of Grants-in-aid
8.18 A look at the performance of the Grants-in-aid by the LGs shows that there has been a marked impro-vement in the utilization of funds by most tiers of LGs barring the Corporations5. The tier wise details of outlay and expenditure of various types of LGs for the last two years are provided in figure 8.9.
Fig 8.9
Utilisation of Grant-in-aid by LGs
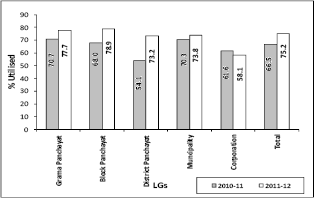
Source: Economic review 2011 and Information Kerala Mission 2012
Category-wise distribution of Grants-in-Aid and its Performance
8.19 LGs have full freedom in formulating and implementing schemes after deciding their priority subject to a general over all frame work prescribed by Government. from time to time. The allocation of grants-in-aid to LGs is in three categories – General Sector, Special Component Plan (SCP) and Tribal Sub Plan (TSP)6. The outlay for each category is fixed on the basis of the recommendations of the State Finance Commission7 . Figure 9.10 provides the category wise allocations of grant-in-aid to LGs during 2011-128.
Fig 8.10
Category wise Allocation of Grant-in-Aid to LGs
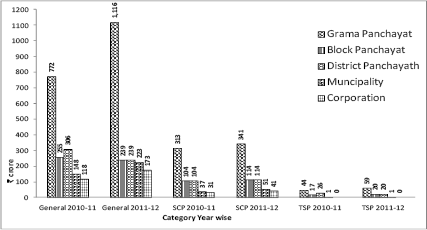
Source: Appendix IV of Budget 2010-11 &2011-12
8.20 Figure 8.10 reveals the quantum of funds received by each of the tiers of the LGs through various categories during 2010-11 and 2011-12. While Grama Panchayats received a lion’s share in all the categories of grants-in-aid, there was a tremendous increase in the General Category. Interestingly, TSP allocations to all the tiers of LGs remained the same in 2011-12 as in the previous year.
Utilisation
8.21 Table 8.11 provides the category wise utilization of grants-in-aid. While the performance has improved for both categories of General and SCP, the TSP recorded only a minor progress. This has to be seen in the backdrop that there was only a small increase in the fund allocation to TSP during this period (see figure 8.10).
Fig 8.11
Category wise performance of Grants-in-Aid to LGs
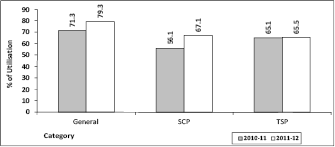
Source: Information Kerala Mission 2012
Sectoral Allocation and Performances
8.22 The LGs allocate their plan funds mainly in three sectors viz Productive, Service and Infrastructure. As far as the LGs are concerned, they have a vital role in eradicating poverty at the local level by achieving increased production, productivity, income and employment generation (Working Group Report on LSGD, 2012). The sector wise allocation and expenditure details in 2010-11 are given in figure 8.12.
Fig 8.12
Sector wise Allocation to LGs

Note: Figures in parenthesis are percent of total allocations to each sector
* are project excluded from sectoral ceilings
Source: Information Kerala Mission 2012
8.23 While it can be seen that allocations to all sectors have increased in 2011-12 compared to 2010-11, the quantum of increase in the service sector is much higher than others. The service sector also occupies a major share compared to others in allocations. However, there is a decline in allocations to projects that are excluded from sectoral ceilings10. Detailed sector wise allocation and utilization is attempted in the following sections.
Productive Sector
8.24 Figure 8.13 shows the sub-sectoral allocations in the productive sector. There is increase in both funds allocated as well as utilization of funds in 2011-12 compared to 2010-11. It can be seen that allocations to agriculture as well as its utilization has notably recorded an increase in 2011-12. Glaringly, allocations to the environment sector, though it has recorded a jump in 2011-12 is meagre11.
Fig 8.13
Allocation & Utilisation in Productive Sector
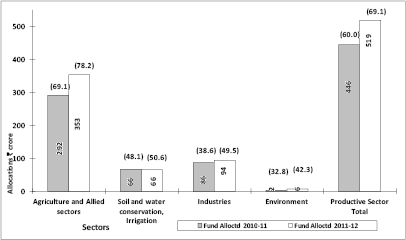
Note: Figures in parenthesis are percent of utilisation of each sector
Source: Information Kerala Mission 2012
However, it can be seen that the utilisation pattern of these sub sectoral funds are very poor in the productive sector. While the overall utilisation shows a less than 70 %, all sub sectors other than agriculture lags way behind in utilizing their allocation.
Service Sector
8.25 Figure 8.14 shows the allocation and utilisation in detail in the service sector. Overall there has been a spike in both allocations and utilization to the service sector in 2011-12 compared to 2010-11. It reveals the importance of social service sector and health. Compared to other sub sectors in the service sectors it also has recorded substantial increase in allocations. Allocations to labour and Labour welfare received meagre funding12.
Fig 8.14
Allocation & Utilisation in Service Sector
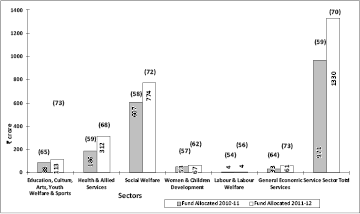
Note: Figures in parenthesis are percent of utilisation of each sector
Source: Information Kerala Mission 2012
8.26 In the fund utilisation scenario, the service sector has better fund utilisation than the productive sector. Here the social welfare and health sectors are seen to have more efficient in utilizing their funds. However, the level of spending is seen to be the major issue in service sector also (less than 71percent).
Infrastructure Sector
8.27 The infrastructure sector has also shown a considerable rise in allocations. Figure 8.15 shows the allocation to the Infrastructure sector in detail.
Fig 8.15
Allocation & Utilisation in Infrastructure Sector
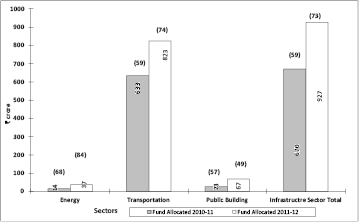
Note: Figures in parenthesis are percent of utilisation of each sector
Source: Information Kerala Mission 2012
8.28 The transportation sector which is largest beneficiary has recorded a increase in allocations in 2011-12 compared to 2010-11. Allocations to energy sector however have been low13 . In the fund utilisation scene, it can be seen that there is improvement in the infrastructure sector as a whole. The transportation sector has also shown improvements in utilising the funds.
Performance under Special Sector Plans
8.29 From Xth plan period onwards, Women Component Plan and Plan for Disadvantaged groups (Aged, children and disabled) has been introduced in the plan of LGs14 . Figure 8.16 shows the allocation to the Special sector plans in detail. In the Special Sector Plan, overall allocations as well as allocations to some sub-sectors have declined in 2011-12 compared to 2010-11. While there is an increase in allocation to most of the plans under this sector, plans such as EMS and Anti-Poverty have shown a decline in allocations15.
Fig 8.16
Allocation & Utilisation in Special Sector Plans
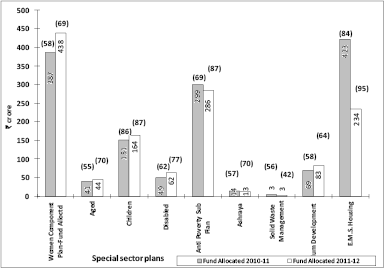
Note: Figures in parenthesis are percent of utilisation of each sector
Source: Information Kerala Mission 2012
8.30 It can be seen that there is an improvement in utilisation of funds in 2011-12 compared to 2010-11. There has been higher allocation for women component plan, for the aged, children and for the disabled. In all these cases, despite increased allocation, fund utilization improved, showing greater efficiency.
Achievements and Challenges
Achievements
Experience in decentralized planning has some unique as well as notable achievements which are given below.
1. The methodology adopted in local level planning is in full spirit of the 73rd & 74th Amendment Acts. Planning process has been made highly participatory with the involvement of local people.
2. Devolution of funds to the local bodies for plan implementation has been ensured. This has brought out enormous enthusiasm for local level development and public satisfaction.
3. Decentralised planning could facilitate the provision of minimum needs in infrastructure, housing, road connectivity, water supply etc. at the block and village levels.
4. There has been a noted improvement in service delivery especially in the field of education, health anganwadies etc.
5. The process and procedures have become more transparent.
6. Improved capacity building among elected representatives as well as officials.
7. Replicable development models emerged in different places.
8. Remarkable achievements in formation of women self help groups and their involvement in different development activities.
9. Women participation in local level development administration.
Challenges
The Decentralised Planning process is facing some challenges too. Some of the observations are placed below:
1. The enthusiasm shown by the people in the initial years is slightly decreasing in different levels.
2. Participation in Grama Sabhas/Ward Sabhas is not showing an encouraging trend as the better off section of the society mostly do not participate in Grama Sabhas.
3. Local bodies have been given the freedom to prepare projects and plans independently. In many cases this leads to lack of integration of projects and plans.
4. Local bodies tend to take small schemes/projects instead of integrated larger projects.
5. Local bodies are concentrating more on annual plans without having long term vision.
6. Experiences show that the projects aimed at the local economic development are not getting much attention in local planning.
7. Though decentralisation has brought about attention to inclusive development, more efforts need to be taken to include some extremely marginalized sections in the society like tribals and destitutes.
8. The tendency of spreading resources to too many small projects results in resource constraints for selection of better and larger projects.
9. Grama Panchayat being the lower tier has highest number of works to be carried out. Unfortunately it has the lowest level of capacity in terms staffing pattern of officers.
10. LGs have a weak statistical system to collect the data base and a weak monitoring mechanism.
CONCLUSION
Kerala has been a leader in participatory and decentralised development and the model is beeing highly appreciated both nationally and internationally. The formulation of district plans with long term vision after involving the co-operation of all LSG’s, periodic conducting of social audits ,revitalising of Grama sabha/Ward sabha and greater community participation in local level planning can take the current accomplishment in local level planning and development to even greater heights.
References
Bardhan, Pranab and Dilip Mookherjee. 2007. “The Rise of Local Governments: An Overview” in Pranab Bardhan and Dilip Mookherjee (eds.), Decentralisation and Local Governance in developing Countries: A Comparative Perspective, Oxford University Press, New Delhi.
Robinson, Mark. 2003. “Participation, Local Governance and Decentralised Service Delivery”. Accessed from www.logolink.org/index.php/resource/download/534 on 14 January 2013.
Government of Kerala. 2011. “Report of the Fourth State Finance Commission Kerala Part 1.” Published by the Ministry of Finance. Accessed from http://finance.kerala.gov.in/index.php?option=com_docman&task=cat_view&gid=143&limit=20&limitstart=0&order=hits&dir=DESC&Itemid=57 on 17th January 2013.
Government of Kerala. 2012. “Working Group Report on Local Governments”. State Planning Board. Thiruvananthapuram. August.
Vijayanand, S.M. 2009. “Kerala-A Case Study of Classical Democratic Decentralisation”. Kerala Institute of Local Administration. Thrissur.
Government of Kerala. “Appendix IV- Details of Provisions Earmarked to Panchayat Raj/Nagarapalika Institutions in the Budget for 2012-13”. Ministry of Finance. Various Issues.
Government of Kerala. “Annual Plan Proposals”. State Planning Board. Thiruvananthapuram. Various Issues.