Chapter 6
EXTERNAL SECTOR
Introduction
Kerala economy has always been more open than the Indian economy. A much higher portion of its produce had external market as its destination and a sizable part of its consumption came from outside. The last four decades have also seen a sizable proportion of its labour force exploring the globe for employment and the last two decades have seen large number of labourers from other States of India entering Kerala in search of work. The growing remittance flow into the Kerala economy- the ratio of remittances to GSDP rising from 0.12 in the early 1990s to 0.22 in the early 2010s- has been one of the engines of growth of the economy. The last two decades have seen tourism bloom in Kerala. Currently, the contribution of tourism to the Kerala economy is over 10 per cent equalling that of agriculture. Thus, the trends in external trade, migration and tourism have a significant impact on the economy of Kerala.
Section 1
External trade
India’s share in global exports and imports increased from 0.8 per cent and 1.0 per cent respectively in 2004 to 1.7 per cent and 2.5 per cent in 2013. Its ranking in terms of leading exporters and importers improved from 30 and 23 in 2004 to 19 and 12 respectively in 2013. While India’s total merchandise trade as a proportion of Gross Domestic Product (GDP) increased from 29.0 per cent in 2004-05 to 41.8 per cent in 2013-14, India’s exports as a proportion of GDP increased from 12.1 per cent to 17.0 per cent during the same period.
6.2 As the commercial gateway of Kerala, external trade operations in the State is mainly conducted through Cochin Port. Important items of trade include pepper, cashew, coir and coir products, tea, cardamom, ginger, spices and spices oil and marine products. The total traffic handled by the Port during 2014-15 recorded an increase of 3.4 per cent to reach 215.95 lakh MT as against 208.86 lakh MT, in2013-14. Exports which showed an increase of 10.85 per cent to become 42.50 lakh MT in 2013-14 declined by 4.52 per cent and reached 40.58 lakh MT in 2014-15. Imports during the period increased to 175.37 lakh MT from 166.36 lakh MT in 2013-14.While exports in quantitative terms declined by 4.51 per cent, the value decreased by 4.9 per cent during the period 2014-15 (see Table 6.1).
Table – 6.1
Cargo Handled at Cochin Port during 2010-11 to 2014-15 (In Lakh MT)
Traffic |
Export |
Import |
||||||||
2010-11 |
2011-12 |
2012-13 |
2013-14 |
2014-15 |
2010-11 |
2011-12 |
2012-13 |
2013-14 |
2014-15 |
|
1 |
2 |
3 |
4 |
5 |
6 |
7 |
8 |
9 |
10 |
11 |
Coastal |
12.04 |
14.86 |
14.05 |
17.18 |
16.48 |
48.21 |
51.74 |
52.12 |
60.63 |
52.15 |
Foreign |
22.00 |
28.25 |
24.29 |
25.32 |
24.10 |
96.47 |
106.06 |
107.99 |
105.73 |
123.22 |
Total |
34.04 |
43.11 |
38.34 |
42.50 |
40.58 |
144.68 |
157.80 |
160.11 |
166.36 |
175.37 |
Source: Cochin Port Trust
6.3 Export of commodities through Cochin Port showed a declining trend during 2014-15. In 2014-15,only two commodities showed an increase in the exports: cashew kernels & coir products the export of which declined during 2013-14 revived in 2014-15 showing an increase of 3.7 per cent and 1.1 per cent respectively. Exports of goods like tea declined by 6.5 per cent, sea foods by 6.5 per cent, spices by 11.6 per cent, coffee by 13.8 per cent and miscellaneous items including POL by 3.7 per cent in 2014-15 over the period 2013-14. (See Appendix 6.1)
6.4 Imports through Cochin Port continued to increase in 2014-15 touching 175.37 lakh MT compared to 166.36 lakh MT in 2013-14 showing an increase of 5.4 per cent. Fertilizers and raw materials, iron & steel and machinery, newsprint, raw cashewnut, Petroleum, Oil and Lubricants (POL) etc. are the main items of import. No food grains are imported continuously for the last three years. The growth rate of import of miscellaneous items which was 5.2 per cent in 2013-14 declined to 4.8 per cent during 2014-15. Fertilizers and raw materials the import of which continued to decline since a while increased by 44.91per cent during 2014-15. Import of iron, steel and machinery which was decreasing continuously, increased by a record rate of 207.3 per cent in 2014-15. There was no import of newsprint during 2014-15,but import of cashewnut increased by 2.3 per cent (See Appendix 6.2).
6.5 Coastal and foreign exports through Cochin Port which increased by 4.1 per cent during 2013-14 declined by 4.8 per cent in 2014-15. Coastal export decreased from 17.18 lakh MT in 2013-14 to 16.48 lakh MT in 2014-15 whereas foreign export which was 25.32 lakh MT in 2013-14 fell to 24.10 lakh MT during 2014-15. While coastal imports declined by 14 per cent, foreign imports increased by 16.5 per cent during the period 2014-15. (Table 6.1)
Marine products
6.6 Marine products exports from Kerala, both in quantity and value increased in 2014-15; quantity has increased from 165,698 MT in 2013-14 to 166,754 MT in 2014-15 and value from ₹470636 lakh to ₹516608 lakh for the same period. But the share of Kerala in Indian exports declined from 16.84 per cent in 2013-14 to 15.86 per cent in 2014-15 in terms of quantity and from 15.58 per cent to 15.45 per cent for value during the reported period. (Table 6.2).
Table 6.2
Export Trend of Marine Products – India & Kerala (2010-11 to 2014-15)
Year |
INDIA |
KERALA |
KERALA’S share % |
|||
Quantity (Tonnes) |
Value (₹ Lakh) |
Quantity (Tonnes) |
Value (₹ Lakh) |
Quantity |
Value |
|
2010-11 |
813091 |
1290147 |
124615 |
200210 |
15.33 |
15.52 |
2011-12 |
862021 |
1659723 |
155714 |
298833 |
18.06 |
18.00 |
2012-13 |
928215 |
1885626 |
166399 |
343585 |
17.93 |
18.22 |
2013-14 |
983756 |
3021326 |
165698 |
470636 |
16.84 |
15.58 |
2014-15 |
1051243 |
3344161 |
166754 |
516608 |
15.86 |
15.45 |
Source: The Marine Products Export Development Authority (MPEDA)
6.7 USA is the largest market for Indian marine products with a share of 26.46 per cent followed by South East Asia (25.71%), European Union (20.08%) and Japan (9.11%), other countries (8.58%), Middle East (6.04%) and China (4.02%).
6.8 Commodity wise import through Cochin Port during 2011-12 to 2014-15 is given in Appendix 6.2. Item wise details of marine products export from India and Kerala during 2014-15 are given in Appendix 6.3.
Cashew
6.9 Exports of cashew kernels which had shown a sharp drop in 2012-13 revived in 2013-14. While the trend continued in 2014-15, the rate of growth of both quantity and value were lower. Kerala’s share in total exports of cashew kernels from India in quantitative terms, which was 57.22 per cent in 2013-14 marginally increased to 57.29 per cent in 2014-15. In value terms it was 56.57 per cent in 2013-14 and reached 57.04 per cent during 2014-15 (Table 6.3). USA, UAE, Netherlands, Japan, Saudi Arabia, UK, France, Spain, Germany, Korea, Iran, Malaysia etc. were the major markets for Indian cashew kernels in 2014-15 also.
6.10 The export of cashew nut shell liquid/ cardanol from India during 2013-14 which was 9480 MT valued at ₹38.6 crore increased to 10938 MT with a value of ₹55.81 crore in 2014-15; the quantity of exports increased by 15.38 per cent and value by 44.58 per cent. But export of cardanol through Cochin Port which was 872 MT with a value of ₹2.66 crore in 2013-14, declined to 818 MT valued at ₹2.70 crore in 2014-15 (Appendix 6.4).
Table 6.3
Export of Cashew Kernels – Kerala & India (2010-11 to 2014-15)
(Qty: MT, Value: ₹crore)
Year |
KERALA* |
INDIA |
Share of Kerala (%) |
|||
Quantity |
Value |
Quantity |
Value |
Quantity |
Value |
|
2010-11 |
56578 |
1478.67 |
105755 |
2819.39 |
53.50 |
52.45 |
2011-12 |
69149 |
2299.67 |
131760 |
4390.68 |
52.48 |
52.38 |
2012-13 |
53624 |
2138.47 |
100105 |
4046.23 |
53.57 |
52.85 |
2013-14 |
65679 |
2861.75 |
114791 |
5058.73 |
57.22 |
56.57 |
2014-15 |
68150 |
3098.75 |
118952 |
5432.85 |
57.29 |
57.04 |
*Export through Cochin Port. Source: The Cashew Export Promotion Council of India
6.11 Import of raw cashewnut through Cochin Port which was 201955 MT in 2013-14 increased by 2.27 per cent to reach 206542 MT in 2014-15. (Appendix 6.2)
Coffee
6.12 Export of coffee from India during 2014-15 was 199441 MT (provisional) valued at ₹3509.42 crore. There is a decline of 34.83 per cent in quantity and 22.97 per cent in value over the previous year in which export was 306029 MT valued at ₹4555.77 crore.
6.13 Export of coffee from Kerala through Cochin Port during 2013-14 which was 75631 MT valued at ₹872 crore, declined to 65216 MT valued at ₹749.98 crore during 2014-15. The decline was 14.01 per cent in value and 13.77 per cent in quantity.
Tea
6.14 Export of tea through Cochin Port during 2014-15 was 90348 MT valued at ₹478.21 crore. This shows a decrease of 6.55 per cent in quantity and the same per cent in value, the quantity of export during 2013-14 being 96681 MT and value ₹511.71 crore.
Coir and Coir Products
6.15 The exports of coir and coir products through Cochin Port which recorded a decrease of 12 per cent during 2013-14 revived marginally by 1.1 per cent in 2014-15. Quantity of exports which stood at 124116 MT with a value of ₹385.37 crore in 2013-14 slightly increased to 125523 MT valued at ₹389.12 crore during 2014-15. Main items of exports are coir mat, coir yarn and other coir products. Export trend of coir and coir products through Cochin Port for the period from 2009-10 to 2014-15 is shown in the graph. (Figure 6.1)
Fig 6.1
Export Trend of Coir and Coir Products from Cochin Port.
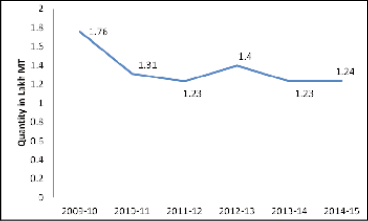
Source: Cochin Port Trust
Spices
6.16 In 2014-15, a total of 893920 MT of spices and spice products valued at ₹14899.68 crore has been exported from India, as against 817250 MT with a value of ₹13735.40 crore in 2013-14. This shows an increase of 9.38 per cent in volume and 8.48 per cent in value. The total export of spices during 2014-15 also has exceeded the target in terms of both quantity and value: 755000 MT and ₹12304.90 crore respectively.
6.17 As per estimates of Spices Board, export of spices from Kerala (through Cochin and Thiruvananthapuram Ports) increased to 81555.27 MT valued at ₹3285.34 crore in 2014-15 from 81412.60 MT with a value of ₹3253.40 crore during 2013-14, recording a meager value - the exports increased by 0.18 per cent and value by 0.98 per cent (The figures of exports of spices through Cochin port vary with this figure for Cochin port exports products of other states also). Pepper, cardamom, chilli, ginger, turmeric, coriander, cumin, celery, fennel, fenugreek, other seed spices, garlic, tamarind, nutmeg and maize, other miscellaneous spices, curry powder/mixture, spice oils and oleoresins and mint products are the main items of exports through Kerala ports.
Section 2
Non Resident Keralites
6.18 Non resident Keralites play a vital role in the development of the State. Their contribution to the development can be seen at family level, community level and state/country level. At family level it has improved household earnings, food,consumption, health care, housing and educational attainments and for over three decades remittances have been meeting the current account deficit of the country. The Non-Resident Malayali Census 2013 of Economics and Statistics Department, Government of Kerala, identified that out of the 16.25 lakh Non-Resident Malayalis, 14.26 are working in different jobs. Around 50 lakh people in Kerala are dependent on Non Resident Malayalis. Country wise, 90% of Non-Resident Malayalis are working in the Gulf region.
Fig 6.2
District Wise Proportion of NRKs in Kerala
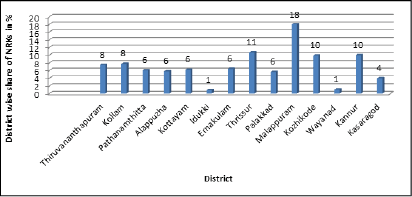
Source: Economic and Statistics Department,GoK
6.19 As per the survey conducted by Economics and Statistics Department of Government of Kerala, the largest number of NRKs are reported from Malappuram, their proportion to the total NRKs being 18 per cent. Thrissur is in the second position accounting for 11per cent of the total followed by Kannur and Kozhikide with 10per cent share each. Idukki and Wayanad are the two low NRK reporting districts and their share to the total NRKs are 1per cent each. Appendix 6.5 shows the district wise proportion of NRKs in Kerala.
Number of Working NRKs
6.20 Out of the total Non-Resident Keralites, 87.77per cent are engaged in different economic activities. Among those employed, 93.04per cent are men and 6.96per cent are women. District wise, Malappuram has the highest proportion of 19.51per cent NRKs employed followed by Thrissur and Kozhikode at 10.50per cent and 10.37per cent respectively. Even though Idukki reported the lowest share in employed NRKs women NRKs employed is 32.83per cent of total working women NRKs. Second highest proportion of female working NRKs is reported from Kottayam (31.68per cent).The district and gender wise ratio of working NRKs are given in the Appendix 6.6.
Fig 6.3
District Wise Working NRKs in Kerala

Source: Economics and Statistics Department, Government of Kerala
Country Wise Working NRKs
6.21 Distribution of NRKs by country showed that 35.54per cent are in UAE and 29.5 per cent in Saudi Arabia. Figure 6.4 gives the country wise proportion of NRKs in Kerala. Gender wise data shows that the proportion of female NRKs to total NRKs is higher in UK with 34.21per cent, followed by Canada at 33.01per cent and other European countries with 29.34 per cent.The lowest female NRKs are identified from Qatar with 3.7per cent of the total NRKs in Qatar.
Fig 6.4
Country wise Working NRKs
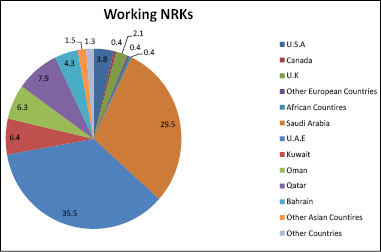
Source: Ecomomics and Statistics Department, Government of Kerala
Professional NRKs
6.22 In recent years, the pattern of emigration in terms of the skill content has changed. In the 1970s, the proportion of skilled workforce to the total emigrants was very small. Now larger number of skilled workforce from different professions such as doctors, nurses, engineers, IT professionals and teachers are seeking employment outside the country. Distribution of NRKs by profession showed that 11.85 % of them are working as drivers, 10.99% as salesmen, 6.37% as nurses, 3.78% as engineers, 2.23% as IT professionals and 0.53% as doctors and the remaining 67.78% working in different spheres like businessman, teachers and bank professionals.
6.23 Among the doctors, the highest share is reported from Thiruvananthapuram at 14.39% followed by Kottayam and Ernakulam with 14.38% and 14.34% respectively.The lowest share is from Wayanad.In the case of nurses, the highest proportion is from Kottayam at 23.73% followed by Pathanamthitta at 20.75 % and Ernakulam at 18.16 %. For engineers, Ernakulam has the highest proportion of 13.47 %,followed by Thrissur at 13.23 % and then Kottayam at 10.11 %. Among teachers, Pathanamthitta has the highest share of 16.69 % followed by Alappuzha at 15.99 % and then Kottayam at 9.74%. Figure 6.5 shows the district wise number of NRKs working in different jobs abroad.
Fig 6.5
District-wise NRKs working in different jobs
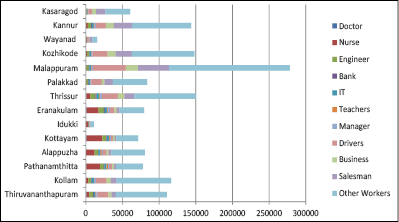
Source: Economics and Statistics Department,Government of Kerala.
Box 6.1
Glimpse of Plan schemes,Services and Own Project Offered by Norka Roots
Rehabilitation of Return Migrants, is a scheme which aims to reintegrate returned emigrants by helping them to find suitable employment/self employment as a step towards their rehabilitation. Government has formulated Norka Department Project for Return Emigrants (NDPREM) to develop a sustainable Business Model.The project envisages providing a capital subsidy of 10 % of the total project cost as a backened subsidy to eligible entrepreneurs among return emigrants who wish to start their own ventures in the field of agri-business,training,services and manufacturing.
Santhwana, is a scheme which provides financial assistance to NRKs (returnees) whose minimum period of services abroad is of two years and the period after return is not exceeding10 years. For medical assistance ₹50,000/- is provided and death assistance is maximum ₹1,00,000/-, marriage assistance is ₹15000/- and for wheel chair crèches and artificial limbs ₹10,000/ is provided as assistance.
Swapna Saphalyam, The lower segments of Non –Resident Keralites working abroad especially in Gulf countries are subjected to various miseries due to lack of labour protection rules. It is estimated that 1400 Indians are jailed in Saudi Arabia alone, of which 80% being NRKs. The scheme proposes to address those NRKs jailed abroad for no wilful default on their part and aims to provide free air tickets when they are released from jails and are not able to afford the tickets.
Pravasi Legal Assistance (Pravasi Legal Aid Cell), One of the major problems faced by the migrant workers from Kerala to the Middle East Countries is the court cases and other legal problems they get into. In the absence of any sort of legal help, the poor workers end up in jail and suffer from all forms of punishments. This happens even in the cases of minor offence or without any offences. The scheme proposes extending legal assistance by Government including appearances in courts abroad, through the Indian Diplomatic Missions or through advocates empanelled by the Indian Mission.
24 Hours Help Line/Call Centres, intends to disseminate information on various schemes/projects implemented by Government and NORKA Roots, redress grievances of NRKs, conduct counselling to NRKs who are in distress, create awareness among emigrants and prospective emigrants against illegal exploitation, migration etc. and to act as a frontline service facilitator/one point client interaction point for NRKs. It is also envisaged to provide need based information and assistance to emigrants through the proposed helpline.
Pre Departure Orientation Programme, The potential migrants lack awareness in matters connected with emigration in general and overseas job in particular. The scheme is intended to impart orientation and training to these prospective emigrants before departing to their destination countries so as to ensure legal migration. The widespread rural penetration of this scheme will restrict prevalence of illegal migration and exploitation by unscrupulous recruiting agents.
Section 3
Tourism
6.24 Tourism has been experiencing an uninterrupted global growth in recent years and recorded 4.3 percent increase and a total 1133 million tourist arrivals in 2014. International tourism receipts reached US$ 1245 billion worldwide in 2014, corresponding to an increase of 3.7 percent in real terms. Tourism has turned into a key driver of socio-economic progress through the creation of jobs and enterprises, export revenue and infrastructure development across the world.
6.25 Tourism in India has also been exhibiting a robust growth and there was a 10.2 per cent increase in foreign tourist arrivals with 7.68 million tourist visitors in 2014. Foreign exchange earnings reached a level of ₹1,23,320 crore and recorded a 14.5 percent increase in 2014 over the previous year.
6.26 Kerala with its natural advantages in tourism like long shoreline, high hill ranges with rich biodiversity and wild life, rivers, back waters, lagoons and equitable climate has turned tourism into a growth engine in the last 30 years. Today Kerala is one of the most sought after destinations in the world. Tourism industry in Kerala has turned into a ₹24885.44 crore revenue generating activity hosting 12.62 million domestic and foreign tourists in 2014.
Recent Trends in Tourist Arrivals in Kerala
Foreign Tourist Arrivals
6.27 Foreign tourist arrivals registered a 7.6 percent annual increase in 2014 with 0.92 million foreign tourists’ visits, compared to 8.12 percent annual increase in 2013 and 0.85 million foreign tourist visits. This shows a marginal decrease in the growth of foreign tourist arrivals in 2014 compared to that of the previous year. The recent trends in foreign tourist arrivals is exhibited in Figure 6.6.
Fig 6.6
Recent trends in Foreign Tourist Arrivals in India and Kerala
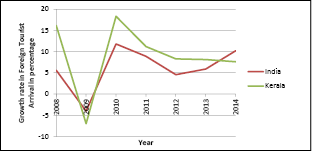
*Quick estimate of foreign tourist arrivals from January to October 2015
Source: Department of Tourism, Government of Kerala
6.28 Foreign tourist arrivals recorded positive growth rates at National and State levels, except for 2009 when world economic crisis impacted tourist inflow. In subsequent years, State tourism performed better than National level. But the National average surpassed State annual growth rate of foreign tourist arrivals in 2014 for the first time in a decade. The State tourism has been witnessing a slowdown in annual growth rates, since 2010. The quick estimates of 2015 records still lower rate of 6.3 percent growth with 7,75,390 foreign tourist arrivals from January to October 2015, compared to the same period in 2014. Appendix 6.7 shows the National and State foreign tourist arrivals and annual growth rates from 2008 onwards.
6.29 The share of the State in the national pie of foreign tourist arrivals is 12.02 per cent in 2014 whereas it was 12.31 percent in the preceding year. Kerala ranks 7th in foreign tourist arrivals in 2014. Tamil Nadu, the neighbouring state ranks first in foreign tourist arrivals and captures 20.6 percent of the national pie.
Seasonality in foreign tourist arrivals
6.30 Foreign tourist arrival is seasonal which takes place mostly in the beginning and ending months of a year. Figure 6.7 depicts the pattern of foreign tourist arrivals from January to December 2014.
Fig 6.7
The pattern of foreign tourist arrivals from January to December 2014

Source: Department of Tourism,GoK.
6.31 The trend line of foreign tourist arrivals in 2014 is U shaped which shows lower levels of foreign tourist arrivals from April to September months. The Department of Tourism has taken many measures to make Kerala an all time destination and promoted products like monsoon tourism, Meeting Incentive Conference and Events (MICE) tourism, customised packages for non season etc. This has to be continued and new products fit for all seasons may be introduced to convert tourism to an all time activity generating sustainable income and full time employment. Besides, market specific, multi pronged marketing strategy based on market analysis should be put in place to attract foreign tourists to the State throughout the year.
Domestic Tourist Arrivals
6.32 Domestic tourist visits to Kerala was 11.7 million in 2014 and registered an annual growth rate of 7.71 percent. There was also a marginal decrease in growth rate as the annual growth rate was 7.75 percent in the previous year. The recent trends in National and State domestic tourist visits in terms of annual growth rate is exhibited in Figure 6.8.
Fig 6.8
Recent Trends in Domestic Tourist Visits in India and Kerala
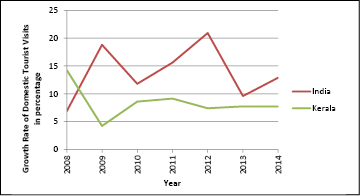
*Quick estimate of domestic tourist visits from January to October 2015
Source: Department of Tourism,GoK.
6.33 Domestic tourism in India is predominantly pilgrim tourism where the State lags behind the national average growth rates over the years. A notable feature is that the national growth rate in domestic tourist visits is always greater than State annual growth since 2009 and has increased in 2014, while the State annual growth shows a slight slowdown. The quick estimates of 2015 shows a further decline in growth rate at 7.21 percent with 99, 53,137 domestic tourist visits in January to October 2015, compared to the same period in 2014. As far as the share of the State in the national pie of domestic tourist visits is concerned, it is only 0.9 percent in 2014. Appendix 6.8 shows the National and State domestic tourist visits and annual growth rates from 2008.
Source Markets of Tourist Arrivals
6.34 China has been the fastest growing source market for international tourism in recent years and has been the world’s top spender in international tourism since 2012, followed by the United States, Germany, the United Kingdom, Russian Federation, France and Canada. The main tourist generating countries for Indian tourism are the United States followed by Bangladesh, United Kingdom, Sri Lanka, Russian Federation and Canada. The first three countries together contribute around 38 percent of tourist arrivals to India.
6.35 In 2014, the United Kingdom is the top source market for Kerala with 17.45 percent share, followed by France (9.85 percent), the USA (8.41 percent), Germany (8.20 percent), and Saudi Arabia (7.04 percent). The percentage share of the top countries in the foreign tourist arrivals to Kerala is represented in Figure 6.9.
Fig 6.9
Share of the top five countries to foreign tourist arrivals to Kerala
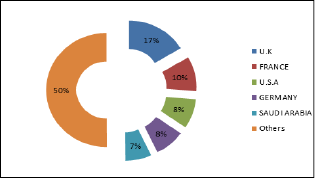
Source: Department of Tourism,GoK.
6.36 All the five countries together account for 50 percent of total foreign tourist arrivals to the State. Appendix 6.9 shows the share of major international source markets to Kerala tourism.
6.37 As per the Continuous Survey Report 2012-13 of Tourism Department, Government of Kerala, about 74 percent of the domestic tourist visits in Kerala originates from within the State. Among the other states, Tamilnadu dominates with 10.5 percent of the tourists followed by Karnataka, Maharashtra, Andhra Pradesh and Delhi with shares of 5.74 percent, 3.0 percent, 1.56 percent and 1.34 percent, respectively. The main purpose of visit of domestic tourists was leisure, recreation and holiday with a share of 35.60 per cent of tourists. Another 30.29 percent of the tourists visited Kerala for business, conferences and meetings. Pilgrim or religious visits accounts for only 7.55 in 2012-13. Company executives in the private sector, business men, and public and private sector employees were the main domestic visitors to Kerala.
District Profile
6.38 Tourism is highly concentrated in southern districts of the State. Ernakulam, Thiruvananthapuram and Idukki are the three southern districts that find place in top five districts in both the foreign and domestic tourism segments. The only one northern district that finds place in top five districts is Kozhikode which ranks 4th in domestic tourist visits. The number of foreign tourist and domestic tourist visits to top five districts in 2014 is depicted in Figure 6.10 and Figure 6.11 respectively.
Fig 6.10 Top Five Districts in Foreign Tourist |
Fig 6.11 Top Five Districts in Domestic Tourist |

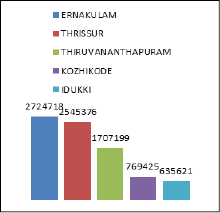
Source: Department of Tourism, Government of Kerala
6.39 The total foreign tourist arrivals and domestic tourist visits to the State was 9.23 lakh and 116.95 lakhs, respectively in 2014. The top five districts captured 92 percent of foreign tourist arrivals and 72 percent of domestic tourist visits to the State in 2014. Ernakulam district is at the top and Pathanamthitta district is at the bottom in both the foreign and domestic tourist arrival segments. The number of foreign and domestic tourist visits to 14 districts is provided in Appendix 6.10.
Growth in accommodation
6.40 There is an increase in number of accommodation units and rooms in 2014 compared to the previous year. Total number of star accommodation units is 409 and rooms 11387 which registered an increase by 13 units and 1022 rooms over the previous year. Appendix 6.11 provides the categories of star accommodation units and number of rooms at State in 2014.
Government Initiatives in Tourism
6.41 The thrust of the Government with regard to tourism is to promote private investment, draw quality visitors and provide unique experience and safeguard the interest of host communities, visitors and the nature as is explicit in the State Tourism Policy 2012. The Government support in creating infrastructure, marketing in domestic and international markets and building up quality human resource has been critical for the growth of the tourism sector, especially since tourism has been declared as an industry in 1986. The establishment of Kerala State Tourism Development Corporation (KTDC) in 1966 for building up basic infrastructure in hospitality sector and running hotels and wayside amenities in the State was a landmark in tourism development.
6.42 Another land mark in tourism development was the establishment of the Tourist Resorts Kerala Ltd in 1989, later renamed as Kerala Tourism Infrastructure Ltd (KTIL) for tourism investment promotion and infrastructure development through partnership models. KTIL runs a joint venture with the Taj Group, namely Taj Kerala Hotels and Resorts Ltd in three destinations, namely Varkala, Kumarakom and Ernakulam. Bekal Resorts Development Corporation (BRDC) founded in 1995 concentrates on tourism promotion in Bekal in Kasaragod district and surrounding areas which had no distinctive mark in Kerala Tourism map then. District Tourism Promotion Councils under the auspices of district administrations have also been promoting creation of destinations and tourism products across the State.
Government Spending
6.43 The State Government allocates about one percent of its total budget to tourism sector every year. In addition, Ministry of Tourism, Government of India has also been earmarking funds for tourism projects in the State. Table 6.4 shows the funding of State and Union Governments to Kerala Tourism since 2011-12. State funds include supplementary allocation over and above the budgetary allocation.
Table 6.4
State and Union Government Funding to Kerala Tourism since 2011-12
(Rs crore)
Year |
State Funding |
Union Funding |
Total Funding |
2011-12 |
182.49 |
23.76 |
206.25 |
2012-13 |
180.53 |
78.26 |
258.69 |
2013-14 |
214.89 |
34.67 |
249.56 |
2014-15 |
245.36 |
0 |
245.36 |
Source: Department of Tourism, Government of Kerala
6.44 The major chunk of government spending has been on infrastructure projects like development of basic amenities in tourism destinations, beautifications, quality wayside and waterside amenities, state of the art information centres, visitor lounges, infrastructure for land and water based adventure tourism, erecting international quality tourism signage at destinations and en-route, tourism transportations and safety and security aspects of tourists.
6.45 The second focus area in government spending has been marketing. The government has succeeded in branding Kerala Tourism in international market with the title “God’s own country”. The State has consolidated its marketing efforts in domestic and international markets through advertising in print and television media, taking up innovative marketing like Train Branding, Airport Branding, Staging of road shows, seminars and workshops, and conducting familiarization trips for tour operators, leading travel writers and journalists, participating in trade fairs and also making use of the promises of information and communication technologies like social media campaign, viral video clips, web optimisation, and software solutions. It also has been creating new brands like The Great Backwater of Kerala, Kerala-Home of Ayurveda, Your Moment is Waiting, Dream Season etc in a big way.
6.46 Quality human capital with labour standards is fundamental to tourism development in any region. Shortage of skilled manpower in tourism is a challenge to Indian Tourism. The State Government arms like Kerala Institute of Tourism and Travel Studies (KITTS), State Institute of Hospitality Management (SIHM) and Food Craft Institutes (FCIs) have been creating quality manpower in travel, tourism and hospitality sectors. Figure 6.12 shows the pattern of government spending in 2014-15.
Fig 6.12
Governments Spending in Tourism in 2014

Source: Department of Tourism, Government of Kerala
6.47 The figure makes it clear that 73 per cent of total government funding to the tourism sector in 2014 goes to infrastructure development, 20 percent to marketing and 3 percent to human resource development and 4 percent to other activities.
Economic Impact
6.48 Tourism activities have a wide impact on the economy in terms of creating jobs and income for the households through tourists’ spending in the local economy. It generates income in a large number of activities like hotels and accommodation units, restaurants, travel agencies and tour operators, transport services, tourist resorts and complexes, entertainment facilities, shopping, conferences and conventions, adventure and recreational facilities, guide services etc.
6.49 With increasing tourist inflows, the tourism sector is a significant contributor to the State economy. The direct contribution of the industry is in foreign exchange earnings and domestic tourist earnings. The foreign exchange earnings from tourism during the year 2013 were ₹5560.77 crore which increased to ₹6398.93 crore in 2014 registering an increase of 15.07 per cent. Domestic tourist earnings for the year 2013 were ₹11726.44 crore that increased to ₹12981.91 crore in 2014 registering an increase of 10.78 per cent.
6.50 The tourism industry in broader terms has great indirect multiplier impact in the economy through backward and forward linkages and also induced impact through spending of benefitted households and firms in the economy. Total revenue from direct and indirect means from tourism has increased from ₹22926.55 crore in 2013 to ₹24885.44 crore in 2014 recording 8.54 percent annual increase. Appendix 6.12 shows the foreign exchange earnings and domestic tourist earnings including revenues from indirect sources from 2008.
Landmarks in Kerala Tourism
Responsible Tourism
6.51 Tourism has strong impact on socio-economic scenario of the host community. The development and management of a destination has to be in line with the aspirations of local communities, which would not only provide for a more authentic tourist experience, but also attract a strong community support for tourism. The Department of Tourism has put efforts for inculcating local community views on tourism planning and destination management by introducing Responsible Tourism in four destinations, Kumarakom, Kovalam, Thekkady and Wayanad. The Responsible Tourism initiative aims at minimizing negative economic, environmental, and social impacts of tourism at destinations and enhancing economic and social well-being of host communities and conservation of natural and cultural heritage of the destinations. The Department has set in multi stakeholder mechanisms in these destinations involving local governments, local people and the tourism industry and trade. This has provided a platform for direct interaction between the stakeholders. It has enabled a clear understanding of visitor requirements by service providers, while keeping requisite safeguards in optimizing outcomes for mutual benefit. It also provides scope for economic activity for local people by supplying local produce, performing local art forms and rendering services. There exists cohesion and mutual respect between the industry and people in these destinations. It also provides more enjoyable experiences for tourists through meaningful connections with local people, and fosters respect for local culture. The second international thematic conference on responsible tourism held in 2007 at Kumarakom received international appreciation for the Tourism initiatives of the State. Recently Kumarakom Responsible Tourism bagged the prestigious United Nations World Tourism Organization’s (UNWTO) Ulysses Award for Excellence and Innovation in 2015.
Master Plans for Destinations and Circuits
6.52 Sustainability is the key focus and hence the Department of Tourism has based its future tourism developments on Master Plans with long perspective. Master Plans for five Destinations, viz Kovalam - Poovar Tourism Corridor, Kumarakom, Thekkady, Fort Kochi and Munnar with thirty year perspective has been prepared and five other Master Plans are being prepared. These Master plans open up possibilities for Tourism Corridors and Circuits and avenues for additional employment and income generation. Master Plans focus mainly on improving and creating basic infrastructure, preservation of flora fauna, protection of water ways, landscapes, creating connectivity within the destinations, Preservation of Heritages and wild life and creating support infrastructures like water supply, waste management, signages etc.
Visa on Arrival and e-Visa
6.53 Visa on Arrival (VoA) is a single entry permission to enter India for the purpose of tourism. It is a non-extendable Visa for thirty days permitting two visits in a calendar year. The Government of India has also introduced Electronic Travel Authorisation facility (e-visa) to 113 nationals. E visa is issued for tourism, visiting friends and family, short duration medical treatment and business visits. 7972 and 3719 tourists availed e visa in Kochi and Thiruvananthapuram Airports respectively as on August 2015, since its introduction in 2014.
Box 6.2
Awards and Recognition for Kerala Tourism in 2014
• Das Golden Stadttor Award 2015 for the Great Backwaters Television Campaign
- • Pacific Asia Travel Association (PATA) 2014 for E-Newsletter and Corporate Social Responsibility in Kumarakom Responsible Tourism
- • Travel & Leisure Award 2014 for Best Indian State and Best Green Destination
- • Lonely Planet - India Travel Awards 2014 for Best Destination for Families
- • Web Ratna Awards 2014 in ‘Outstanding Content’ Category for Kerala Tourism Website
- • United Nations World Tourism Organization’s (UNWTO) Ulysses Award for Excellence and Innovation in Kumarakom Responsible Tourism
- • Golden City Gate Award-2014 for Print campaign “The Great Backwaters”
- • CNBC Awaaz Travel Awards for Best City – Kochi
- • Condé Nast Traveler Readers Award 2014 for Favourite Indian Leisure Destination: Kerala (Runner - Up)
- • Kerala State Planning Board Award for best performance in implementation of Annual Plan 2013-14
Source: Department of Tourism, Government of Kerala
Spice Route and Muziris Heritage Tourism Project
6.54 Muziris was an ancient port in Kerala located at Pattanam near North Paravur in Ernakulam district which served as a key link in the spice trade with rest of the World till it was destroyed in the 14th century by a natural disaster. The Department of Tourism developed the Muziris Heritage Project to utilize the immense potential of the State in the Heritage tourism sector. It connects a number of museums and historical monuments around water ways. The UNESCO showed great deal of interest in the project and joined with the Department of Tourism for developing it into a “Spice Route Heritage Project”. The project aims at opening new vista in the field of tourism and historical research in Kerala. The Spice Route Heritage Project will connect almost all nodes of historical trade in Kerala, especially Malabar, a major centre of trade in the early centuries. Kerala Tourism and UNESCO will jointly mobilise bilateral and multilateral collaboration with countries that were part of the ancient spice trade. The Government has recently formed a company, namely Kerala Heritage Company Ltd to take forward the Muziris tourism project.
Eco-Tourism
6.55 Eco-tourism is a purposeful travel to natural areas to understand and experience environment without altering the integrity of the ecosystem. It also aims at producing economic opportunities to local people and thus enhances conservation of natural resources. Kerala is famous for its eco-tourism initiatives. The objective of government in eco-tourism is to convert the entire tourism industry in Kerala into eco-friendly mode and to ensure local community involvement in tourism initiatives leading to employment and income generation. Directorate of Eco-Tourism has been pioneering the eco-tourism activities in the State.
Adventure Tourism
6.56 Kerala Tourism has setup Kerala Adventure Tourism Promotion Society which has been introducing adventure tourism, a new branch of tourism in Kerala. The Government has also constituted a society, namely Green Tourism Circuit (Kottayam) to connect, develop and foster tourism in Elaveezhapoonchira, Ayyampara and Vagamon in Kottayam district.
Box 6.3
Key Initiative of the Tourism Department in 2014-15
Marketing
- • Opening up new market in China by participation of Kerala Tourism in BITE International Fair 2015 at Bejing and B2B workshops at Shanghai, China
- • Attracting foreign tourists visiting Sri Lanka by organising International Road show at Colombo
- • Consolidating the efforts in existing markets by participating in International Fairs, Partnership Meets, B2B in Middle East and Europe
- • Innovative approaches in domestic market by organising Kerala Tourism Food Festival in nine major Indian cities in November – December 2015
Infrastructure
- • Take a Break – establishing wayside amenity centres with restrooms and food courts across the State – 1st and 2nd Phase of the project commenced
- • Showcasing craft villages, farm tourism and village tourism
- • Developing new destinations, pilgrim centres in circuits, establishing facilities for culture and entertainment, and beautification of many destinations
- • Eco-tourism Circuit connecting Gavi, Pathanamthitta, Thekkadi and Vagamon approved by Government of India for funding to the tune of ₹99.97 crore
- • Pilgrim Circuit connecting Padmanabhaswami Temple, Aranmula and Sabarimala approved by Government of India for funding to the tune of ₹92.40 crore.
Source: Department of Tourism, Government of Kerala
6.57 The Tourism Department has taken up development of Backwater Circuit in Alappuzha back water region as a Mega Circuit with central government assistance. This has given a face-lift to the Alappuzha back water region by developing house - boat terminals, night halt terminals, minor destinations and beaches. Another innovative tourism project with the assistance of Central Government is the development of Palaikkari Fish Farm and surroundings areas into a major tourism destination. The Department, based on the 30 year perspective, has now been beautifying the destinations to attain international standards, providing amenities and supporting infrastructure.
Outlook
World merchandise trade that was growing rapidly till 2011 has hardly shown much growth during the last three years and signs of revival are not to be seen. Merchandise trade of India growing rapidly till 2011 has shown sharp decline and has been in the negative territory during the last one year. Remittances growing robustly with every depreciation of the rupee have started showing signs of lower increases following the precipitous fall in the crude oil prices. Tourism too has not been doing well impacted by the poor growth of the World economy and a number of internal developnments. Kerala being more integrated with World economy is already feeling the impact of these external developments. In the near term the effects of developments in trade, remittances and tourism will be felt more intensely.