Chapter 2
AGRICULTURE AND ALLIED SECTORS

Introduction
Agriculture remains one of the most important sectors of Kerala Economy. The forces driving the global growth in agriculture and associated risks pose significant challenges to Kerala agriculture. Commodity markets witnessed turbulent times in 2014 & 2015. Most commodity prices in the international market fell significantly and continued the downtrend from their peaks of 2011-12. In the agricultural raw material markets plentiful supply was a major issue. Natural rubber prices experienced a substantial decrease of 30 percent in 2014 resulting from over supply and high stocks (UNCTAD, 2015). It is a great challenge and formidable task to arrest the decline and reverse the slowing growth of agriculture sector.
Performance of Agriculture
At the national level, as against a growth target of 4 per cent for agriculture and allied sectors in the Twelfth Plan, the growth registered for 2012-13 at 2011-12 prices was 1.2 per cent, 3.7 per cent in 2013-14 and 1.1 per cent in 2014-15. The figures were 1.4 per cent for 2012-13 and 4.7 per cent for 2013-14 in 2004-05 series. Thus there is a downward revision in the growth rates of agriculture and allied sectors at the national level as a result of the adoption of the new series by the Central Statistics Office. But even without the downward revision agricultural growth was considerably lower than the target.
2.2 With regard to Kerala, growth performance of the agriculture and allied sectors has been fluctuating across the Plan period. It witnessed a positive growth of 1.8 percent in Xth Plan period but a negative growth rate of -1.3 percent in XIth Five Year Plan. In the Twelfth Plan based on the new series brought out by the Directorate of Economics and Statistics (DES) with 2011-12 as base year, the agriculture and allied sectors recorded a positive growth rate of 1.43 per cent in the first year (2012-13), and a negative growth rate of -2.13 per cent in second year(2013-14). In 2014-15, the sector has recorded a negative growth rate of -4.67 per cent. Consequently, the share of agriculture and allied sectors in total GSDP of the State has also declined from 14.38 per cent in 2011-12 to 11.6 per cent in 2014-15. But, the switch from 2004-05 to new series with 2011-12 as base has resulted in higher share of agriculture and allied sectors in the total GSDP of the State from 8.83 per cent to 12.9 per cent for 2013-14. (Table 2.1)
Table 2.1
Share of Agriculture and allied sectors in GDP
At the National and State level (Base 2011-12)
Sl No |
Year |
Share of agriculture and allied sectors in GDP (India) |
Share of Agriculture and allied sectors in GSDP (Kerala) # |
1 |
2011-12 |
18.4 |
14.38 (9.1) |
2 |
2012-13 |
18.0 |
13.76 (9.5) |
3 |
2013-14* |
18.0 |
12.9 (8.83) |
4 |
2014-15** |
NA |
11.6 |
*Provisional ** Quick # figure with 2004-05 base in brackets
Source: Directorate of Economics and Statistics
2.3 In order to revive the agriculture in the country as a whole, NITI Ayog had asked all the states to constitute Task Force for Agriculture Development. Consequently the Government of Kerala had constituted a Task Force with Vice Chairman, State Planning Board as Chairman and Government Secretaries as Members. The Task Force had accordingly suggested approach and strategies for revitalization of agriculture and allied sectors as well as requested for various support measures from the Government of India. The best practices in agriculture followed in the State were also mentioned in the report. The salient recommendations among them are presented in Box 2.1
Box 2.1
Task Force on Kerala Agriculture Development
Recommendations :
A. Support requested from GOI for the revitalization of agriculture in Kerala
Support for Risk Management in Agriculture such as addressing price stability of perennial crops and vegetables, a high density weather station network for effective crop insurance, Credit risk guarantee fund by GoI to encourage banks to extend loan to farmers for short term and investment credit, designing an income guarantee program for the farmers, a new interest subvention scheme for investment credit, announcement of minimum support price for horticulture crops like vegetables, implement pilot projects for the revitalization of agriculture based on the agro ecological delineation of the State, support to set up network of farmers market in the State, support for food processing and value addition.
B. Best practices in Kerala
1. The adoption of online farmer registration data base and e-payment using Direct Benefit Transfer during 2012-13 onwards facilitated faster service delivery in Agriculture by the Department of Agriculture. A data base of 18.77 lakh farmers has been created through the online software developed and maintained by NIC. Assistance worth ₹. 912.33 crore has been transferred to farmers during 2012-13 to 2014-15, through DBT.
2. Supplyco, the implementing agency for paddy procurement, has developed a web based platform to document the entire activities in the supply chain of paddy procurement scheme, through online farmer registration and paddy receipt sheet computerization for the electronic management of payment process.
3. The extension support to farmers under support to state extension program for extension reforms is provided through Agriculture Technology Management Agency (ATMA) plus model of extension under the overall framework of ATMA.
4. Plant health clinics were established in the State for providing adequate diagnostic and advisory facilities to farmers online to promote diagnostic services along with ecofriendly and scientific pest management strategies.
5. Farmer markets of vegetable and fruit promotion council saves the farmers from the exploitation of middlemen in agriculture marketing. There are 270 farmer markets in the State and it undertook trading of fruit &vegetables worth ₹259 crore.
6. Kerala State Planning Board has initiated a project on soil based plant nutrient management plan for agro ecosystem of Kerala. The scheme was implemented by Department of Agriculture under the leadership of National Bureau of Soil Survey & Land Use Planning (NBSS & LUP) with the support of other 12 institutions and 27 laboratories. Over 1.75 lakh soil samples had been collected and analyzed for micro, macro and secondary nutrients. Soil test based health cards were generated using the software developed by Indian Institute of Information Technology and Management, Kerala (IIITM-K) and issued to the farmers. Nutrient Management Plan for 900 Panchayats were prepared based on the soil analysis data from each Grama Panchayat and distributed to Krishi Bhavans.
C. Strategies recommended for the revitalization of agriculture and allied sectors
The strategic framework recommended for revival of Kerala agriculture is promotion of green economy based on agro ecology principles, through improving agriculture productivity, investment in infrastructure and strengthening livelihood and assured income through service delivery.
D. Adoption of Agro ecological approach
The core approach in agriculture planning is driven by recognition that growth to a new plateau of performance cannot be achieved by continuing existing approaches and practices in the state. It is essential to prepare strategies and action plan for each Agro Ecological Zone and Agro Ecological Units for the development of Agriculture and allied sectors. The State has been divided into 5 Agro Ecological Zones and 23 Agro Ecological Units based on climate and soil in a recent study coordinated by the State Planning Board. All issues in Agriculture needs to be addressed on Agro Ecological Zone /Agro Ecological Unit wise for the growth and development of the sector
Source: Task Force on Kerala Agriculture Development, State Planning Board, 2015
2.4 The implementation of the recommendations of the Task Force report along with substantial financial and policy support from Government of India is expected to revitalize Kerala agriculture to a higher growth trajectory.
Monsoon 2015
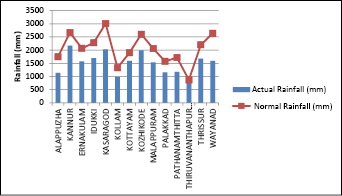
2.5 The actual rainfall received in Kerala during southwest monsoon season (1st June to 30th September 2015) was 1514.3 mm as against the normal rainfall of 2039.7 mm in 2015 showing -26 per cent departure from normal.
2.6 This year normal rainfall was received in Kannur, Kottayam and Thiruvananthapuram districts and rainfall received was deficient in all other districts in Kerala from southwest monsoon season. (Percentage departure from normal value: Excess: +20% and above, Normal: -19% to +19%, Deficient: -20% to -59%, Scanty: -60% to -99%).
Fig 2.1
South West Monsoon Rainfall received from 1st June – 30th Sept 2015
Source: IMD, Thiruvananthapuram
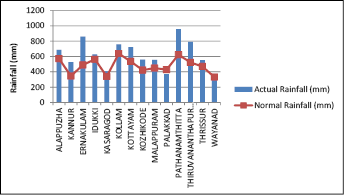
2.7 During north east monsoon season the actual rainfall received in Kerala was 610.1 mm as against the normal rainfall of 480.7 mm showing excess rainfall from normal (+27%). Among the districts, Idukki, Kollam, Palakkad and Wayanad districts received normal rainfall and all other districts received excess rainfall during the season. District wise rainfall distribution in the State during North East Monsoon season 2015 is given as Appendix 2.1.
Fig 2.2
North East Monsoon Rainfall received from 1st October to 31st December 2015
Source: IMD, Thiruvananthapuram
Land Use Pattern
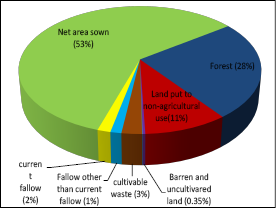
2.8 Kerala is one of those States in India where land resources are put to more intensive use than anywhere else, mainly because of the low per capita availability of land in the State. Data on land use pattern and number of operational holdings for the year 2014-15 is given in Appendix 2.2 & 2.3. Out of a total geographical area of 38.86 lakh ha, little over one fourth was under forests, and one tenth of it was put to non agricultural use. Also, the net sown area which accounts for 53 percent of the total area, did not record any significant changes. Area sown more than once, which accounted for 15 percent of the total geographical area recorded a notable increase of 3 percent from 5.65 lakh ha in 2013-14 to 5.81 lakh ha in 2014-15. As a result, the gross cropped area registered a minor increase of 0.3 percent. Another notable feature is the decline in the area of barren and uncultivated land (-5 per cent), permanent pastures and grazing land (-38 per cent) and the area under current fallow (- 8 per cent). The land use pattern is shown in Figure 2.3.
Fig 2.3
Land Use Pattern of Kerala 2014-15
Source: Directorate of Economics and Statistics, Kerala
Trend in Area, Production and Productivity of Crops
2.9 Data regarding the area, production and productivity of important crops grown in Kerala are shown in Table 2.2. In the gross cropped area of 26.24 lakh hectares in 2014-15, food crops comprising rice, pulses, tapioca occupy 10.5 per cent. In 2014-15, food crops in general showed an increasing trend in production as the production of pulses and tapioca recorded an increase of 13 and 18 per cent respectively and that of rice recorded a marginal decline. This could be more on account of increase in acreage as the area under both pulses and tapioca has recorded an increase of 20 per cent and 11.6 per cent respectively. In the case of spices, pepper showed a tremendous increase in production (contrary to the previous year) mainly due to a productivity increase achieved, while production of ginger and turmeric showed an increasing trend in production (albeit marginally). In the case of plantation crops, coffee, tea and cardamom have shown increase in production while rubber has shown a drastic decline in production. Fruits, banana and other plantains recorded an increase in production whereas the cashew output largely declined.
Table 2.2
Area, Production and Productivity of Principal Crops
Sl. No. |
Crops |
Area (Ha.) |
Production (MT) |
Productivity (Kg./Ha.) |
|||
2013-14 |
2014-15 |
2013-14 |
2014-15 |
2013-14 |
2014-15 |
||
1 |
Rice | 199611 |
198159 |
564325 |
562092 |
2827 |
2837 |
2 |
Pulses including Tur | 2989 |
3601 |
3019 |
3409 |
1010 |
947 |
3 |
Pepper | 84065 |
85431 |
29408 |
40690 |
350 |
476 |
4 |
Ginger | 4538 |
4800 |
21521 |
22989 |
4742 |
4789 |
5 |
Turmeric | 2430 |
2470 |
6253 |
6820 |
2573 |
2761 |
6 |
*Cardamom | 39730 |
39730 |
14000 |
16000 |
352 |
403 |
7 |
Arecanut | 100008 |
96686 |
100018 |
125925 |
1000 |
1302 |
8 |
Banana | 62261 |
61936 |
531299 |
545431 |
8533 |
8806 |
9 |
Other Plantains | 54512 |
56761 |
362395 |
468320 |
6648 |
8251 |
10 |
Cashewnut | 49105 |
45436 |
33375 |
29715 |
680 |
654 |
11 |
Tapioca | 67589 |
75496 |
2479070 |
2943919 |
36679 |
38994 |
12 |
Coconut | 808647 |
793856 |
5921 |
5947 |
7322 |
7491 |
13 |
**Coffee | 85359 |
85359 |
66645 |
67700 |
781 |
793 |
14 |
$ Tea | 30205 |
30205 |
62938 |
65174 |
2084 |
2158 |
15 |
# Rubber | 548225 |
549955 |
648220 |
507700 |
1182 |
923 |
Production of Coconut in Million Nuts, Productivity in numbers.
# Rubber Board, *Spices Board .** Coffee Board . $Tea Board
Source; Directorate of Economics and Statistics
Crop Wise Analysis
Rice
2.10 Rice is the staple food of Kerala and forms an inevitable part of an average Keralites’ diet. Unfortunately, the area under rice has been declining consistently since the last three decades. Today rice occupies only third position in area under cultivation way behind rubber and coconut. And though last year the trend was reversed with a marginal increase in area and production, in 2014-15, it again showed a declining trend. Moreover, the productivity of the crop is very low in the State (2837kg/ha), though it is higher than the national average (2424 kg/ha). There has only been a marginal increase in the productivity of rice in the past four decades. China which is the major producer of rice in the world, reports productivity more than three times the productivity of (6744kg/ha) rice in Kerala. The productivity of rice in Egypt is the highest in the world (9088kg/ha) which is nearly four fold of our productivity. Punjab is the State with maximum yield in the country (3952kg/ha). Details regarding area, production and productivity of rice in Kerala is given in Appendix 2.4.
2.11 Meanwhile at the national level, there has been 2.7 per cent increase in area and 1.3 per cent increase in production of rice in 2013-14 over the previous year.
2.12 Season wise production trends reveal that contrary to the previous year, the mundakan crop has shown decline in production while the virippu and puncha crop showed increasing trend. Still the overall production failed to respond positively (Appendix 2.5).
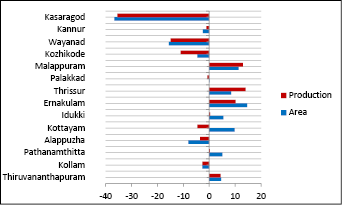
2.13 Area under rice has fallen in all the districts of the State in the period 1996-97 to 2012-13. However, the decline has been sharpest for Ernakulam (93%) followed by Kollam (92%), Thiruvananthapuram,(86%) and Malappuram (78%). On the positive side, in Kottayam and Alappuzha, the major rice growing districts the decline has been much less (13 and 12 per cent respectively). In 2014-15, Kollam, Alappuzha and the northern districts of Kozhikode, Wayanad, Kannur and Kasaragod have shown decline in area as well as production in the State. In Kottayam, despite an increase in area of 9.8 per cent the production has not responded positively. (Details as given in Appendix 2.6 & 2.7) and Figure 2.4.
Fig 2.4
Percentage change in area and production of rice in major districts of Kerala during
2014-15 over 2013-14
Source: Directorate of Economics and Statistics, Kerala
2.14 The decline in area indicates that area under paddy has been increasingly converted into other crops as well as for non agricultural purposes. This is mainly due to low profitability as a result of increasing costs (caused by rising cost of human labour as well as seasonal shortage of labour) as well as relative price change in favour of competing crops. Inspite of focused intervention through state plan and Rashtriya Krishi Vikas Yojana (RKVY) along with enhancing per hectare assistance from ₹1500 to ₹4500 in 12th plan and introduction of procurement in all districts, rice production has not responded positively.
Coconut
2.15 Although one of its principal crops, Kerala’s share in area as well as production of coconut in the country is declining over time. While it accounted for 69.58 per cent of the area and 69.52 per cent of the production in the country in 1960-61, the corresponding shares declined to 40.2 per cent and 42.12 per cent respectively in 2011-12. However the area and production of coconut in the State has been increasing. From 29.88 per cent of the Net Sown Area in 1980-81 the share of coconut has increased to 41.96 per cent in 2000-01. Although it declined to 37.19 per cent in the start of the next decade, it was made good by 2011-12 to 40.24 per cent .This could be because part of the paddy fields were reclaimed and planted with coconut during the period. The production also increased concomitant to increase in the area during this period. From 3220 million nuts in 1960-61, the production increased to 5536 million nuts in 2000-01. After that the production plateaued and was more or less stagnant in the next decade. Thus the increase in output is more on account of increase in acreage as the productivity of the crop is very low in the State. In 2014-15, there was a marginal increase in the production from 5921 million nuts in 2013-14 to 5947 million nuts. Area, production and productivity of coconut in Kerala are given in Appendix 2.8.
2.16 The main cause for falling productivity is the prevalence of root wilt disease, poor management and existence of senile and unproductive palms. Hence massive replanting of root wilt palms by elite palms and elimination of senile palms, setting up of nurseries for production of quality seedlings and their subsequent distribution is required for increasing productivity. Restructuring of the cluster development programme is also essential for more effectiveness. The attempt made by the Department of Agriculture and Cooperation to restructure two coconut development programmes through convergence approach at the panchayath level during 2014-15 coupled with price advantage is expected to revive coconut production in the State. The isolated attempts of production of dwarf coconut seedlings and hybrids need to be scaled up substantially with the support of Research and Development institutions. Entrepreneurial ventures for the production of value added products like desiccated coconut, beverages, shell based products, coconut cream, neera etc has to be promoted with appropriate tie up with credit and marketing agencies. The coconut procurement system through Krishi Bhavans in association with Kerafed was introduced in 2012-13. The initiative taken by Govt. in promoting neera in 2013-14 is expected to revive coconut economy of the State.
Vegetables
2.17 The per capita consumption of vegetables in Kerala is 160g per day, the annual consumption being 20.78 lakh tonnes. However, the State has been producing much less than the requirement resulting in heavy dependence on neighbouring states. In 2011-12, production of vegetables in Kerala was just 8.25 lakh MT. Considering the heavy dependence as also the heavy content of pesticide residue in the vegetables imported from neighbouring states, the Government of Kerala initiated a Vegetable Development Project (VDP) to augment vegetable production in the State. As a result the vegetable production in the State has increased to 13.55 lakh MT in 2014-15.The area under vegetable cultivation has also increased from 42477 ha in 2011-12 to 90533 ha in 2014-15, the share contributed by VDP being 36 per cent. The Department of Agriculture could increase substantially the production of vegetables in the State over a period of three years.
2.18 Considering the heavy content of pesticide residue in the agriculture produce Government of India brings out a survey report on the status of pesticide residues in food commodities every year. The details of the survey report of 2014-15 is given in Box 2.2
Box 2.2
Survey report on Status of Pesticide Residues in India 2014-15 –Major Findings
The Department of Agriculture, Cooperation & Farmers Welfare, Ministry of Agriculture & Farmers Welfare had started a central sector scheme, “Monitoring of Pesticide Residues at National Level” in food produce and environmental samples during 2005-06 with the participation of various laboratories representing Ministry of Agriculture, Indian Council of Agriculture Research, Ministry of Health and Family Welfare, Ministry of Environment and Forest, Council of Scientific and Industrial Research, Ministry of Chemical and Fertilizer, Ministry of Commerce and State Agricultural Universities across the country. The main objective of the scheme include: To identify crops and regions having preponderance of pesticide residues in order to focus extension efforts for Integrated Pest Management (IPM) and Good Agriculture Practices (GAP).
During the year 2014-15, under this scheme samples of vegetables, fruits, spices, red chilli powder, curry leaves, rice, wheat, pulses, fish/marine, meat and egg, tea, milk and surface water were collected from the various markets such as retail outlets and agricultural produce marketing committee (APMC) markets, farm gate and organic outlets located at different parts of the country and analysed by 25 participating laboratories for the possible presence of groups of pesticide residues such as organo-chlorine, organo-phosphorous, synthetic pyrethroids, carbamates and herbicides. • Out of 20,618 samples analysed; no residues were detected in 16,761 samples (81.3%); residues were detected in 3,857 (18.7%) and residues above Maximum Residue Level (MRL) in 543 samples (2.6%) as prescribed by Food Safety and Standards Authority of India (FSSAI). Residues of non-approved pesticides were detected in 12.5% of the samples. • With regard to Vegetables, 10,593 vegetable samples were collected from various markets in the country (retail outlets and APMC markets), farm gate and organic outlets and analysed for the possible presence of pesticides by 22 participating laboratories. The vegetables samples which were collected and analysed were mainly, brinjal, okra, tomato, cabbage, cauliflower, green chilli, capsicum, cucumber, green pea, bitter gourd and coriander leaves Out of this 2253 vegetable samples (21.3%) contained of measurable pesticide residues. In 2.9% of the vegetable samples (306 samples), residue concentrations exceeded the FSSAI MRL. • The total number of 2239 fruit samples namely, apple, banana, pear, grapes, orange, pomegranate, guava and mango were collected from the different markets and analyzed for the possible presence of pesticide residues. Overall, 81.1% of the samples tested were free of detectable residues. While 18.8% of the samples analysed contained measurable residues from which 1.8% of samples (40 samples) contained residues above FSSAI MRL. • A total of 1881cereal samples (1076 rice samples and 805 wheat samples) were collected and analysed by 15 laboratories for the possible presence of pesticide residues. In total, 152 rice samples(14.1%) out of 1076 samples were found with measurable residues and the MRL exceeded in 6.3% rice samples . • Out of the 8,342 vegetable samples collected from the various retail and agricultural produce marketing committee (APMC) markets, in 22.5 per cent of the samples one or several pesticides in measurable concentrations were detected, in 229 samples (2.7%) contained residues exceeding MRL. Most frequently detected pesticides which exceeded FSSAI MRL were chlorpyrifos, ethion, acetamiprid, dichlorvos and cypermethrin. Among all the vegetables samples analysed, capsicum, green chilli and cauliflower samples were found having high number of above MRL residues followed by samples of cabbage, brinjal, tomato, okra, bitter gourd, cucumber, green pea and coriander leaves. Out of the Vegetable samples collected from farm-gate (1846) and organic outlets (405); 69 farm-gate samples (3.7%) and 8 organic samples (2.0%) were found exceeding MRL.
KERALA
• Overall, 1197 samples were collected and analysed by Vellayani centre (Kerala Agricultural University); 26.0% of the sample had measurable concentrations of one or more pesticides; while 7.9% of the samples were identified with exceeding MRL.
• For rice, out of the 72 samples analysed, 19 samples were detected with pesticide residue and in 12 samples, it was exceeding FSSAI MRL levels. In vegetables (market, farm gate and organic together) 25 per cent of the samples contained pesticide residue and 2.72 per cent samples exceeded FSSAI MRL levels. Also its heartening to note that among pulses red chilli powder, milk, meat and egg, and fish products, no sample had residue exceeding FSSAI MRL levels
Source: Ministry of Agriculture&Farmers’ Welfare, Government of India, 2015
Pepper
2.19 Pepper production in the country recorded an increase of 25 thousand tonnes from 45 thousand tonnes in 2013-14 to 70 thousand tonnes in 2014-15. Concomitantly, pepper production in Kerala also recorded an increase, from 29408 MT to 40690 MT in 2014-15.
2.20 There has been a rally in pepper prices since 2010 which further increased to ₹663.27 per kg in 2014, an increase of ₹251.35 per kg compared to previous year.
2.21 In order to revive spices development in the State, the Department of Agriculture had initiated comprehensive pepper development Programme in all districts of the State in 2014-15 . An integrated action plan was prepared for the revival of the crop in the State, covering reorientation of planting material production, expansion of grafting wherever possible, area wide disease management, liming and nutrients management and revival of pepper samithies. The increase in production achieved could be because of this concerted effort by the Government of Kerala.
Cashew
2.22 India continued to be the largest producer of raw cashew nuts in the world. The other main producing countries are Vietnam, Brazil, Tanzania and Ivory Coast. The production of raw cashew nuts increased from 728 thousand MT in 2012-13 to 736 thousand MT in 2013-14. The area under cashew cultivation also recorded an increase from 982 thousand hectares to 1006 thousand hectares in the respective years.
2.23 However in the last one decade, there has been a continuous and considerable decline in both area under cultivation as well as production of cashew in Kerala. Its alarming to note that the production which stood at 60 thousand MT in 2004-05 declined to 33.3 thousand MT in 2013-14 and to 29.71 thousand MT in 2014-15. While area dwindled from 81 thousand hectares to 49 thousand hectares and to 45 thousand hectares during the same period. Productivity of the crop which was around 900 kg per hectare during the late eighties also dwindled to 654 kg per hectare in 2014-15. Details are given in Appendix 2.9.
2.24 Area and production are increasing steadily in other producing states in the country. Eventhough the major share of area under cashew is in Andhra Pradesh (18.3%), Maharashtra is the leading producer with 32.9 percent share in production during 2013-14 whose share was only 10 per cent in 1990-91.
Plantation crops
2.25 Plantation crops in general are either export oriented or import substituting and therefore assume special significance from the national point of view. It is estimated that nearly 14 lakh families are dependent on the plantation sector for livelihood. Each of the four plantation crops of South India has its distinct characteristics and economic problems. Consequent to the removal of quantitative restrictions on import, plantation crops in general are facing the threat of low quality imports.
2.26 Kerala has a substantial share in the four plantation crops of rubber, tea, coffee and cardamom. These four crops together occupy 7.04 lakh ha, accounting for 26.88 percent of the gross cropped area in the State. Kerala’s share in the national production of rubber is 72.02 per cent, coffee is 22 per cent and 6.3 percent in tea during the year 2013-14. Details are given in Appendix 2.10.
Rubber
2.27 India produced only 6.45 lakh tonnes of natural rubber (NR) during the year 2014-15, significantly lower by 1.2 lakh tonnes from the previous year. Another major development during the year was the downward revision of production figure by the Rubber Board for the year 2013-14 to 7.74 lakh tonnes in the place of 8.44 lakh tonnes. Thus there was large fall in India’s output, continuing the trend that started in 2013. Fall in NR prices coupled with high wages and dearth of skilled labourers, largely compelled farmers to minimize harvesting days, reduce application of essential inputs and stay away from proper maintenance of trees. Productivity has been affected by the abnormally severe summer that was felt in the State during the dry season. Though mature rubber area expanded during the year by 16000 ha to 534000 ha, a portion of this was left untapped due to unattractive prices, shortage of tappers and high operation cost. In contrast to the fall in production, consumption grew by 3.8 per cent to 10.2 lakh tonnes in 2014-15. This is supposedly due to increased demand for rubber by user industries as their end products showed signs of improvement. For instance, it is reported that the overall sale in vehicles during 2014-15 grew at 7 per cent compared to 3.5 per cent in the previous year. As a result India imported 442.1 thousand tonnes of natural rubber during 2014-15, significantly higher than 360.3 thousand tonnes imported in the previous year, largely attributed to favourable relative import prices as the domestic market prices stayed above the international market prices. Two explicit outcomes of the growth in NR imports are the increase in the import intensity of domestic NR consumption to more than 43 per cent and the gradual replacement of conventional sheet grades of NR from domestic market by block rubber with important implications for farm gate prices. However, a major casualty of the convergence of the markets has been fluctuating farm income leading to staggered replanting and resultant growth in the share of area under senile trees to the extent of around 50 per cent of the total tapped area. The production scene was no different in Kerala also, as the total production dwindled from 6,48,220 MT in 2013-14 to 5,07,700 MT in 2015 despite a marginal increase in area of 0.3 per cent in 2014-15. Details are given in Appendix 2.11 to 2.13.
2.28 With regard to rubber prices, it has been volatile in both the national and international markets. NR prices after scaling to an all time high during 2011 had fallen significantly, that too at a furious pace which had started threatening the very existence of the growing fraternity. In relative terms the average international price realized during 2014 was lower by 26.5 per cent compared to the previous year. The domestic NR prices also had moved along a falling trajectory during the year under review, but the intensity of decline was slightly less compared to the international prices. The average price realization of RSS 4 during 2014-15 was ₹132.6 per kg while it fetched ₹166 per kg in 2013-14. Whereas for RSS-3 it was ₹155.45 and ₹112.71 for 2013-14 and 2014-15 respectively.
2.29 The declining rubber production in the year has affected India’s ranking internationally as it has been pushed to the fifth position with countries like Vietnam and China occupying the third and fourth position respectively. Thailand continues to be the top producer followed by Indonesia in the second spot in the global rubber scene.
Coffee
2.30 Domestic coffee production for the year 2014-15 was estimated at 327 thousand tonnes which represents an increase of 22.5 thousand tonnes compared to the previous year. However as per FAO estimates, yield in India is 845.6 kg per hectare much below Vietnam (2499.1 kg per hectare) and Brazil (1421.5kg per hectare). Interestingly, a comparison of the productivity levels in 1971 vis-a-vis 2011 suggests that India (-1.8%) and Indonesia (-0.1%) are the only two countries who have reported a decline in yield levels in last 40 years. Lower productivity in India is due to limited mechanization, pest infestation, existence of old/senile plants and labour shortage. Thus on the productivity side much more needs to be done and concerted efforts are required both at the policy and farm level. The only way to address this issue is by providing positive research and development which can directly contribute in achieving higher yield.
2.31 With regard to Kerala the production of coffee registered a slight increase from 66,645 MT in 2013-14 to 67,700 MT in 2014-15. The share of Kerala in total coffee production in the country is around 20 per cent during the year. Major variety grown in Kerala is Robusta with a share of 97.1 per cent in planted area. Productivity of the crop in terms of bearing area in Kerala is 808 kg/ha which is lower than the national level of 852 kg/ha during 2011-12. Among the States, Kerala stands next to Karnataka which produces 70.4 percent of total Indian coffee production.
Tea
2.32 As one of the largest tea producing countries, India accounts for 24.8 per cent of the total world production. The Tea Board had revised the production figures during 2011 by bringing within the net all segments of tea producers, both organized and unorganized, especially in North India many of whom were not reporting their crop statistics earlier, which helped India in breaching the coveted one –billion mark. The domestic tea production during 2014 was marginally higher by 6.9mkg and was placed at 1207m.kg in 2014. North India was mainly responsible for the higher crop, while South India could sustain its surge in production, albeit marginally.
2.33 Kerala accounts for 5.03 per cent of the area and 6.3 per cent of the total domestic production of tea in the country and it has been consistently falling since 2009-10. There was some respite from this in 2012-13 as tea production recorded an increase of 5059 MT as compared to the previous year despite a decline in area of 18 per cent, mainly on account of increase in productivity. In 2013-14, there has not been much change in the area, production and productivity of tea from the previous year. In 2014-15, tea production has increased by 3.5 per cent mainly on account of increase in productivity as area under tea has mostly been stagnant as compared to previous year. Appendix 2.14
2.34 The major issues plaguing the tea industry are stagnant productivity, acute labour shortage, high cost of machines, and lack of indigenous machinery.
Cardamom
2.35 India is the second largest producer of small cardamom and plays an important role in the international trade of cardamom. The output of cardamom is dependent on prevailing climatic conditions as the cardamom plant requires intermittent spells of rains and good sunshine during the growth stage. Cardamom production in the country during 2014-15 was estimated at 20 thousand tonnes compared to 14.8 thousand tonnes in 2013-14, an increase of 5.20 thousand tonnes. The turn around in cardamom prices since 2006-07 continued upto 2010-11 reaching the highest level, but thereafter the prices have fluctuated. During the current season 2014-15(August-June), the prices had increased by ₹118.53 per kg to reach ₹761.44 per kg. Meanwhile in Kerala, cardamom production has increased by 14.2 per cent in 2014-15 despite the area under cultivation remaining stagnant.
2.36 Details regarding monthly average farm price of important agricultural commodities and yearly average index number of prices received and prices paid by farmers is given in Appendix 2.15 & 2.16.
Collective farming through Kudumbashree
2.37 Collective farming is an important area of Kudumbashree which aims at food security both at household and community level. The major crops cultivated are paddy, vegetables, banana, pineapple and tubers. In 2013-14 area brought under cultivation of paddy was 15078.60 ha, vegetables contributed 12555.60 ha and 22476.20 ha of area was covered by other crops (banana, pineapple and tubers). Details of area covered are depicted in Appendix 2.17. More hand holding support including facilitation with banks and technology support are essential for improving livelihood of the women groups involved in farming.
Key initiatives of the Department of Agriculture in 2015-16
2.38 Schemes were formulated in 2015-16 based on the thrust areas and strategies for increasing the productivity in agriculture from the current levels. The key initiatives of the Department of Agriculture in 2015-16 for the improvement of agriculture sector are vegetable production programmes through a convergence approach on project mode aiming at self sufficiency, promotion of organic farming, production and distribution of quality planting materials, comprehensive fallow land cultivation with people’s participation, Agricultural Technology Management Agency(ATMA) plus model of extension, rejuvenation of spices economy, crop health management covering pests and disease surveillance, safe food production and integrated pest management, institutional mechanism for marketing and development of farmer markets, crop insurance including comprehensive insurance for paddy, GPS enabled soil sample collection and issue soil health cards, establishment of 2 new Mobile Soil Testing Labs (MSTL) at Kasaragod and Pathanamthitta, agricards on a pilot basis at Kalliyoor Grama Panchayat and 15 Agro service centres for service delivery and 59 new plant health clinics.
Performance of Annual Plan - 2014-15 of Department of Agriculture
2.39 During the Annual plan 2014-15, out of ₹938.32 crore earmarked for Agriculture Department, the expenditure incurred was ₹666.54 crore (71%) including Wayanad Package. The key achievements of the Department of Agriculture in 2014-15 are the following. Comprehensive vegetable production project was expanded and new technologies were adopted for increasing productivity viz. rain shelter, trial on hybrids and micro irrigation with fertigation. Through the programmes under Agriculture Department, vegetable production increased by 1.39 lakh MT during 2014-15 by the active involvement of all sections of the society including social media. Area under paddy increased by 5200 ha. and reached 2.048 lakh ha, 22253 dwarf coconut seedlings and 40884 hybrid seedlings were produced, 26 keragrams established for supporting planting material production to value addition, Neera project of Kerala Agriculture University was supported, Under Direct Benefit Transfer (DBT) system, subsidy of ₹329 crore was disbursed to 6.93 lakh farmers through e-payment during the period, 14 Agro service centres established for service delivery, operational support to 200 karshika karmasenas formed during 2013-14, installed biogas plants at 3116 schools. Fallow land rice cultivation in 1807 ha and fallow land vegetable cultivation in 509ha.were undertaken. Established 5 Block level nurseries and 5 Block level federated organisations for the marketing and input support of vegetables, 1.41 lakh soil health cards issued, monitoring of soil health cards initiated, 2832 pest surveillance units covering 276 panchayaths and established 59 block plant health clinics. Application of lime for correcting soil acidity was introduced in 41345 ha and 47793 ha was covered under secondary and micro nutrients. Initiated establishment of Agri Bioparks for value addition of coconut and paddy.
State Horticulture Mission (SHM)
2.40 The State Horticulture Mission was formed in 2005 to implement the programme of the National Horticulture Mission, a centrally sponsored scheme, with 85% central share and 15% State share which has been restructured as the Mission for Integrated Development of Horticulture from 2014-15 onwards. During 2015-16, GOI has changed the sharing pattern as 50% central share and 50% State share. The main objective of the mission is a holistic development of the horticulture sector covering fruits, plantation crops, spices, flowers, aromatic and medicinal plants and mushroom. The important programmes under the mission include production and productivity improvement, post harvest management and marketing.
2.41 An amount of ₹4000 lakh was released from Government of India during 2014-15 and the total expenditure was ₹3979.77 lakh. The components are establishment of nurseries for production and distribution of quality seeds and planting material, establishment of new gardens, establishment of integrated pack houses, sorting and grading units, cold storage units, establishment of rural markets, strengthening wholesale markets, market intelligence, extension quality awareness and market led extension activities for fresh and processed foods.
2.42 A project oriented monitoring system has to be evolved for realizing the envisaged outputs. A number of NGOs as well as private sector are also part of the project which needs further monitoring. More convergence of schemes with State plan and RKVY with deliverables are required for improved outputs.
Vegetable and Fruit Promotion Council’s Programme (VFPCK)
2.43 Vegetable and Fruit Promotion Council, Kerala (VFPCK) formed in 2001, has been implementing various schemes in fruits and vegetable sector with financial assistance from State and Central Governments. During 2014-15, the council had inducted 7513 farmers and formed 308 new SHG’s for the promotion of fruits and vegetables. Now the Council has 179173 registered farmers in 9214 Self Help Groups. The council had initiated 6 new farmer markets and 13 collection centres during the financial year. Now there are 270 Swasraya Karshaka Samithies and 155 collection centres under the purview of the council. During 2014-15, 1,003,43 MT of fruits and vegetables worth ₹243 crore were traded through Swasraya Karshaka Samithies of the council. To control high prices of vegetables, 111 vegetable retail markets were organized all over the State during July-Sept/2014 and 996 MT of vegetables worth ₹4 crores were sold through these outlets. Ready to cook vegetables were made available in packets to public through cut vegetable scheme implemented in Thiruvananthapuram, Ernakulam and Calicut districts. 82 lakh vegetable seedlings and 4.59 lakh tissue culture banana plants were produced and distributed throughout the State to promote homestead cultivation. An amount of ₹54.24 crore was disbursed as agriculture loan to 8084 farmers. A total of ₹19.79 lakh banana plants and 152800 cents of vegetables were covered under crop insurance. An amount of ₹53.22 lakh was distributed to farmers as claim amount. During 2014-15, farmers of the council had cultivated vegetables in 20,213 ha, banana in 22,688 ha and tuber crops in 3258 ha during the period. Total production during the period was 2.22 lakh MT vegetables, 2.94 lakh MT banana and 33662 MT of tubers. It is seen that in spite of the fall in area of the above crops compared to 2013-14, production increased due to increased productivity during 2014-15. During 2014-15, the area under vegetables decreased by 2298 ha and banana and tubers decreased by 3257 ha and 973 ha respectively compared to 2013-14. The production of vegetables increased by 78000 MT and that of banana and tubers increased by 24000 MT and 3136 MT respectively during the period. Agro meteorological data have been collected from 26 automatic weather stations installed in different parts of the State. As part of vegetable development programme for the promotion of homestead vegetable cultivation, 6887 grow bag units were distributed to households. VFPCK has initiated Participatory Guarantee System (PGS) to promote organic farming. The Council has received certification and has been appointed as the Regional Council for PGS organic certification for fruits and vegetables in Kerala. The council had implemented “Niravu” scheme in 30 constituencies during 2014-15 with a financial assistance of₹371 lakhs under RKVY.
Rashtriya Krishi Vikas Yojana (RKVY)
2.44 In order to incentivize States to draw up plans for their agriculture sector comprehensively, taking agro climatic conditions, natural resource issues and technology by integrating livestock, poultry and fisheries, a new Additional Central Assistance scheme was launched during 2007-08. During 2007-08 to 2014-15, a total number of 1146 projects with an outlay of ₹1636 crore were approved under the scheme. A total amount of ₹1338.89 crore was released by Government of India upto 2014-15 and an amount of ₹1332.61 crore (99.5%) was utilized. During 2014-15 against the budgeted outlay of ₹425 crore, ₹300.70 crore was released by Government of India of which ₹298 crore (99%) was utilised upto March 2015. During 2015-16, Government of India has changed the pattern of funding of the RKVY scheme.
2.45 A number of very small schemes are included for assistance under RKVY in the State like adoption of naturally ventilated green house technology, adoption of precision farming technology, establishment of mushroom cultivation units, popularization of temperate fruit crops in Idukki district, development of cool season vegetables in Kanthaloor and Vattavada, etc. More focused areas with larger projects have to be identified for support under RKVY. The preparation of district and State agriculture plans are a prerequisite for getting assistance for which concrete steps are required. More integrated approach is required for RKVY linkage with State plan. Details are given in Appendix 2.18.
Major programmes during 2014-15
1. Vegetable Development initiative of Department of Agriculture
2.46 Vegetable promotion programmes were implemented over a period of years with relatively small budget support. A significant increase could not be achieved till the end of 11th five year plan. A refocus and reorientation on the approach and strategy for the development of vegetables was introduced in 12th five year plan and it was decided to enhance budget provision by about 12 times in 2012-13, being the first year of five year plan, to that of the provision in 2011-12 to achieve the target of self-sufficiency in vegetable production over a period of time. Accordingly, a major project on vegetable development was prepared by the Department of Agriculture during 2012-13 with a mission mode approach and a multi pronged strategy covering an integrated approach with specified physical targets at Grama Panchayath level. The project aims at sustainability in vegetable area and production giving importance to safe to eat concept from the health aspect of producers and consumers, by advocating an integrated nutrient and pest management principle of cultivation. During 2014-15, an amount of ₹59.13 crore was utilized for vegetable development by the Department of Agriculture.
2.47 The salient features of the vegetable development project implemented by Department of Agriculture during 2012-13 to 2014-15 are given in Box 2.3.
Box 2.3
Vegetable Development Project of the Department of Agriculture (VDP)
• A total of ₹.198.27 crore was allocated for this project to the Department of Agriculture from 2012-13 to 2014-15 apart from ₹. 35.75 crore to other agencies with an expenditure of ₹. 258.84 crore including market intervention support.
• The total production of vegetables in the State has increased from ₹. 8.25 lakh MT in 2011-12 to 13.55 lakh MT in 2014-15, an increase of 64 %. Out of this the production share of VDP would be 4.49 lakh MT (33%) which was 17 % in 2012-13.
• The major components of the project are homestead vegetable cultivation, vegetable cultivation in institutions, urban clusters, cluster development and training, awareness and publicity.
• The physical achievements during the three year period are supply of 88.50 lakh seed kits, supply of 1.54 lakh growbag units, school gardens covered in 7400 schools, Project based vegetable cultivation in 652 institutions, 22 block level nurseries for the production of quality vegetable seedlings and 22 Block Level Federated Organisations to facilitate the activities of clusters, Development support to 187 A grade clusters and 595 potential clusters, fallow land cultivation in 1701 ha, adoption of new technologies for productivity improvement and conduct of 12737 training/awareness/publicity programmes.
• Increased awareness of healthy eating habits has led people to move to safe to eat and organic consumption mode.
• Propagation of improved cultivation practices and new technologies including better IPM practices.
• Marketing support to clusters/ blocks and improved marketing efforts.
• Promoted leased land/fallow land cultivation.
• Reduction in prices of vegetables and substitution of vegetable arrivals from other States.
• Improved social capital and networking capacity, bargaining power, self-confidence and team work among farmers due to team activities in the cluster along with trainings.
• Developed new age entrepreneurs in the sector through cultivation, supply of seed and seedlings, bio-inputs, pest and disease management services, supply chain logistics and marketing.
• Attitudinal changes in students through involvement in school vegetable garden and horticultural therapy for differently abled children.
• Mainstreaming of vegetable cultivation and marketing were incorporated in the agenda of political, social, and service organizations including service co-operative societies.
• The vegetable development project is a model initiative for emulation across the country.
Source: VDP: Quick assessment and way forward, State Planning Board, 2015
Support to State Extension Programme
2.48 The State has experienced considerable changes in Agricultural Extension consequent to institutional, technological and organizational developments. The Lead Farmer Centered Extension and Advisory Delivery Services (LEADS), a new field visit oriented extension system in the State with appropriate linkage with R&D institutions, KAU and KVKs were introduced in four districts of the State - Kollam, Kannur, Palakkad and Wayanad. 798 Lead farmers and Satellite farmers were formed for advisory services under the programme. During 2014-15, 2832 Pest Surveillance units initiated in 276 panchayats for pest surveillance and advisory services and 59 block level plant health clinics were established under the Crop Health Management scheme. 416 farm schools in Krishi Bhavans were established under ATMA programme.
2.49 ATMA plus model of extension system was introduced by integrating ATMA, LEADS and new initiatives identified through Strategic Research and Extension Plan (SREP). Promotion of integrated farming systems, farmer technology development, preparation of success stories, identification of research issues etc. were newly introduced. Model Panchayat extension plan prepared for 14 Grama Panchayats and Farmer extension organization was established in 14 blocks. Preparation of Monthly Technology Advice was streamlined in 14 districts. District and State level awards in excellence in extension was provided for outstanding technical officers with certificate and cash award at State level and district level. Inorder to strengthen ATMA model of extension, new components under ATMA plus were introduced during the period. All extension scheme components under ATMA Plus needs to be implemented in 12th Five Year Plan with more convergence of schemes under Animal Husbandry, Dairy and Fisheries.
Crop Insurance Schemes
2.50 During 2014-15, 1.31 lakh farmers were enrolled under the State Crop Insurance Scheme and an amount of ₹500 lakhs deposited towards State share in the State crop insurance fund. Under Modified National Agricultural Insurance Scheme (MNAIS), a component under National Crop Insurance Scheme (NCIP), around 20000 farmers were insured covering a total area of 26215 ha of paddy, banana, plantain and tapioca during the Rabi and Kharif season of 2014-15. An amount of ₹425 lakhs were paid as claims during the period. Under Weather Based Crop Insurance Scheme (WBCIS), a component under NCIP, 11 crops were notified and 29,502 farmers were enrolled covering an area of 22,270 ha and a total claim of ₹285 lakhs were settled during the period. An amount of ₹ 471 lakhs was allocated as premium subsidy under the scheme. A total claim of₹30 lakhs was settled among 648 farmers under the Coconut Palm Insurance Scheme (CPIS). The farmers pay 25% of the premium and the rest being subsidized by Coconut Development Board (50%) and the State Government (25%) under the scheme. The other insurance programmes implemented through Agriculture Insurance Company are Rubber Plantation Insurance (RPI) and Rainfall Insurance Scheme for Coffee (RISC). Around ₹98 lakhs were paid as compensation for 468 farmers covering an area of 4379 ha under Rubber Plantation Insurance scheme towards insurance cover against the loss of trees due to insured perils. Under the Rainfall Insurance Scheme for Coffee (RISC), the Coffee Board provides 50% subsidy and the scheme is being implemented in Idukki, Wayanad and Palakkad districts. During 2014-15,120 farmers joined the scheme covering an area of 118 ha and ₹8 lakhs were disbursed as claims.
Organic Farming
2.51 Around 43.1 million hectares of agriculture land, including conversion areas, was used for organic cultivation in 2013 in the world. The region with largest areas of organic agricultural land are oceanic (17.3%) followed by Europe (11.5%). The area under organic certification (including wild harvest) in India declined to 47.20 lakh ha during 2013-14 as against 52.11 lakh ha during 2012-13. The States occupying top position with respect to area under organic certification are Madhya Pradesh (17.58 lakh ha),Himachal Pradesh (16.68 lakh ha), Rajasthan (5.99 lakh ha) and Uttar Pradesh (1.12 lakh ha). Kerala has 15,162 ha under organic certification. The biofertiliser production in India during 2013-14 increased to 65,528 MT from 46,837 MT in 2012-13. The major production is from Tamil Nadu (14,105 MT) followed by Karnataka (9907 MT). Kerala produced 3520 MT of biofertilisers. The use of pesticides in Kerala decreased during 2013-14. The consumption of fungicides (technical grade) was 477.18 MT during 2013-14 which declined to 401 MT in 2014-15 and the consumption of insecticides (technical grade) declined to 327 MT in 2014-15 from 555 MT in 2013-14. The declining trend of use of pesticides is an indication towards organic movement. During 2014-15, 119 vermi compost units have been established under organic farming by the State Horticulture Mission and an area of 2000 ha has been brought under organic certification The Department of Agriculture has been implementing a comprehensive project on organic farming in Kasaragod district and it is envisaged to cover potential areas in other districts. The details of consumption of fertilisers and average prices of agricultural inputs are given in Appendix 2.19 & 2.20. The selected indicators of agricultural development is given in Appendix 2.21.
Expansion of High Tech Agriculture
2.52 Hi-Tech Agriculture has been given priority in the State during the 12th plan period. The promotion of high tech agriculture covering protected agriculture and open precision farming was initiated in 2012-13 as part of vegetable development programme of the State. Production under protective cultivation becomes the principal way for Isreali growers to ensure a constant, year round supply of high quality products while minimizing the use of chemicals. A total number of about 1200 polyhouses were established during 12th plan including 174 polyhouses under State Horticulture Mission (SHM) during 2014-15. Protected cultivation structures with partially modified environment are useful for combating both biotic and abiotic stress that limit the productivity and quality of produce, and also for production throughout the year. The scheme has evoked good response from the farming community with large number of young farmers actively participating in the programme getting good returns from crops like salad cucumber, cow pea, and capsicum. Issues like marketing and technical support need to be addressed for taking high tech farming forward in the State.
Crop Health Management
2.53 A new approach on crop health management was initiated during 2013-14 to bring together management of sustainable ecosystems and people’s health through good plant protection practices (GPPP). Development of pest and disease surveillance system, implementation of area wide integrated pest management demonstration, establishment of plant health clinics and biocontrol laboratories, development of parasite breeding stations etc are the major components of the scheme. Under the scheme during 2014-15, 5772 plots in 481krishi bhavans belonging to 69 blocks were selected for pests and disease surveillance and advisory services for 5 crops, established 60 plant health clinics at block level. Conducted about 1250 awareness campaigns and workshops including rodent control campaign. District Diagnostic team was constituted as part of pest and disease surveillance project. A PG Diploma programme on plant health management has been initiated for the technical officers of the Department of Agriculture in collaboration with the National Institute of Plant Health Management, Hyderabad. District level as well as plant clinic level pest news bulletin were also published on monthly and fortnightly basis.
Section 2
Livestock Development
2.54 Livestock is a major source of livelihood for the World’s poor. It is an integral part of India’s agricultural economy and plays a multifaceted role in providing livelihood support to the rural population. Livestock sector apart from contributing to national economy in general and to agricultural economy in particular, also provides employment opportunities, asset creation, coping mechanism against crop failure and social and financial security. Livestock is the main source of animal protein for the population. Small and marginal farmers and landless labourers own majority of the livestock resources. Hence sustainable development of the livestock sector would lead to more inclusive development and empowerment of women. Livestock sector contributed 27.62% of the Agriculture GDP of the State during 2014-15 (at constant price with base year 2011-12), while in 2013-14 the share was 25.25 per cent. Thus in 2014-15 the share of the sector in Agriculture GDP has increased, the sector as a whole recording a positive growth rate of 4.3 percent over 2013-14.
Production of major livestock products
Milk
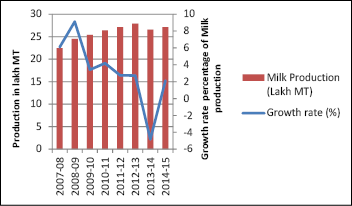
2.55 India ranks first among the world’s milk producing nations. At the national level milk production has increased from 1026 lakh MT in 2006-07 to 1279 lakh MT in 2011-12. Milk production during 2013-14 & 2014-15 was 1376.8 lakh MT and 1463.1 lakh MT respectively with an annual growth rate of 3.96% and 6.27% respectively. Among the major milk producing States in India Uttar Pradesh (252 lakh MT) followed by Rajasthan (169.3 lakh MT) Gujarat (116.9 lakh MT) and Madhya Pradesh (107.8 lakh MT) are at the top. Kerala ranks 14th with 27.1 lakh MT in 2014-15. The per capita availability of milk at national level is around 307 grams per day in 2013-14 which is more than the world average of 294 gm per day.
2.56 Milk production in the State increased from 21.19 lakh MT at the end of the tenth plan (2006-07) to 27.16 lakh MT at the end of the eleventh plan (2011-12). Milk production during 2013-14 and 2014-15 was 26.55 lakh and 27.11 lakh MT respectively, the percentage change being 4.83 per cent and 2.11 per cent respectively. Growth of milk production during 2014-15 in the State is far below that at the national level. During 2014-15, Kerala contributed only 1.85% to the annual milk production of the country.
2.57 The production of major livestock products at the National level and State level are shown in Table 2.3
Table 2.3
Production of Major Livestock Production
Sl No |
Year |
Kerala |
India |
||||
Milk (lakh MT) (growth %) |
Egg (crore)(growth %) |
Meat (lakh MT)(growth %) |
Milk (lakh MT) (growth %) |
Egg (crore)(growth %) |
Meat (lakh MT) (growth %) |
||
1 |
2006-07 (Xth Plan ) |
21.19 |
119.39 |
1.98 |
1026 |
5066 |
23 |
2 |
2011-12 (XI Plan ) |
27.16 (2.76) |
170.48 (1.97) |
4.26 (24.91) |
1279 (5.01) |
6645 (5.44) |
55 (14.58) |
3 |
2012-13 |
27.9 (2.72) |
223.7 (33.22) |
4.01 (-5.78) |
1324 (3.52) |
6973 (4.94) |
59 (7.27) |
4 |
2013-14 |
26.55 (-4.83) |
247.69 (10.72) |
4.16 (3.76) |
1376.8 (3.99) |
7475.2 (7.2) |
62 (5.08) |
5 |
2014-15 |
27.11 (2.11) |
250.36 (1.08) |
4.46 (7.16) |
1463.1 (6.27) |
7848.4 (4.99) |
67 (8.01) |
Source: Animal Husbandry Department
2.58 The production of milk and annual percentage change from 2007-08 to 2014-15 of the State is shown in Figure 2.5.
Fig 2.5
Production of Milk and its growth rate.
Source: Animal Husbandry Department
Egg/Meat
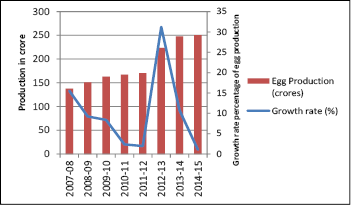
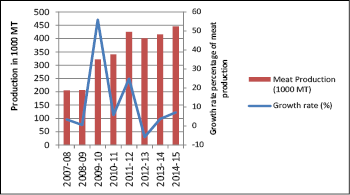
2.59 At the national level egg production at the end of the 10th plan (2006-07) was 5066 crore as compared to 6645 crore at the end of the 11th plan (2011-12). Egg production during 2013-14 & 2014-15 was 7475.2 crore and 7848.4 crore respectively with annual growth rate of 7.2% and 4.99% respectively. Total poultry population in our country was 72.921 crore and the percapita availability of egg during 2013-14 was around 61 eggs per year. Tamil Nadu is the largest egg producing State in India (1592.5 crore) followed by Andhra Pradesh (1309.5 crore), Telangana (1061.8 crore) and Maharashtra (507.9 crore). Kerala ranks 9th with 250.4 crore in 2014-15. At the national level meat production increased from the level of 23 lakh MT (2006-07) to 55 lakh MT during 2011-12. Meat production during 2013-14 and 2014-15 was 62 lakh MT and 66.9 lakh MT respectively with an annual growth rate of 5.08% and 7.9%. India is the second largest exporter of buffalo meat in the world. Among the Indian states Uttar Pradesh is the largest meat producer (13.9 lakh MT) followed by West Bengal (6.6 lakh MT), Maharashtra (6.3 lakh MT), and Andhra Pradesh (5.3 lakh MT). Kerala ranks 7th with production at 4.45 lakh MT in 2014-15.
2.60 Egg production in the State increased from 119.39 crores at the end of the tenth plan (2006-07) to 170.48 crores during the year 2011-12. The egg production during 2013-14 & 2014-15 was 247.69 crores and 250.36 crores respectively with an annual growth rate of 10.72 % and 1.08% respectively. Meat production in the State increased from the level of 1.98 lakh MT at the end of the tenth plan (2006-07) to 4.26 lakh MT during the year 2011-12. The meat production during 2013-14 & 2014-15 was 4.16 lakh MT and 4.46 lakh MT respectively with annual growth rate of 3.76 % and 7.16% respectively. Growth of egg production during 2014-15 of the State is far below the same at the national level. But for meat, the growth percentage during 2014-15 is almost the same as that at national level. During 2014-15 Kerala contributed 3.19% of the annual egg production and 6.67% of the annual meat production to the country.
2.61 The production of Egg and Meat and corresponding growth rates from 2007-08 to 2014-15 of the State is shown in Figure 2.6 and 2.7.
Fig 2.6
Production of Egg and its growth rate
Source: Animal Husbandry Department
Fig 2.7
Production of Meat and its growth rate
Source: Animal Husbandry Department
Dairy Farming
2.62 In the year 2015, State Pollution Control Board has enhanced the number of cows to a maximum of 20 in the green category and above 20 in the orange category while categorising livestock farms based on the intensity of pollution. This decision of the Pollution Control Board was a great support to the dairy farmers in the State.
Milk Marketing
2.63 During 2014-15, a total of 5568.77 lakh litres of milk was procured by the dairy co-operative societies in the State of which 3535.14 lakh litres were sent to the dairies and 2033.63 lakh litres were marketed locally by the societies. The average milk procured per day by APCOS during the year 2014-15 was 1026 MT against the previous year average of 942 MT. The procurement/day/society during 2014-15 was 348 litres and during 2013-14 it was 335 litres. The procurement of milk by Kerala Co-operative Milk Marketing Federation (KCMMF) increased to 3636.81 lakh litres against the sale of 4487.02 lakh litres during 2014-15 which shows a wide gap between procurement and supply. The shortfall between milk procurement and sales was met by arranging milk mostly from State milk federations of Karnataka, Tamil Nadu, Andhra Pradesh and Maharashtra and purchase of skimmed milk powder. Data on procurement and sale of milk by different dairies of KCMMF during 2010 to 2015 is given in Appendix 2.22 and performance of KCMMF during 2008-09 to 2014-15 is shown in Appendix 2.23 and average quantity of milk procured per day by APCOS are shown in Appendix 2.24.
2.64 The procurement and selling price of milk in Kerala was revised by ₹3.00 per litre w.e.f 21.07.2014 of which ₹2.40 was passed on to the farmers. Kerala is one of the States offering the highest milk price to the farmers. The price revision and price spread of milk from 2009 onwards is given in Appendix 2.25 & 2.26 respectively.
Weak Feed and Fodder Base
2.65 Special focus has been given to fodder and feed production in Kerala to support development of the livestock sector considering the wide gap in the availability of these two critical inputs. The Dairy Development Department is the nodal agency for fodder development activities in the State. During the year 2014-15, the Department could add 3174 Ha to the existing cultivated area resulting in 5.55 lakh MT more of green fodder to the existing stock. Assistance was provided to farmers for Azolla cultivation, mechanization of fodder cultivation and harvesting, irrigation facilities etc., Fodder exhibitions and workshop etc. were also included in the fodder development activities. Innovative fodder development programs under Integrated Dairy Development Program were implemented in the districts of Kannur and Thrissur. To overcome shortage of raw materials for cattle feed production, maize was cultivated in 318 Ha of land producing 1100 tons of maize grain. The total production of cattle feed during 2014-15 was 3.61 lakh MT as against 3.92 lakh MT during 2013-14. The production of feed and fodder are shown in Appendix 2.27, 2.28 & 2.29.
Breeding Support
2.66 Kerala Livestock Development Board (KLDB) is involved in the production and
distribution of frozen semen. Compared to 2013-14, semen production increased from 28.53 lakh doses to 34.45 lakh doses during 2014-15. The distribution inside and outside the State increased from 17.31 lakh doses to 17.55 lakh doses and from 7.59 lakh doses to 11.26 lakh doses respectively during this period. Details are shown in Appendix 2.30.
2.67 The number of Artificial Insemination (AI) centres in the State during 2014-15 was 2510. The number of inseminations done during 2014-15 was 12.77 lakh and calving recorded was 3.2 lakh. The average number of inseminations needed for producing one calf is 4 . The details of AI are shown in Appendix 2.31. The quality of AI is not improving and so measures to improve the quality of semen supplied needs to be taken up immediately. Activities of the KLD Board are given in Appendix 2.32.
Special Livestock Breeding Programme (SLBP)
2.68 Calf rearing in Kerala is an expensive activity. Farmers compromise with the management practices and nutrition to save expenses. Consequently the growth and reproductive performance of the animals are affected adversely. Providing assistance for balanced feeding and scientific management can solve the issue to a major extent. The SLBP was initiated in Kerala in 1976 with the above objective. During 2006-07 the scheme was extended to buffalo calves also as a measure to curtail the drastic reduction in the buffalo population. During 2014-15, 84712 calves were enrolled as against 39500 calves in 2013-14. Year wise details from 2004-05 onwards are shown in Appendix 2.33.
Animal Health Care
2.69 With the improvement in the quality of livestock through cross breeding programs, the susceptibility of various diseases including exotic diseases has increased. The Animal Husbandry Department provides veterinary care mainly through 14 district veterinary centres, 50 veterinary polyclinics, 213 veterinary hospitals and 869 veterinary dispensaries. The Department has taken efforts to introduce emergency veterinary care during odd hours in selected blocks of the State and during the previous year this facility was extended to 50 selected blocks.
2.70 The Department through the Animal Disease control project has successfully taken up massive vaccination campaign to prevent foot and mouth disease (FMD) outbreak and also vaccinations for poultry and ducks against avian diseases. During the past year the State witnessed the attack of the dreadful disease, highly pathogenic Avian influenza (Bird flu) in Kuttanad region, where the duck population was severely affected. As part of the comprehensive preparedness against bird flu the Department is carrying out a massive surveillance program this year. The laboratory network coverage of the Animal Husbandry Department has been strengthened for professional and timely diagnosis of animal diseases and thereby ensuring animal health. Data regarding outbreaks, attacks and deaths of major contagious diseases of animals in Kerala for the period from 2008-09 to 2014-15 are given in Appendix 2.34. Anthrax, Hemorrhagic Septicemia and FMD are reported but as far less numbers compared to previous years. The State has already eradicated the dreadful disease of rinderpest and no outbreak was reported during last year. No outbreak of Black Quarter disease was also reported during 2014-15.
Production of Vaccine in Institute of Animal Health and Veterinary Biologicals, Palode
2.71 The Institute of Animal Health and Veterinary Biologicals, Palode is the sole agency engaged in the production and distribution of animal vaccine in the State. The production details of vaccines manufactured here are shown in Appendix 2.35. During 2014-15, the production of poultry vaccine was 274.70 lakh doses and livestock vaccine was 4.27 lakh doses. Compared to the previous year, production has fallen by 25.26 per cent and 36.27 per cent respectively. Number of vaccinations done during 2014-15 was 21.56 lakh numbers for livestock and 154.57 lakh numbers for poultry. Compared to the previous year, vaccination to cattle decreased by 25.28 per cent and vaccination to poultry increased by 50.70 percent. Anti Rabies Vaccinations done in dogs increased from 1.27 lakh numbers to 1.79 lakh numbers during 2014-15. Details are given in Appendix 2.36.
Prices
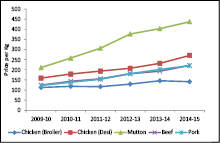
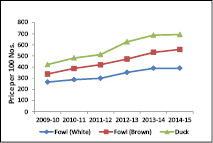
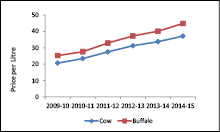
2.72 Average price of important inputs and products of livestock sector for the last six years is presented in Appendix 2.37 and almost all the products recorded increase in prices during the period. Compared to 2013-14, there was increase in the price of all categories of meat except broiler chicken during 2014-15. The price of chicken (Desi) increased by 16.76 per cent, mutton by 8.46 per cent, beef by 14.48 percent and pork by 9.24 per cent. The price of chicken (broiler) decreased by 3.21 per cent. Compared to 2013-14, the price of fowl-white egg increased by 0.26 per cent, brown egg by 5.08 per cent and duck egg by 0.73 per cent during 2014-15. Compared to 2013-14, the price of cow milk increased by 10.11 per cent and buffalo milk by 11.84 per cent during 2014-15.
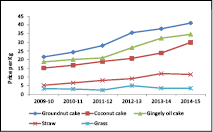
2.73 On the input side, the price of straw decreased by 4.02 per cent and grass remained the same during 2014-15. Compared to the previous year, the price of groundnut cake increased by 8.66 percent, coconut cake by 25.74 per cent and gingely oil cake by 6.96 per cent during 2014-15 and the increase in the price of inputs is a serious threat to dairy farming and hence the possibility of indigenous source of feeds is to be explored. The trend in average prices of livestock products from 2009-10 to 2014-15 is shown in Fig 2.8.
Fig 2.8
Trend in Average Prices of Livestock Products from 2009-10 to 2014-15
Meat Egg
Milk Feeds
Annual Plan 2014-15
2.74 Annual Plan 2014-15 earmarked an outlay of ₹295.16 crore and ₹70.00 crore for Animal Husbandry and Dairy Development sub sectors and expended ₹216.40 crore (73.32 per cent) and ₹66.85 crore (95.5 per cent) respectively. Special Livestock Breeding Programme (SLBP) and Strengthening of veterinary services were two major projects implemented with an outlay of ₹46.39 crores and ₹38.69 crore respectively and ₹46.10 crore (99.37 per cent) and ₹22.46 crore (58.05 per cent) were expended. Under dairy development, milk shed development and assistance to primary dairy co-operatives are the major schemes implemented with an outlay of ₹37.50 crore and 20.50 crore respectively and ₹25.33 crore (67.5 per cent) and ₹15.48 crore (75.5 per cent) were expended.
Key initiatives in 2015-16
The key initiatives of the Dairy Development and Animal Husbandry Department are shown below:
• Emergency Veterinary service during odd hours extended to 50 selected blocks of the State during 2015-16.
• Strengthening of infrastructure facilities of laboratories for improved disease diagnosis and surveillance.
• Antirabies vaccination campaign was implemented to control the dog population and eliminate rabies in Kerala by 2020.
• Special Livestock Breeding Programme, an amount of ₹46.39 crore earmarked.
• Special attention to cattle feed production, cattle feed plant at Thiruvangoor and Idukki.
• Augmenting poultry production through villages.
• Integrated dairy development programme for Kannur, Idukki & Ernakulam districts with a plan outlay of ₹12.75 crore.
• Assistance for regional labs at Kasargod and Kottayam and State Dairy Lab, Thiruvananthapuram.
• Milk ATM and digital pass book for dairy farmers - established in Wayanad district.
Section 3
Fisheries Development
2.75 Accounting for about 5.4% of the global fish production, India today is the second largest fish producing nation in the world. India is also a major producer of fish through aquaculture and ranks second in the world after China. The provisional figure for total fish production in India during 2014-15 is 10.06 Million Tonnes (MT) with a contribution of 6.57 MT from Inland sector and 3.49 MT from Marine sector. Fish production has shown a steady increase since 1991. From 3.84 MT in 1991, it increased to 10.06 MT in 2014-15. A steady growth has been observed in marine sector since 2008-09. Inland fisheries presently has a share of about 65% in total fish production of the country. The sector contributes about 1% to the overall GDP and around 5.5% of the GDP from Agriculture and allied activities. During 2014-15, export of marine products from India was 10,51,243 tonnes valued at ₹33,441.61 crore. Compared to the previous fiscal, a growth of 10.6% has been recorded in the value of exports. Details are provided in Appendix 2.43. Fisheries sector contributes significantly to the national economy providing livelihood to approximately 14.49 million people in the country. It has been recognized as a powerful income and employment generator as it stimulates growth of a number of subsidiary industries. It is also a source of cheap and nutritious food besides being a source of foreign exchange. Fisheries is recognized as a promising sub-sector of agriculture and allied activities in India.
2.76 As per the latest estimates, the fishermen population in Kerala is 10.18 lakh, of which 7.83 lakh are engaged in marine fisheries and 2.34 lakh in inland fisheries. Alappuzha (1.89 lakh) has the largest fishermen population, followed by Thiruvananthapuram (1.69 lakh) and Ernakulam (1.35 lakh). The district wise details of fishermen population are given in Appendix 2.38. The fishermen of the State contribute about 8.8 percent of the GSDP from the primary sector which is of significance to the state economy. The Gross State Domestic Product of the State has been increasing over the years, but the share of primary sector and that of fisheries sector has been declining. The share of fisheries sector in the State Domestic Product has declined from 1.12 percent in 2011-12 to 1.07 per cent in 2014-15. The share of Primary Sector in GSDP has declined from 15.20 per cent in 2011-12 to 12.15 percent in 2014-15. The contribution of fisheries sector in GSDP is given in Appendix 2.39.
2.77 Marine fish production of India during the year 2014-15 has provisionally been estimated as 3.49 million tones with an increase of about 0.05 million tonnes compared to the estimate for the last year. As per estimates of 2013-14, among the states, Gujarat was the highest contributor of marine fish production followed by Kerala. In total fish production in 2014-15, Andhra Pradesh was the highest contributor and Kerala stands at 5th position. Marine fish landings in Kerala during 2014-15 were 5.24 lakh tonnes. Though the quantum of fish landings in Kerala has been declining since 2011-12, there is a slight increase in 2014-15, compared to 2013-14. High value species among the fish catch is less. However, significant among them are Seer fish, Prawn, Ribbon fish and Mackerel. The quality of these high value species in the total catch ultimately decides the income of the fishermen. The species wise marine fish landings in Kerala from 2011-12 to 2014-15 are shown in Appendix 2.40.
Trend in Production
2.78 As per estimates of 2013-14, among the maritime states in India, Kerala occupies the second position in marine fish production. The total fish production in Kerala during 2014-15 was 7.26 lakh metric tonnes. The marine fishery resources of the State have almost attained the optimum level of production. At the national level about 65 per cent of the total fish production is contributed by the inland sector, were as at the State level, the share of inland sector is relatively less than the marine sector. The current level of Inland fish production is 2.02 lakh tones, and it shows an increase of about 8 percent over the previous year. The species-wise inland fish production in Kerala from 2011-12 to 2014-15 are shown in Appendix 2.41.
2.79 Indian marine fisheries is also passing through a crisis due to its over capacity and open access nature. During 2014-15, India’s total fish production is provisionally estimated to be 10.06 million tonnes of which 3.49 million tonnes was from marine sector and 6.57 million tonnes was from Inland sector (Fig 2.9).
Fig 2.9
Marine and Inland Fish Production in 2014-15 - All India and Kerala
Marine and Inland Fish Production Marine and Inland Fish
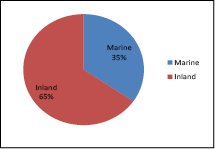
All Inida (2014-15) Production, Kerala (2014-15)
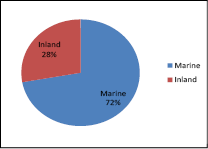
2.80 The marine fish production in Kerala has tended to fluctuate while the inland fish production has shown signs of improvement from 1999-2000. Marine fish production has increased marginally from 5.22 lakh tonnes in 2013-14 to 5.24 lakh tonnes in 2014-15. Inland production has been increasing during the recent years. During 2014-15, the share of inland fish production in the total fish production of the State was 27.8 percent. The details of fish production for the last 5 years are given in Appendix 2.42 and Figure 2.10.
Fig 2.10
Fish Production in Kerala (2010-11 to 2014-15)
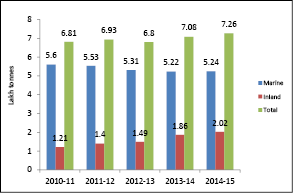
Source: Department of Fisheries, Government of Kerala
2.81 The key elements of the 12th Five Year Plan in the fisheries sector are launching of a comprehensive coastal area development project covering infrastructure, housing, sanitation, drinking water and livelihood, action plans for augmenting inland fish production to 2 lakh tonnes by the end of the plan from 1.17 lakh tonnes, enhancement of seed production, strengthening of post-harvest infrastructure like better fish landing and handling facilities, cold chains, storage facilities as well as marketing facilities for the development of the sector and improvement in the production of value added products, micro enterprises, credit support and coverage under social security. Annual Plans are formulated keeping in mind the priorities set under the Five Year Plans, and accordingly, the third year plan programme of the XIIth five year plan was completed in 2014-15.
Performance Review under XIIth Plan and Annual Plan 2014-15
2.82 The total approved outlay during the 12th plan under the fisheries sector was ₹1471 crore (including Special Area Development) which accounts for 1.44 percent of the total State plan outlay and 16.66 percent of the outlay under Agriculture & Allied Sectors. The actual amount budgeted during the first four years of the 12th Plan from 2012-13 to 2015-16 is ₹1053 crore and the expenditure reported up to 30/9/2015 is ₹758.13 crore (71.9%). Year-wise details are given in Table 2.4
Table 2.4
Outlay and expenditure of Fisheries and coastal area development
(₹ in crore)
Sector |
Annual Plan 2012-13 |
Annual Plan 2013-14 |
Annual Plan 2014-15 |
Annual Plan 2015-16 (till 30/09/2015) |
Total |
|||||
Outlay |
Exp |
Outlay |
Exp |
Outlay |
Exp |
Outlay |
Exp |
Outlay |
Exp |
|
| Fisheries | 142 |
141 |
158 |
130 |
177 |
145 |
178.4 |
65.42 |
655.4 |
481.42 |
| Coastal Area Development | 64 |
49 |
58 |
48 |
87 |
47 |
189.3 |
132.71 |
398.3 |
276.71 |
| Total | 206 |
190 |
216 |
178 |
264 |
193 |
367.7 |
198.13 |
1053.7 |
758.13 |
Source: Planspace Kerala and Budget Statements
2.83 The total expenditure under State plan schemes during 2014-15 was ₹193 crore, which was 73 per cent of the State plan outlay. There are 9 partially aided central sector schemes having an outlay of ₹ 60.45 crore and the expenditure during this period was ₹57.10 crore. The outlay and expenditure for various types of schemes implemented in the fisheries sub sector during 2013-14 and 2014-15 are given in Appendix 2.44. An external monitoring mechanism can be adopted for evaluating the impact of major schemes implemented by various agencies. Multiplicity of agencies and schemes pose the threat of overlapping of schemes implemented by various agencies. This may be avoided.
Key Initiatives during 2015-16
2.84 In order to address the relative backwardness of the fisher folk population and the fishing community, the State has initiated a new scheme namely ‘Basic infrastructural facilities and human development of fisher folk’ in 2015-16 with an outlay of ₹ 181.97 crore. Backwardness of the community is visible in terms of education, vulnerability to contagious diseases, poverty, lack of basic amenities like quality housing, drinking water, sanitation and hygiene etc. The new scheme targets overall development of the fisheries sector with focus on housing. Housing includes construction of individual houses and flats with land acquisition, renovation of houses, sanitation, drinking water, electrification etc. The scheme also provides for improvements in health facilities, libraries, diversification of employment activities, completion of ongoing fishing harbours and renovation of fish seed farms and hatcheries etc.
Debt Relief to Fishermen
2.85 The burden of debt is a serious issue affecting the fishermen in the State. During the period 2008-09 to 2014-15, an amount of ₹175.70 crore has been allotted by the government for debt relief measures to fishermen and the expenditure incurred is ₹174.47 crore.
Major Developmental Programmes
2.86 The Plan schemes of the Government under Fisheries sector can broadly be classified into the following categories –
(1) Marine fisheries development
(2) Inland fisheries development
(3) Extension, Training & service delivery
(4) Modernisation of markets and value addition
(5) Social Security to fishermen
(6) Development of Fishing Harbours and management
(7) Scheme for the Fisheries University
(8) Coastal Area Development
2.87 Under the Matsya Samrudhi Project, 98.33 ha of fresh water area and 2422.75 ha brackish water area was brought under aquaculture. During 2014-15, 25935 MT fish, 2624 MT shrimp and 665 MT Mussel were produced. Under integrated farming, 507.91 ha of unutilized wet land were brought under paddy cum fish culture. For enhancing inland fish production, 183 lakh fresh water fish seeds and 181 lakh brackish water shrimp seeds were released to selected open waters. 147.40 lakh numbers of good quality fish seeds were produced in the Government seed farms at Polachira, Pannivelichira and Malampuzha. 41.51 lakh numbers of shrimp seeds were produced at Regional shrimp hatchery, Azheekode.
2.88 As part of addressing issues prevailing in the housing sector of fishermen, new houses were constructed for 2600 fishermen families. The construction of 2861 houses that was started in the previous year using the assistance under the 13th Finance Commission Award, have been completed. Assistance was given to 1336 fishermen family for the construction of toilets. Using the assistance under 13th Finance Commission Award, infrastructure facilities of 14 colonies were improved. In addition, assistance was given to fishermen families for the construction of 562 new houses and the repair of 904 existing houses. In 2014-15, under the Plan scheme ‘Integrated Development of Fishing Villages’, Kerala State Coastal Area Development Corporation is engaged in the implementation of 13 drinking water schemes, 14 electrification schemes, 7 library construction, 34 high mast light installation, 193 individual toilet construction, one market construction etc.
Fishing Harbour
2.89 The Government of Kerala has so far completed construction work of 12 fishing harbours and the works of 12 fishing harbours are progressing. The completed fishing harbours include Thankassery, Neendakara, Kayamkulam, Munambam, Beypore, Puthiyappa, Chombal, Moplabay, Azheekal, Ponnani etc. During 2015-16, Plan support was extended to Chettuvai, Cheruvathur, Arthungal, Vellayil, Thanoor, Manjeswaram, Koyilandi and Thalai fishing harbours. The works of Chettuva, Cheruvathur, Thalai and Muthalapozhi will be completed during the current year. Construction of fishing harbours is undertaken with the help of State fund, fund from central government (50% and 75% CSS), fund under central schemes like RKVY, and fund from agencies like NABARD (under RIDF). During 2014-15, ₹48 crore including central share was allotted for the construction of fishing harbours of which ₹46.77 crore was expended till September 2015. An amount of ₹12.22 crore was expended for works under RIDF, during this time. Time bound completion schedules for all ongoing fishing harbours need to be worked out. Recent changes in the funding pattern of CSS schemes put forward by the central government would have a direct bearing on the completion of fishing harbours in Kerala. The State would find funding of such big projects a big hurdle. The progress of ongoing fishing harbours is shown in Appendix 2.45.
2.90 Total revenue collected from fishing harbours and fish landing centres has fallen from ₹ 510.58 lakh in 2013-14 to ₹490.96 lakh in 2014-15. Highest revenue collection has been from Neendakara harbour since 2012-13. However, the revenue collection from Neendakara fishing harbour has seen a drastic fall from ₹338.70 lakh in 2013-14 to ₹ 154.58 lakh in 2014-15. Another significant contributor to revenue collection in 2014-15 has been Thottappally fishing harbor, whose contribution has increased from 0.44 lakh in 2013-14 to ₹.132.49 lakh in 2014-15. Together, Neendakara and Thottappally contributed about 58.5 % of the total revenue collection from fishing harbours and fish landing centres in Kerala. The details are given in Appendix 2.46.
NABARD assisted schemes
2.91 Apart from the construction of Fishing Harbours, NABARD funds have been used for works like construction of Fish Landing centres, roads, bridges, locker rooms, walkways, etc. NABARD under RIDF XV has sanctioned 11 works including Fishing Harbour at Chellanam. Nine works have been completed. Construction of Chellanum fishing harbor will be completed during 2015-16. Ten projects including 7 bridges, fish landing centres and walk way amounting to ₹.62.91 crore was sanctioned under RIDF XVII. Two bridges and a Fish Landing centre have been completed, and the rest are progressing. Works sanctioned under RIDF XIX include 12 fish landing centres, replenishment of Neendakara fishing harbor, 9 bridge works and 2 road works amounting to ₹.76.72 crore. 4 Fish Landing centres and one road work have been completed and the rest are progressing. Works for 2 roads and a bridge totaling ₹ 7.82 crore have been sanctioned under RIDF XX.
Social Security and livelihood support to Fishermen Community
2.92 Government of Kerala has placed emphasis on various schemes implemented to ensure social security and livelihood support to fishermen community. Apart from the Fisheries Department, Matsyafed and Kerala Fisherman’s Welfare Fund Board (KFWFB) also implement such schemes. Plan support is also available for many such schemes. Some of these schemes are Centrally Sponsored Schemes. Schemes include those for Housing, Insurance, Pension etc apart from those which enable fishermen to earn livelihood on a continuous basis. Details of such schemes implemented by the Department and KFWFB are provided in Appendix 2.47 & 2.48 respectively. The State has been able to provide greater assistance to the fishermen community and also expand the social security net over the years.
Matsyafed
2.93 Matsyafed is an apex federation of 665 primary level Fishermen Development Welfare Co-operative Societies, of which 340 are in marine sector, 192 are in inland sector and 133 women co-operative societies. The total membership in these societies is 4.86 lakh. The authorised share capital of the federation is ₹150 crore. Matsyafed has organised 15888 SHGs with 191222 members. The groups have mobilized ₹88.93 crore as thrift. By providing micro finance and interest free loans, Matsyafed has made a significant impact in the area of micro credit. Matsyafed has also been successful in enabling the fisher folk have access to vital fishing inputs. The achievement of various programmes implemented by Matsyafed is given in Appendix 2.49.
2.94 The 12th plan strategy is to ensure sustainable growth of Fish and Fisheries for nutrition, food security and economic growth by ensuring proper utilization of infrastructure created in the last plan. Special emphasis is being given to conservation and management of inshore fishery resources, enhancement of offshore marine fish production, maximum utilization of harvested fish and value addition.
Section 4
Water Resources
2.95 In most developing countries, agriculture is the dominant user of water, accounting for more than 85 percent of all water use. Irrigation plays an important role in the growth of agricultural income of the State. At the same time, this also raises significant issues for water resource management like problems dealing with water scarcity, competing demands from other sectors, irrigation service delivery and system management, water use efficiencies and so forth. The primary objective in coming years will be to balance water supply and demand among users to ensure adequate water for agriculture and sustainable irrigation system management while satisfying other needs. The basic premise of water resource management is that river basins are best managed and developed as an integrated whole. This is always legally and politically complex due to the challenges of allocation between users and between uses.
2.96 The water availability per capita in Kerala is one of the lowest in the country and has been declining overtime. The water availability of Kerala is dependent on rainfall and other climatic factors, particularly the spatial and temporal distribution of rainfall. Due to poor retention capacity of the soil, water available through rainfall cannot be conserved effectively. Irrigation development in Kerala is mainly centered on the development of major and medium irrigation projects. On analyzing the investment pattern during IXth, Xth & XIth plan period, it is evident that major irrigation occupies a major portion of the outlay. This increased sharing pattern was provided for completing the long pending major irrigation schemes.
Live Storage Capacities of Irrigation Reservoirs
2.97 Surface irrigation constitute major chunk of irrigation infrastructure in the State. There are 18 dams in the State intended for irrigation. Out of this, 14 have storages and remaining are barrages. The live storage position of the reservoirs during the beginning and end of the monsoon period during 2013 to 2015 are given in Appendix 2.50. During 2015, at the beginning of monsoon, the total storage was 527.83 Mm3 and at the end of the monsoon, the level was raised to 1165.01 Mm3, as against the previous year levels of 415.19 Mm3 and 1258.73 Mm3 respectively.
Fig 2.11
Live storage Position in the Reservoirs (2013-15)
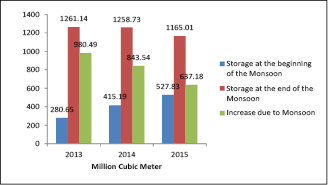
Source: Water Resource Department, Government of Kerala
Review of Major Projects
2.98 The overall performance of the major and medium irrigation sector was not encouraging. Details of the progress of implementation of ongoing projects as on November 2015 are given in Appendix 2.51.
Karapuzha Irrigation Project
2.99 Karapuzha Irrigation Project, the first project taken up for execution during Vth Five Year Plan, envisaged construction of an earth dam across Karapuzha stream to create a reservoir of 76.50 Mm3 storage capacity and to irrigate an ayacut of 5221 hectares(net) of land in three taluks of Wayanad district. The project aims to provide irrigation facility during the second crop period of paddy. Karappuzha Irrigation Project was included in the Accelerated Irrigation Benefit Programme (AIBP) under Prime Ministers Relief Package during 2006-07.
2.100 The project was approved by Planning Commission in 1978 with an estimated cost of ₹7.60 crore envisaging irrigation to Cultivable Command Area (CCA) of 5600 ha and an ultimate irrigation potential of 8721 ha. Now, as per 2010 schedule of rates, the revised estimate is ₹441.50 crore. The cumulative expenditure incurred up to March 2015 is ₹305.39 crore. The project has been partially commissioned on 20.6.2010. The up to date CCA created is 601 ha and the corresponding irrigation potential is 938 ha. Head works of the project, works of 8.805 Km right and 16.59 Km left bank canals are completed.
Muvattupuzha Valley Irrigation Project
2.101 The project envisages the utilisation of the tailrace water from Idukki Hydro electric project to irrigate a cultivable command area of 19237 ha in Ernakulam, Kottayam and Idukki districts. MVIP was started in 1974 at an estimated cost of ₹20.86 crore and the revised estimate amount is₹967.00 crore (2012 SOR).Central Assistance had been received under AIBP for MVIP for the period from 2000-01 to 2008-09 for an amount of ₹154.964 crore. No assistance was received under AIBP after 2008-09.
2.102 Commissioning of the project is lagging due to certain incomplete works. Land acquisition also needs to be completed in some areas. Total expenditure of this project up to March 2015 is ₹903.00 crore. Works of main canal have been completed. Out of the total length of 57.154 km of branch canals, 54.647 km have been completed (96%). For distributaries, out of the total length of 218.00 km, 190.754 km have been completed so far (88%). By completing the missing links viz aqueduct of Mamalassery distributory and Muvattupuzha branch canal from ch.9800m to10210m, an ayacut of 1119 ha had been achieved during 2014-15. In spite of huge investment, the implementation of the project is lagging for more than three decades.
Idamalayar Irrigation Project
2.103 Idamalayar Irrigation Project is a diversion scheme for diverting water of Periyar river for irrigating 14,394 ha. of cultivable lands in Periyar and Chalakudy basins. The project also envisages the improvement and augmentation of Chalakudy river diversion scheme by linking with the canal of Idamalayar irrigation project. The work commenced in 1981 at an estimated cost of ₹17.85 crore and has been revised to ₹750.00 crore as per 2012 SOR. The cost escalation is due to time lag in execution.
2.104 The cumulative expenditure as on March 2015 is ₹397.86 crore. 100% works of main canal, 86.20% of low level canal, 45.80% of link canal and 96.72% of RBMC works have been completed so far.
Banasurasagar Irrigation Project
2.105 The project commenced in 1979 with an estimated cost of ₹8.00 crore to irrigate an area of 2800 ha ( net) agriculture land for the second and third crops in two taluks of Wayanad district. The revised estimate of the project as per 2010 SOR is ₹185.5 crores. The work of main canal of length 2.73 Km is completed except from Ch. 1130 M to 1500 M. The work of both branch canals – Padinjarathara branch canal and Venniyode branch canal are in progress. There are 14 numbers of distributaries in this canal system and the land acquisition process of these distributaries is progressing. Total expenditure incurred for the project up to March 2015 is ₹48.20 crore.
Flood Management Programme
2.106 Although it may not be possible to change certain factors contributing to frequent floods and droughts, like spatial and temporal distribution of rainfall, geology, geomorphology etc, it is definitely possible to have planned land use as well as development and conservation activities. If proper planning is done with regard to land use, soil conservation and developmental activities in a river basin, it may be possible to a great extent to control floods, droughts and high rate of sediment transport. Hence, flood management aims at providing a reasonable degree of protection against flood damage at economic costs.
Kuttanad Package
2.107 The total outlay of the Kuttanad Package as per M.S.Swaminathan Research Foundation (MSSRF) report is ₹1840.40 crore. Out of this, ₹1517.90 crore is set apart for the Irrigation sector (82.5%). Projects worth ₹ 771.11 crore have been sanctioned under Flood management programme. Empowered committee has given approval for ₹319.74 crore for the four schemes viz, KEL I to IV. Budgeted outlay (25%SS) during 2014-15was ₹50.00 crore and the expenditure incurred was 47.14 cr. Out of the 75% central outlay of ₹150.00 crore, the expenditure reported was₹9.07 crore. There was no central release during 2014-15. The major issues regarding the implementation of Kuttanad package is slow pace of progress, tender excess, cost escalation etc. Time bound completion of the project is required to avail maximum assistance from Government of India and to develop the Kuttanad wetland ecosystem.
Irrigation Status
2.108 The source-wise area irrigated as on March 2015 is given in Appendix 2.52 & 2.53. As per the assessment of the Directorate of Economics and Statistics, the net irrigated area in the State as on March 2015, is 4.14 lakh ha. and the gross area irrigated is 4.69 lakh ha. The percentage of increase is not significant compared to the previous year. During 2014-15, the percentage of Gross Irrigated Area to Gross Cropped Area was 17.80. The crop which benefitted the most during the period is coconut. It accounted for about 35.18 per cent followed by paddy (32 percent), banana (10.19 percent), arecanut (7.2 percent) and vegetable (5.21 per cent). Details are given in Appendix 2.54 & 2.55. There has been an increase in irrigated area for vegetable cultivation during 2014-15 compared to the previous year.
Minor Irrigation
2.109 Minor irrigation plays an important role in Kerala. The availability of large number of water bodies in the form of rivers, rivulets and ponds and the ease of institutional intervention through user groups makes minor irrigation the preferred option for irrigation development in the state. Some of the advantages of minor Irrigation are lower investment needs per hectare, shorter payback period, easier management, reduced environmental damage and better suitability to agro ecologies.
2.110 During the 12th plan period, focus has been given to this sector with special emphasis on the development of tanks and ponds, lift irrigation and other minor irrigation structures. Though the share of minor irrigation was 13% of the total budgeted outlay for irrigation sector during Annual Plan 2014-15, it accounted for 40% of the total expenditure during the year.
2.111 Physical achievement of Minor Irrigation for 2012-13, 2013-14 and 2014-15 are shown in Appendix 2.56. NABARD has been providing loan assistance for irrigation works through RIDF Phase 1 to XIX. The assistance of NABARD is by way of reimbursement. RIDF I to XII have been closed and the works under RIDF XIII to XX are in progress. Under RIDF XXI, Administrative Sanction has been received for 3 projects for ₹22.01 crore. DPR of 35 projects amounting to ₹.97.03 crore are submitted for obtaining Government approval under RIDF-XXI. Details are given inAppendix 2.57.
2.112 Union Government has approved a scheme for the rehabilitation of farmers in the distress affected districts of Palakkad, Wayanad and Kasaragod on 10.10.2006 and ₹.70.30 crore was allotted for Minor Irrigation sector. Out of the 75 works sanctioned under NABARD RIDF XIII and 62 works under NABARD RIDF XVI, 66 and 46 works were completed respectively.
Ground Water Development
2.113 Ground Water irrigation has grown rapidly over the past 50 years and now supplies over one third of the world’s irrigated area. Agriculture is by far the largest user of ground water. It can stabilize small holder farming by buffering droughts, intensifying cropping and allowing farmers to diversify and access markets for high value crops that require year round on-farm water control. Though globally ground water use in agriculture is growing, the drivers of growth differ from place to place with different implications for resource productivity.
2.114 Groundwater has rapidly emerged to occupy a dominant place in India’s agriculture and food security and it accounts for over 60 percent of the irrigated area in the country. This is a major source of water in Kerala. As per 2011 census, 65 percent of rural and 59 percent of urban households have wells. The ground water potential of Kerala is limited because 88 percent of the total geographical area of the State is underlain by crystalline rocks devoid of any porosity. There are 10 different principal aquifer systems in Kerala. Groundwater in Kerala has a potential of 34-601 metres below ground level (mbgl) and the yield varies between 0.1 – 38 lps (litres per second) depending on the area.
2.115 The main source of ground water is recharge from rainfall, which contributes about 82 percent of the total annual replenishable resources. As per ground water resource data 2011, the total annual ground water availability and the net groundwater availability in the State is 6.69 Billion Cubic Meter (BCM) and 6.07 BCM respectively. The annual ground water draft for all uses in the State is 2.84 BCM out of which 1.31 BCM is for irrigation purpose. 3.07 BCM is the net ground water availability for future irrigation development in the State.
2.116 The stage of ground water development of our State is 47%. Among the districts, Kasaragod and Wayanad ranks maximum and minimum with 71% and 18% respectively. Details are given in Appendix 2.58.
Fig 2.12
Stages of Ground Water Development
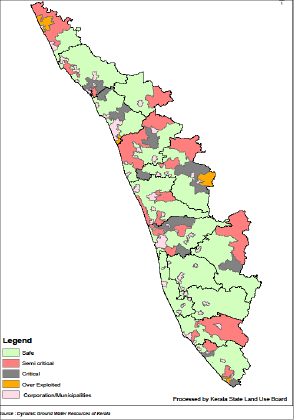
As per 2011 assessment, out of the 152 revenue blocks assessed in the State for groundwater potential, 1 block (Chittur) is categorized as over exploited, 2 blocks (Kasaragod, Malampuzha) as critical, 23 blocks as semi- critical and 126 blocks as safe.
2.117 During 2014-15, ₹19.32 crore was expended against the outlay of ₹13.56 crore by the Ground Water department. Noteworthy achievement was accomplished in Ground Water Investigation and Development. Hydrogeological, geophysical and remote sensing studies were done to identify ground water potential areas and to locate sites for ground water extraction structures such as bore well, tube well, filter point well and open well. In the present scenario of ground water exploitation and depletion, ground water conservation and recharge assumes utmost importance. Artificial recharge structures include sub surface dykes, check dams, recharge by open dug wells etc. 80 structures were implemented during 2014-15. Moreover, drinking water facility has been extended to several families under the scheme “Rajiv Gandhi Drinking Water Mission”. Detailed physical achievement during the year under report is given in Appendix 2.59.
Performance of Irrigation sector during 2014-15
2.118 During 2014-15, the total outlay and expenditure of irrigation sector was ₹749.64 crore and ₹194.68 crore respectively. Details are given in Appendix 2.60. The low expenditure of major and medium schemes was reflected in the overall performance of the Irrigation sector during the year.
SECTION -5
Forestry and Wild Life
2.119 Forest cover includes all lands which have a minimum area of one hectare and have a tree canopy density of 10 percent and above irrespective of ownership and legal status. The total forest cover of the country as per India State of Forest Report (ISFR) 2015 is 701673 sq.km which constitute 21.34 percent of the geographical area of the country. On comparison with ISFR 2013, it is observed that, there has been an increase of 3775 sq.km. in the country’s forest cover. This increase in forest cover is mainly attributed to increase in open forest category. There is an increase of 2402 sq km in Very Dense Forest (VDF) areas and 4744 sq km in Open Forest (OF) areas, while there has been a decrease of 3371 sq km in Moderate Dense Forest (MDF) areas. Maximum increase in Forest cover has been observed in Tamil Nadu (2501sq.km) followed by Kerala (1317 sq.km) and Jammu & Kashmir (450 sq.km). Area wise, the State of Madhya Pradesh has the largest forest cover of 77,462 sq.km followed by Arunachal Pradesh (67,248 sq.km) and Chattisgarh (55,586 sq.km). Mizoram, with 88.93 % of forest cover has the highest forest cover in percentage terms, followed by Lakshadweep (84.56 %). As per the report, 15 states/UTs have more than 33% of the geographical area under Forest cover. Out of these states/UTs 7 states viz; Mizoram, Lakshadweep, A & N Island, Arunachal Pradesh, Nagaland, Meghalaya and Manipur had more than 75% Forest cover while 8 states viz; Tripura, Goa, Kerala, Sikkim, Utharakhand, Dadra & Nagar Haveli, Chattisgarh and Assam had forest cover between 33% to 75%.
2.120 Geographical area recorded as ‘Forests’ in Government records is “Recorded Forest Area”. This consists of Reserved Forests (RF) and Protected Forests (PF). As per 2015 assessment, more than 75 percent forest cover within RFA has been observed in Andaman & Nicobar, Tamil Nadu and Telangana.
2.121 As per 2015 report of Forest Survey of India (FSI), the forest cover in the State of Kerala is 19239 sq.km with 1523 sq.km of very dense forest, 9301 sq.km of moderate dense forest and 8415 sq.km of open forest, the total accounting for 49.50 percent of the total geographical area of the State. Compared to ISFR 2013, the forest area in the State has increased by 1317 sq. km. The main reason for increase in forest cover is the spread of commercial plantations. On comparison with 2013 assessment, it is observed that there has been a decline in very dense forest and moderate dense forest, but the area of open forest has increased by 1423 sq. km. In Kerala, Idukki has the most forest cover (3852 sq.km) and Alappuzha has the least (113 sq.km). In terms of percentage of forest cover to total geographical area, Wayanad has the highest forest cover (83.34 %), followed by Idukki (76.74 %) and Pathanamthitta (66.38%). The district wise details of forest cover in Kerala is given in Appendix 2.61.
Natural Forest
2.122 Forests in Kerala are mainly classified into 5 major categories. The major types of forests in Kerala and species wise area under forest plantation are given in Appendix 2.62 & 2.63. During 2013-14, the quantity of timber production was 32054.971 cum (round log) and 117222 cum (round poles). During the period, there was a decrease in production of timber ( round logs) compared to 2012-13. Bamboo and reeds production showed a tremendous increase of 27.52 lakh and 71.40 lakh as against 2012-13 production of 8.74 lakh and 24.24 lakh respectively. Sandal wood production also increased from 58269.07 kg.to 62587.64 kg during the period. The trend in production of major forest produce from 2007-08 to 2013-14 is given in Appendix 2.64.
National Afforestation Programme
2.123 The National Afforestation Programme funded by Ministry of Environment, Forests and Climate Change (MoEFCC), Government of India has facilitated expansion of participatory forest management through forest development agencies, which are formed by federating Vana Samrakshana Samithies /Eco Development Committees (VSSs/EDCs). Till the end of March 2015, afforestation of 38486.23 ha of degraded forests has been completed utilizing an amount of ₹7568.20 lakh. During 2014-15, physical achievement was 6270.35 ha against target of 6299.10 ha utilizing ₹466.39 lakh.
Green India Mission
2.124 The Green India Mission aims to address key concerns related to climate change in the Forest Sector viz; Adaptation, Mitigation, Vulnerability and Ecosystem services. To this end the Mission also aims to take a broader landscape approach to address the drivers of forest degradation while supporting communities to meet their basic necessities of fodder, fuel- wood and livelihood. The general body and executive committees of the State Forest Development Agency (SFDA) has discussed the preparation of perspective plan in its meetings and has proposed the perspective plan to be implemented in the landscapes. 24 Forest Development Agencies (FDAs) are coming under these identified landscapes. Micro planning with the active involvement of local grama panchayats, NGOs and other development departments including Agriculture, Soil Conservation and Animal Husbandry have taken place at Joint Forest Management Committee (JFMC) and FDA. The objectives of the plan are to address the environmental issues, improve quality of the forests, conservation of endangered and endemic species, to improve the tree cover, improve soil and moisture condition, improve livelihood by providing more employment to the dependent communities, reduce dependency over forests, conserve the ecosystem, conserve mangroves and sacred groves, combine activities of social forestry and agro-forestry, increase forest cover in urban and semi-urban areas. The major activities proposed under Green India Mission include preparation of village level micro plan, capacity building programme of Vana Samrakshana Samithi/ Eco Development Committee (VSS/EDC), Soil & moisture conservation, Fire protection activities, Rehabilitation of shifting cultivation areas, restoration of mangroves, Bio-fencing, planting of Non-Timber Forest Product (NTFP) species etc.
Forest Revenue
2.125 Forests contributed to the non-tax revenue of the State amounting to ₹300.40 crore against a revised budget estimate of ₹383.23 crore during 2014-15. The revenue from the forest products during the period was ₹289.51 crore. Major portion of the forest revenue is from timber (Figure 2.13). amounting to ₹269.43 crore which accounted for 89 percent of the total forest revenue. As a part of revitalizing the living standards of tribal people within the forest area, the Department has vested the collection of Minor Forest products with them at free of cost. Details are given inAppendix 2.65.
2.126 The Gross State Domestic Product of the State is calculated with base year 2011-12. The share of forestry in GSDP during the period 2014-15 is 1.07 percent as against 1.15 percent during 2013-14. The share of primary sector in GSDP has decreased from 13.40 percent (2013-14) to 12.15 percent during 2014-15. The contribution of Forestry sector in GSDP is given in Appendix 2.69.
Fig 2.13
Forest Revenue in Kerala (2010-11 to 2014-15)
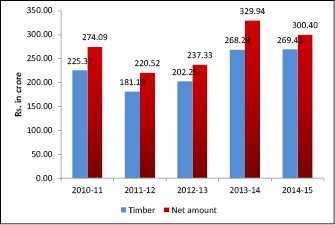
Source: Forest and Wildlife Department, Government of Kerala
Wild Life and Biosphere Reserve
2.127 The ‘Malabar Wildlife Sanctuary’ was constituted in 2009 with an area of 7421.50 Ha (74.21 Sq.Km). Also a new wild life sanctuary by name “Kottiyoor Wild Life Sanctuary” was constituted in 2011 with an extent of 30.38 sq.km. The list of sanctuaries, National Park, Biosphere Reserves and other Protected Areas in Kerala is shown in the Appendix 2.66. Our State has 3213.24 sq.km of forest under Protected Areas ( 5 National Parks, 17 Wildlife Sanctuaries and a community reserve). During 2014-15, Wildlife wing has undertaken activities such as management of protected areas, preparation and implementation of management plan/ Tiger conservation plan, conduct of wild life census, implementation of National Conservation projects etc.
General Forestry
2.128 Natural Forests in Kerala are being managed mainly for sustaining the life support systems and biodiversity conservation. Efforts were made to adopt modern technologies including the use of improved seeds and modern nursery practices in raising the plantations. Plantations of hardwood species of local origin and pulpwood species for supplying raw materials to industries were also raised. Under ‘Hardwood’ species 203.71 ha of new areas were raised and 1252.76 ha were maintained during the year 2014-15. Regarding industrial raw materials, 514.34 ha were newly planted and 1505.05 ha were maintained. Under Non-Wood Forest species, 224.84 ha new areas were raised and 419.68 ha were maintained.
Performance Review and Key initiatives during 2014-15
2.129 During 2014-15, the expenditure incurred was ₹115.90 crore against the outlay of ₹150.00 crore (77.27%). Expenditure details during 2014-15 is given in Appendix 2.67. For the overall development of tribals, Forest & Wild life Department has identified a programme viz “Oorinunarvu Kadinunarvu”. Out of ₹60.00 lakh released, ₹58.78 lakh was expended during 2014-15. In connection with the implementation of Forest Rights Act 2006, out of the 27537 eligible individual claims passed by Divisional Level Committees, 24621 rights were issued for an area of 33070 acres as on 31.03.2015. 21 titles were also issued under community rights. New schemes/ projects launched during the period –
1. Krishi Raksha Padhathi:- This is a programme under “Mission 676” which will benefit the farmers to protect their agricultural crops from the attack of wild animals. During 2014-15, ₹1300.88 lakh was expended against the outlay of ₹1400.00 lakh.
2. Biodiversity Conservation and Rural Livelihood Improvement Project (BCRLIP):- This aims at conserving Biodiversity in selected landscapes, including wildlife protected areas/ critical conservation areas while improving rural livelihoods through participatory approaches. During 2014-15,₹77.56 lakh was expended.
Afforestation Outside Forest Area
2.130 The objective of the programme is to increase tree cover in non-forest areas to achieve the ideal target of 33.3 percent of forest cover. The department has embarked on massive afforestation programme outside forest areas since 2007 with novel ideas. The massive afforestation programme launched outside the forest areas are ‘Entemaram programme, ‘Nammude maram programme, Vazhiyora thanal programme, Haritha theeram programme and Haritha keralam programme’. The total number of seedlings distributed/planted under the various programmes upto 31-03.2015 is ₹503.45 lakh. The details of seedlings distributed under these programmes are given in Appendix 2.68. The sustainability of the trees planted has to be ensured.
SECTION -6
Environment
Climate Change
2.131 India’s contribution to global CO2 emission is 2.8%. The per capita CO2 emission in the country increased steadily during 1900-2014. In 1900 it was 582.3 million tonnes and it reached 1954.02 million tonnes in 2014. (Key World Energy Statistics 2014, International Energy Agency). India is one of the countries on course to achieve the voluntary goal of reducing the Green House Gas (GHG) emission intensity of GDP (Emission Gap Report, 2014, UNEP). India’s Intended Nationally Determined Contribution (INDC) focuses on reducing the GHG emission intensity of GDP to 35% by 2030, a reduction of 33% from 2005 level. India introduced a clean energy cess on coal as an instrument for dealing with climate change. This contributes to the National Clean Energy Fund and total collection so far under the fund is ₹.17, 084.45 crore (Economic Survey 2014-15). The country has also made progress in climate change adaptation actions.
Biodiversity Conservation
2.132 The fragile nature of ecosystem in Kerala is a concern and many natural and man-made causes pose a great threat to its biodiversity. The State contains more than 4,500 species of flowering plants of which above 1,500 are endemic in nature. The following conservation initiatives are going on the State
• Peoples Bio Diversity Registers were prepared in 32 Grama Panchayats and 1 Municipality during 2014-15. The total number of registers prepared upto November 2015 is 797 which include 784 Grama Panchayats, 12 Municipalities and 1 Corporation.
• Biodiversity registers specific to two major aquatic systems of the State : Sasthamkotta and Vellayani lakes were prepared
• Marine biodiversity register of Thiruvananthapuram Coast has been prepared as part of mapping of marine biodiversity of the State with the objective of producing a data bank on the state’s marine flora and fauna, fish habitats, ecosystem, traditional fishing techniques and indigenous knowledge of the fisher communities.
• Biodiversity clubs were established in 907 institutions.
• For developing green cover and conserving Rare, Endangered and Threatened (RET) plants, manmade woodlot called ‘Shanthisthal” maintained by Biodiversity Management Committees/ Biodiversity clubs of educational institutions has been established in an area of 17 acres of land.
SECTION -7
Co- operation & Agricultural Finance
2.133 The co-operative movement in Kerala has a solid foundation and impressive record in terms of strength and financial stability and it is one of the most vibrant cooperative movements in the country. There are 14896 co-operative societies functioning under the Registrar of Co-operative Societies out of which 11565 are working, 2665 are dormant and 666 are under threat of liquidation. Financial unviability, poor governance and management, lack of professionalism, operational inefficiency and obsolete infrastructure could be probable reasons for dormancy and loss positions of the cooperatives. Also, out of the 14896 societies 30 are apex/federal societies, 3580 are credit societies /banks, 4679 are consumer societies, 576 are marketing societies and 3448 societies come under miscellaneous societies,1127 are women cooperatives, and 832 are SC/ST cooperatives. However, nearly half of the total marketing, processing, SC/ST and health cooperatives are either dormant or running in loss. Details are given Appendix 2.70.
2.134 In the Annual Plan 2014-15, large outlay was assigned for Credit Cooperatives (25 per cent), followed by Miscellaneous Cooperatives (14 per cent), Marketing Cooperatives (5.28 per cent ), SC/ ST Cooperatives (7.20 per cent),) and Assistance to Cooperative Academy of Professional Education (10.19 per cent). On the expenditure front, expenditure for Marketing Cooperatives have been low at 1.4 per cent and for Processing Cooperatives it has been nil. The major physical achievements in the sector during 2014-15 are shown in Appendix 2.71.
Credit co-operatives
2.135 The Cooperative credit structure comprises of short term and long term. The short and medium term co-operative credit structure comprises of a three tier system with the State Co-operative Bank at the apex, 14 District Co-operative Banks and 1605 Primary Agricultural Credit Societies at the grass root level. Kerala State Co-operative Agricultural and Rural Development Bank along with 63 Primary Co-operative. Agricultural and Rural Development Banks operating at the Taluk level constitute long term co-operative. credit structure.
2.136 Among the short term credit structure, Primary Agricultural Credit Societies (PACS) are the most important. There are 1642 PACS out of which 558 were running under loss, 30 dormant and 34 societies were under threat of liquidation. The PACS are functioning with a paid up share capital of ₹1766.33 crores and reserves of ₹4119.38 crores.
2.137 The performances of PACs during the year under report are not encouraging. The total loan disbursed during 2014-15 was ₹71301.88 crores in the place of ₹94881.88 crores issued in 2013-14. Compared to the previous year, there was an increase in the disbursement of medium term and long term loans but the short term loan declined. With regard to performance of the Cooperatives in disbursing agricultural loan, it is unfortunate to note that out of the total disbursement of ₹71301.88 crores, mere 10.55 per cent was for agricultural purposes. What is even more unfortunate is that out of this only ₹150.60 crores (0.21 per cent) was meted out for long term agricultural purposes.
2.138 The selected indicators of the credit operations of the Primary Agricultural Credit Societies show that, deposits of the societies increased to ₹69925.89 crores in 2014-15 against ₹67785 crores in 2013-14. The average working capital position of the societies increased to ₹91864.75 crores from ₹90245.74 crores. Selected indicators and credit operations of PACS are given in Appendix 2.72 & Appendix 2.73.
Consumer Co-operatives
2.139 These societies act as principal agents in the public distribution system by providing essential and consumer articles to the general public at a reasonable rate. Consumer Cooperatives in the State comprises of the Kerala State Consumers Federation at the State level, 14 District Wholesale Cooperative stores and 643 Primary Consumer societies at the Primary level. The District whole sale stores and primary stores cater to the needs of the consumer through their own outlets, super markets, and departmental stores. The Kerala State Cooperative Consumer Federation is engaged in the wholesale business of textile goods, groceries and stationary items as well as retail business. In addition to this there are various school and college cooperative stores catering to the needs of the students.
2.140 Triveni super markets were started to save the public from the exploitation by middlemen and as of now there are 268 Triveni Super markets with 134 mobile Triveni units, 7 floating triveni super stores, 8 Triveni Coffee houses and 1 unit of Triveni Noon meal scheme.
2.141 Another major project started was to run Nanma Stores in Panchayath and Municipal Wards having no such stores. The scheme aims to distribute 10 items of essential commodities at subsidised rates through the network of 2180 Retail Outlets. 1311 of them are run by selected Co-operative Societies and 869 by the Triveni Wing of Federation. Here the items are sold at prices at least 20 per cent lower than market rates.
2.142 Neethi Scheme for distributing consumer goods at lowest prices, Nanma stores –to distribute 10 items of essential commodities at subsidized rates through network of 2180 retail outlets, Neethi medical stores –providing medicines at subsidized rates, Triveni notebooks-manufacture and sale of note books are other schemes under consumer cooperatives.
SC/ST Co-operatives
2.143 Scheduled Caste/Scheduled Tribes Co-operatives are organized and established for the socio-economic development of the Scheduled Caste and Scheduled Tribes in the State. At present there are 752 scheduled caste co-operative societies and 129 scheduled tribe co-operative societies in Kerala, of which 315 and 54 respectively are satisfactorily working. An apex institution of Primary SC/ST Co-operatives called Kerala State Federation of Scheduled Caste and Scheduled Tribe Co-operatives was also established. 545 Scheduled Caste Co-operatives Societies and 99 Scheduled Tribe Co-operative Societies are affiliated to this federation.
2.144 For the revival of Scheduled Caste/Scheduled Tribes societies an amount of ₹.600 lakhs was provided during 2014-15 as share and subsidy.
Marketing / Processing Co-operatives
2.145 The co-operative marketing societies in the State have two tier structure, Apex societies at the State level and Primary societies at the base level. There are 3 Apex marketing federations in the State. 1) Kerala State Co-operative Marketing Federation Ltd. (Marketfed) 2) Kerala State Co-operative Rubber Marketing Federation Ltd. (Rubbermark) 3) Kerala State Kera Karshaka Sahakarana Federation (Kerafed).
2.146 567 Primary marketing and 36 Processing co-operatives are at the base level. For the revival of existing processing units, Government / National Cooperative Development Council (NCDC) are giving financial assistance, to the co-operative marketing societies in the form of share, loan and subsidy for marketing & processing activities.
ICDP
2.147 The Integrated Co-operative Development Project (ICDP) with NCDC assistance was successfully implemented in all 14 districts of the State. The second phase of ICDP in Wayanad district was completed in March 2013. Idukki district is implementing the second phase of ICDP at a block cost of ₹61.24 crores. During 2014-15, the second phase of ICDP was sanctioned for Palakkad district with a total outlay of ₹61.93 crores and NCDC assistance of ₹59.74 crores.
Miscellaneous Co-operatives
2.148 In addition to these there are miscellaneous cooperatives which consist of vanitha cooperatives, housing cooperatives, hospital cooperative societies and educational, cooperatives. Out of these the one functioning well are the hospital cooperative societies with 98 hospitals, 6987 beds 939 doctors and 4834 paramedical staff including nurses. During the year under review 483595 patients were treated as in-patients and 4338748 patients were treated as out-patients in these medical institutions.
Issue of Kissan Credit Card loans
2.149 During the year, 2014-15 District Co-operative Banks have issued 23412 Kissan Credit Cards through PACS and the total number of cards issued by the Co-operative Societies comes to 7,67,768 with a total loan outstanding amounting to ₹.2485.32 crores.
Deposit Mobilisation Campaign by Co-operative Societies
2.150 Deposit Mobilisation campaigns by co-operative credit institutions continued during the year also. During the period under review, the co-operatives could mobilize ₹6232 crore as against the target of ₹6000 crores, while in the previous year it was ₹6674 crores. Year wise target and achievement is given in Appendix 2.74.
Support by National Cooperative Development Corporation
2.151 NCDC (National Cooperative Development Corporation) has disbursed a cumulative financial assistance of ₹5993.089 crore for various cooperative development projects as on 31.3.2015, of which ₹1524.68 crores is through State government and ₹4468.40crores is via direct funding. Also, ₹1480.35 crores comes under long term loan and only ₹44.73 crores comes under subsidy, ₹4468 crores comes under working capital. Types of NCDC Assistance are shown in Appendix 2.75. During fiscal 2014-15, Kerala stood 3rd in all India standing for disbursement of NCDC’s financial assistance to states. Sanctions and release of NCDC funds to the State for 2013-14 was ₹907.05 crore and ₹ 555.09 crores respectively which comes to the tune of 12.67 per cent of the total sanctions and 10 per cent of the total releases made by the NCDC country wide. Cumulatively131 cooperatives in Kerala have benefitted by NCDC funding through State Govt /Direct funding scheme during 2014-15 either through sanctions/ disbursement of funds. Almost all sectors of Agriculture& allied activities including short term agriculture credit, marketing of agriculture produce, distribution of fertilisers & inputs, consumer cooperatives, processing activities, storage/ go downs, infrastructure creation, service sector, industrial cooperatives, labour cooperatives and weaker section programme like fisheries, SC/ST etc. were covered by NCDC finance in the State during 2014-15.
2.152 Activity wise and year wise sanction and release of assistance from NCDC are shown in Appendix 2.76. The year wise amount released by NCDC from 1991-92 to 2012-13 and type of NCDC assistance are given in Appendix 2.77. The interest rate of NCDC loan is ranged from 10.40 per cent to 12.5 percent in 2014-15. The interest rate of NCDC loan is one of the highest rates reported. Reduction in rate seems to be essential to avail more support from NCDC.
Agricultural Finance
2.153 At the national level, agriculture credit flow has consistently exceeded the target set by the government for the general banking sector and commercial banks. During 2014-15, ₹8,40,643 crore (provisional) credit was disbursed to the agriculture sector, against a target of ₹8,00,000 crore. Out of this Commercial banks accounted for the highest share of 71 per cent, co-operative banks and RRB disbursed 17 per cent and 12 per cent respectively. For 2015-16 Agriculture credit target has been enhanced to ₹8,50,000 crores.
2.154 The following measures were taken in 2014-15 for improving agricultural credit flow and bringing down the rate of interest on farm loans: (1) Farmers were eligible to avail crop loans up to a principal amount of ₹3,00,000 at 7 per cent rate of interest. However, the effective rate of interest for farmers who promptly repay their loans was reduced to 4 per cent in 2011-12. This benefit was continued in 2014-15 also. (ii) Benefit of interest rate subvention made available to small and marginal farmers having KCCs for a further period upto six months (post-harvest ) at the same rate as available to crop loan against negotiable warehouse receipts (NWRs) in order to discourage distress sale of crops by farme₹ Other farmers have been granted post- harvest loans against NWRs at the commercial rates. (iii) In order to provide relief to farmers on occurrence of natural calamities, interest subvention of 2 per cent will continue to be available to banks for the first year on the restructured loan amount on account of natural calamities and such restructured loans will attract normal rate of interest from the second year onwards as per the policy laid down by Reserve Bank of India (RBI).
2.155 The Interest Subvention Scheme for short- term production credit (crop loans) which was started by the Government of India in 2006-07 was extended to private-sector banks from 2013-14. Presently the total number of loan accounts stands at 5.72 crore. Studies conducted by the RBI and National Bank for Agriculture and Rural Development (NABARD) indicate that the crop loans are not reaching intended beneficiaries and there are no systems and procedures in place at several bank branches to monitor the end-use of funds. According to NSSO 70th round data, as much as 40 per cent of the finances of farmers still comes from informal sources, despite an increase in the flow of institutional credit to agriculture in recent years. Usurious moneylenders account for a 26 per cent share of total agricultural credit. Inadequate targeting of beneficiaries and monitoring/supervision of the end-use of short-term crop loans for which interest subvention scheme is applicable and decline in long-term/investment credit to agriculture are issues that need to be addressed on priority basis.
2.156 In Kerala, the outstanding advances to agriculture sector in the State stood at Rs.57656 crores in March 2015 showing an increase of Rs. 8844 crores compared to March 2014. Also the percentage of agriculture advances to total advances showed a marginal decrease from 26.06 per cent in June 2014 to 24.93 per cent in June 2015, though it is significantly higher than the mandatory norm of 18 per cent fixed by RBI.
2.157 In 2014-15, 9.3 per cent of the outstanding agriculture advances was contributed by Cooperative Banks, 10 per cent by Regional Rural Bank (RRB) and the rest 80 per cent by Commercial banks. The share of Cooperative Banks in the number of accounts is mere 7.8 per cent while that of commercial banks is 73.5 per cent and that of RRBs 18.6 per cent. Details of agency wise annual credit flow to agriculture in Kerala (2009-10 to 2012-13) are given in Appendix 2.78.
The Extent of Indebtedness
2.158 The All India Debt and Investment Survey conducted by the NSSO provides insights on the various dimensions of farmer indebtedness in India. This section is devoted to an analysis of their key results and for a comparison with the results of previous survey conducted by NSSO in 2002. In 2002, 48.6 percent of the agriculture households were indebted while in 2014 the figure was 52 percent, implying an increase in the proportion of indebted households.
Fig 2.14
The share of institutional and non-institutional agencies in outstanding debt of cultivator households – AIDIS 2002 and 2014
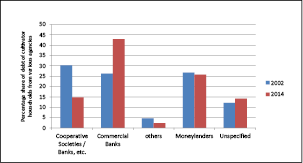
.Source: NSSO 59th & 70th Round
2.159 In terms of debt of cultivator households from different sources, the share of institutional sources has further declined to 59.8 per sent from 61.1 percent over the last one decade. Among the institutional sources, the share of Cooperative societies has fallen and that of commercial banks has increased. But the shares of money lenders have remained more or less the same accounting for as much as one fourth of the total outstanding debt of cultivator households . This, infact, is a matter of concern that inspite of all the efforts made for the spread of institutional finance it accounted for only two thirds of the farmers’ outstanding debt. The efforts towards the institutionalization of rural credit in order to replace informal agencies which charge exorbitant rates of interest have not materialized.
2.160 In Kerala, around 49.5 per cent of the agriculture households were indebted, in contrast to 52 per cent at the national level. Not only has the Incidence of Indebtedness (IOI) increased from 39.4 in 2002 to 49.5 in 2014, it is one among the highest in the country. This high incidence of debt could be because of factors like concentration on cash crops, higher value of assets per household and good network of credit of both formal and informal agencies. The average amount of debt is Rs.1,47,402, the highest in the country showing a tremendous increase from 19,633 in 2002. Also the average amount of outstanding loan seems to increase with the increase in farm size, it being the highest for the largest farm size. To sum up, high IOI, high average Amount of Debt (AOD), high outstanding amount of loan per farmer, high Debt Asset Ratio (DAR) of large number of accounts are some of the key issues.
Kissan Credit Cards
2.161 The Kissan Credit Card (KCC) scheme is one major instrument through which credit was disbursed by various agencies in the State. As per the State Level Bankers Committee (SLBC), 95878 Kisan Credit Cards with an amount of Rs.1236 crores have been issued during the first quarter of the current fiscal by the banking sector in the state. As on June 2015, the outstanding number of loan accounts under KCC is 15,70,153 with Rs.12311 crores. 667515 farmers were covered under Personal Accident Insurance Scheme (PAIS) linked to KCC. The report of the Committee on Medium term Path for Financial Inclusion has recommended further strengthening of KCC by including higher flexibility for prompt repayment, support for organic certification under KCC etc.
Investment Credit
2.162 Although overall credit flow to the agriculture sector in India has increased over the years, the share of term loan in Agriculture credit or investment credit declined from 39.3 per cent in 2004-05 to 19.5 per cent in 2013-14. But bucking the trend, 2014-15 witnessed an increase in the share of term loan to 24.3 per cent from 19.5 per cent in 2013-14, depicting a growth rate of 47.5 per cent.
2.163 In Kerala also, starting from 2000, the share of production credit (which accounts for major portion of the credit) in the total agricultural credit has been going up whereas the share of investment credit has come down from 21 per cent in 1999-2000 to 11% in 2011-12. (It has picked up albeit marginally to 13 per cent in 2012-13 ). This is not favourable for accelerating agricultural growth. A balance between short term and long term investment credit ought to be brought in to maintain sustainable agricultural growth. Since investment credit is a major driver of private sector capital formation in agriculture, a persistent decline in its share and the fact that its growth trend is lower than that of crop loan raises concerns above sustainable growth in agriculture production and productivity. The declining share of investment credit indicated that farmers seem to borrow more short term credit in order to meet their input needs to maintain continuity in agricultural operation and do not pay adequate attention to capital formation for agriculture. Lack of landed property for collateral and the fragmented size of holdings, lack of bank wise targets, lack luster performance of long term cooperative credit societies as well as lack of interest rate subvention for investment credit could be reasons for low investment credit in the State. The Working Group to revisit the existing priority sector level guidelines constituted by RBI in 2015 also raised concern regarding long term credit in agriculture, since investment credit is the major driver of private sector capital formation in agriculture.
Table 2.5
Production and Investment Credit to agriculture in the State
(Rs.. in crores)
Year |
Production credit |
Investment credit |
Total |
2008-09 |
14605 (78%) |
4224 (22%) |
18836 |
2009-10 |
18817 (78%) |
5307 (22%) |
24124 |
2010-11 |
23512 (82%) |
5141 (18%) |
28653 |
2011-12 |
30405 (89%) |
3901 (11%) |
34306 |
2012-13 |
32651 (87%) |
5059 (13%) |
37710 |
Source: State Level Bankers’ Committee
Priority sector lending
2.164 Agriculture is one of the employment intensive sectors of the economy, and as such a sub-target of 18 per cent of ANBC (Adjusted Net Bank credit) is prescribed for priority sector lending inorder to ensure adequate credit flow to this sector. While there have been concerns about non-adherence to this target by banks in general, a further disaggregated analysis shows that only about one fourth of total agricultural credit is going to small and marginal farmers (RBI 2012) Importantly, 13.6 per cent of total agricultural credit was absorbed by corporate, partnership firms and institutions engaged in agriculture, as on the last reporting Friday of March 2011. Data on credit to micro and small enterprises also revealed a bias in favour of relatively bigger enterprises. Thus, within the priority sectors, especially within agriculture and micro and small enterprises, majority of loans are concentrated in relatively larger accounts. There is a need to change credit concentration within the priority sector in order to further facilitate the process of inclusive growth. (Report on Trend and Progress of Banking in India, RBI, 2011-12).
2.165 With regard to priority sector lending in Kerala commercial banks have shown an impressive record in the last decade. From 42 per cent in 1992 and 2000, the share of priority sector advances to total advances has jumped to nearly 60 per cent in 2014. As on March 2015, the total advances outstanding under priority sector was ₹.1,28,656 crore out of which advances to agriculture was to the tune of ₹.57,656 crore (44.8 per cent ). The banking sector in Kerala has consistently over achieved the targets by advancing 59.14 per cent for the priority sectors in 2014-15 Also within the priority sectors, advances to agriculture is 25.42 per cent while target is just 18 per cent . This has happened after a drastic fall in the nineties when it fell from 16.1 per cent in 1992 to 13.9 per cent in 2000. Moreover, one more positive aspect is that the advances in agriculture have exceeded the targets consistently for the last five years .
2.166 However, the definition of priority sector has undergone a significant change over the years by including housing, education and export credit in addition to agriculture and micro& small enterprises. Moreover, as per the recommendations of the committee constituted by RBI under the chairmanship of Shri. M V Nair to reexamine existing classification on Priority Sector Lending the RBI has revised the guidelines for Priority Sector Lending. Following important activities among others come under Priority sector as per the revised guidelines: Loans to corporates including farmers’ producer companies of individual farmers, partnership firms and co-operatives of farmers directly engaged in Agriculture and Allied Activities, Loans up to Rs.5 crore per borrower to dealers /sellers of fertilizers, pesticides, seeds, cattle feed, poultry feed, agricultural implements and other inputs for agriculture and allied activities, Loans for setting up of Agri-clinics and Agribusiness Centres. Bank loans up to ₹.5 crore per unit to Micro and Small Enterprises engaged in providing or rendering of services and defined in terms of investment in equipment under MSMED Act, 2006, loans to individuals for educational purposes including vocational courses upto ₹.10 lakh for studies in India and ₹.20 lakh for studies abroad, Loans to individuals up to ₹.25 lakh in metropolitan centres with population above ten lakh and ₹.15 lakh in other centres for purchase/construction of a dwelling unit per family, Loans for food and agro processing units etc. However, it has to be ascertained whether this has led to the dilution of the concept of priority sector by overestimating credit flows to actual agricultural operations and also, whether the overachievement of targets in recent years is mainly due to the inclusion of the specific items.
2.167 Meanwhile, though public sector banks among the commercial banks have succeeded in achieving the target, private sector banks have failed to meet the same. Also, even though the guidelines does not stipulate any target for the cooperative banks, they too should be encouraged to spend more on agriculture as its is they who cater to largely small and marginal farmers.
2.168 Further a change in definition and approach on priority sector lending is proposed by an internal working group of RBI in 2015, the salient recommendations of which are given in the box below.
Box 2.4
Report of the Internal Working Group (IWG) to Revisit the Existing Priority Sector Lending Guidelines
Major Recommendations:
• The target for lending to the redefined priority sector retained uniformly at 40 per cent of ANBC or Credit Equivalent of Off-Balance Sheet Exposure (CEOBE), whichever is higher, for all scheduled commercial banks. • Foreign banks (irrespective of number of branches they have) also to be brought on par with domestic banks and the same target/ sub-targets may be made applicable to them. Foreign banks with 20 and above branches may be given time up to March 2018 in terms of extant guidelines and submit their revised action plans. Other foreign banks i.e. with less than 20 branches, may be given time up to March 2020 to comply with the revised targets as per action plans submitted by them and approved by Reserve Bank of India (RBI).
Agriculture
• Shift of focus on ‘credit for agriculture’ from ‘credit in agriculture’. Hence , though target of 18 per cent retained , the approach and thrust re-defined to include (i) Farm Credit (which will include short-term crop loans and medium/long-term investment credit to farmers) (ii) Agriculture Infrastructure and (iii) Ancillary Activities and on-lending • Target to be reset every 3 years depending on the function of three variables viz., contribution of agriculture to the GDP, employment and number of credit accounts. • Agri-processing, presently included in MSE Sector, is proposed to be brought into agriculture fold. • Considering the needs of small and marginal farmers and based on their share in the operating area , within the agricultural target of 18 per cent of ANBC, a sub-target of 8 per cent of ANBC is recommended for small and marginal farmers, which may be achieved in a phased manner within a period two years i.e., 7 per cent by March 2016 and 8 per cent by March 2017 • A target of 7.5 per cent of ANBC for lending to micro enterprises to be achieved in stages i.e. achieve 7 per cent by March 2016 and 7.5 per cent by March 2017 Source : RBI 2015
Refinance Support by NABARD
2.169 In Kerala the total refinance disbursement from NABARD was ₹.1731.15 crores in 2014-15 as against ₹.2460.31 crores during 2013-14. Contrary to previous years, KSCARDB accounted for the highest share of 66.71 percent in the total refinance disbursed in the State in 2014-15, as against commercial banks which accounted for the highest share in 2013-14. This was followed by RRBs (17.76 per cent ) and finally by Commercial banks (15.53 per cent ) in 2014-15. Agency wise and purpose wise disbursement of refinance assistance by NABARD in Kerala is given inAppendix 2.79 and Appendix 2.80 & 2.81.
2.170 The purpose-wise analysis of the refinance by NABARD reveals that, the major share of assistance was availed by non-farm sector (75.94 per cent ) followed by land development (7.12 per cent ) and plantation and horticulture sector (5.85 ). Other major schemes which availed refinance support was minor irrigation, SHGs, dairy Development etc. The sectors like fisheries and poultry, which are very important for the rural economy of Kerala, were neglected since 2012-13 from the disbursement of refinance by NABARD.
Rural Infrastructure Development Fund (RIDF)
2.171 The RIDF was set up in NABARD with contribution from the Commercial banks which were not able to fulfill the commitment of channelising at least 18 per cent of their total lending to agriculture. RIDF has been instrumental in strengthening the rural infrastructure in the State. From RIDF I to XX total sanction and disbursement stands ₹.2,12,451crores and ₹.1,47,991 crores respectively as on 31-03-2015 in India.
2.172 Kerala has been receiving assistance under RIDF for the last fifteen years. The major projects for which RIDF has been disbursed include watershed development projects, rural bridges, rural roads, reclamation of waterlogged area, inland navigation, tourism oriented roads and rural market yards. In Kerala the cumulative sanction and disbursement as on 31-03-2015 was ₹.7459.42 crores and ₹.4192.62 crores respectively. During the XX tranche an amount of ₹.1200.57crores was sanctioned and ₹.199.94 crores was disbursed. The tranche wise sanction and disbursement under RIDF are shown in Appendix 2.82.
Section 8
Rural Development Programmes
2.173 Rural development programmes in Kerala are either Centrally Sponsored Projects or schemes and projects implemented by local bodies. A number of centrally sponsored schemes are being implemented in rural areas through the State Government for poverty reduction, employment generation, rural infrastructure development and provision of basic minimum services. A brief review of the financial and physical details of the Schemes are given below.
Mahatma Gandhi National Rural Employment Guarantee Scheme (MGNREGS)
2.174 The financial achievement under MGNREGS during 2014-15 was ₹.1617.99 crore and the total employment generated during the year was 5.88 crore mandays. The physical and financial progress of the programme in 2014-15 and financial and employment details of MGNREGS upto September 2015 is given in Appendix 2.83, 2.84, 2.85 & 2.86.
Indira Awas Yojana (IAY)
2.175 Indira Awaas Yojana (IAY) is the biggest and most comprehensive rural housing programme ever taken up in the country. It is a Centrally Sponsored Scheme of the Ministry of Rural Development which provides dwelling units to the homeless Rural Poor belonging to the BPL category. The programme is implemented through the Block Panchayats.
2.176 The unit assistance under IAY, fixed by Government of India, with effect from 01.04.2013, is ₹.70000 in plain areas and ₹.75000 in hilly/difficult areas and this has been shared by the Centre and the State in the ratio of 75:25 upto 2014-15. From 2015-16 onwards, funding pattern has been changed to 60:40.
2.177 The State Government has enhanced the unit cost to ₹.2 lakh for General Category, ₹.3 lakh for SC Category and ₹.3.5 lakh for ST Category. The additional amount over and above the unit cost fixed by the Government of India is being met by Grama-Block-District Panchayats in the ratio of 25:40:35. As the three tier panchayaths are not in a position to meet the additional amount, State Government has decided to provide ₹.75000 per house to all categories during the year 2012-13 and ₹.50000 during 2013-14, 2014-15 and 2015-16. During 2014-15, 51261 houses were sanctioned. The number of houses completed (including spillover liability) is 50545 (50264 new houses & 281 under upgradation scheme). Distributed among SC, ST, Minority and Others as 18797, 3668, 12779 and 15301 respectively.
2.178 Financial and physical achievements of IAY up to October 2015 are shown in Appendix 2.87 & 2.88.
Rural Infrastructure Development – Pradhan Mantri Gram Sadak Yojana (PMGSY)
2.179 PMGSY is a 100 per cent Centrally Sponsored Scheme to build rural infrastructure with the objective of facilitating a higher degree of rural – urban integration and for achieving an even pattern of growth for the poor and disadvantaged sections of the society. The spirit and the objective of PMGSY is to provide good all-weather road connectivity to the unconnected habitations. The Kerala State Rural Roads Development Agency (KSRRDA) is the nodal agency for implementation of the programme in the State.
2.180 Government of India funds is utilized for the actual estimated cost of construction of roads under the scheme. The State government supports PMGSY for meeting tender excess, shifting of utilities and maintenance provision for assets already created by including them in the State budget from the financial year 2010-11. During 2014-15, an amount of ₹.190.59 crore (including opening balance) was expended and 118 roads were completed (345.75 Kms).
2.181 The financial and physical achievements of PMGSY are shown in Appendix 2.89.
Integrated Watershed Management Programme ( IWMP)
2.182 Integrated Watershed Management Programme (IWMP) is one of the flagship programmes of Government of India, which aims at sustainable development and conservation of natural resources. From 2015-16 onwards, the Government of India has approved a new scheme called Pradhan Mantri Krishi Sinchai Yojana (PMKSY) (Watershed Component). Rain water conservation, construction of farm pond, water harvesting structures, small check dams and contour bunding etc. are included under this programme. An amount of ₹.72.27 crore was expended during 2014-15. Details are given in Appendix 2.90.
Swachh Bharat Mission (Gramin)
2.183 With effect from 02.10.2014, Nirmal Bharat Abhiyan has been restructured and renamed as Swachh Bharat Mission (Gramin), which aims at attaining a 100% Open Defecation Free India by 2019.
2.184 The main objective of the Swachh Bharat Mission (Gramin) are:- to bring about an improvement in the general quality of life in the rural areas, by promoting cleanliness, hygiene and eliminating open defecation; accelerate sanitation coverage in rural areas to achieve the vision of Swachh Bharat by 2nd October 2019; motivate communities and Panchayati Raj Institutions to adopt sustainable sanitation practices and facilities through awareness creation and health education; encourage cost effective and appropriate technologies for ecologically safe and sustainable sanitation; and develop where required, community managed sanitation systems focusing on scientific solid & liquid waste management systems for overall cleanliness in the rural areas.
2.185 Under Swachh Bharat Mission (Gramin) construction of 1108225 individual household latrines were completed as on 31st March 2015. Out of the total 144323 latrines were of APL families, 1184 Community Sanitary Complexes, 49,389 school toilets, 5154 Anganwadi Toilets and 91 Rural Sanitary Marts and Production Centre. 959 Grama Panchayats have received the National Award of Nirmal Gram Puraskar (NGP) till 2013 consequent to their effort in eliminating open defecation, providing toilet facilities for all households, schools and anganwadis and creating a neat and clean environment in the Panchayats. The NGP has been discontinued with effect from 6-11-2015.
Kudumbashree Mission and Alleviation of Poverty
2.186 Kudumbashree is a holistic, participatory, women oriented innovative overarching poverty reduction approach launched in the State during 1998-99. ‘Kudumbashree’ envisages prosperity of the economically backward families in the State with multiple programmes that will provide them information, create awareness, build up their capability and capacity, enhance their confidence and show them opportunity for better social security and empower them physically, socially, economically and politically. Kudumbashree has altered lives of economically backward women in the State, changed their perception, built their confidence, boosted their morale, rediscovered their dignity and honor, and empowered them economically, socially and politically across political ideologies and religious faiths.
2.187 The Community Based Organizations (CBOs) of Kudumbashree encompass 40 lakh families networked into 2.59 lakhs Neighborhood Groups, which is federated in to 19875 Area Development Societies and 1072 Community Development Societies. The three tier Community Based Organisations (CBOs) of poor women provide an effective platform for converging various anti poverty programmes of the State and Central Governments. Various other agencies involved in poverty reduction, such as NABARD, financial institutions, welfare boards and other autonomous agencies and departments are also utilizing this platform for the effective implementation of their programmes.
Strategy
• Identification of poor families using a non-monetary poverty index.
• Organizing the poor in a 3 tier Community Based Organization (CBO).
• Empowerment of women through Community Based Organisations.
• Formation of Informal Bank of Poor women operating round the clock throughout the year, starting from thrift & credit operations.
• Formation of micro-enterprises.
• Convergent Community Action.
• Strong liaison with LSGs.
• Intervention in Anti Poverty Sub Plan, Women Component Plan, Local Economic Development of local self governments.
• Community monitoring mechanism for local development.
2.188 Some of the Poverty reduction programmes of Kudumbashree Mission are given below:-
Linkage Banking
National Bank for Agricultural and Rural Development (NABARD) SHG- Bank linkage grading procedures are applied while selecting eligible NHGs for availing loans. Banks will provide loans to those NHGs who acquire 80 per cent marks in grading. Under this scheme ₹.1280 crore has been mobilized and 52397 NHGs have availed the loans during 2014-15. The details of Linkage Banking are given in Appendix 2.91.
Thrift and Credit Societies facilitate easy and timely credit to the unreached. The total thrift collected by NHGs in the State comes to ₹. 3094 crore and the internal loans generated are to the tune of ₹.12683 crores. The details are given in Appendix 2.92.
Matching Grant is an incentive provided to NHGs and linked to amount of thrift mobilized, performance of NHG in the Grading and loan availed from Banks. An amount of 10% of the thrift of the NHG subject to a maximum of ₹. 5000/- is provided as Matching Grant to each NHG. An amount of ₹.422.14 lakh has been provided as matching grant during 2014-15.
Interest subsidy scheme - NHGs can avail bank loans at 7% and the remaining interest amount will be treated as interest subsidy. This support is only upto the loan amount of ₹.1 lakh. An amount of ₹.455.49 lakh was provided as interest subsidy during 2014-15.
Micro Enterprises Activities
Micro enterprise promotion and development is one of the livelihood programme where women of Kudumbashree Neighbourhood groups are encouraged to start enterprises based on their skill and aptitude. It also provides necessary handholding support for the women for the identification of viable livelihood opportunity available in the locality, necessary training, financial assistance and marketing support.
Yuvashree as part of promoting self employment among unemployed youth, helped unemployed youth to start enterprises.
Financial Literacy campaign- conducted two campaigns in each of the 1072 Community Development Societies (CDSs) with the support of Banks, government departments and NABARD.
Tribal special project is an initiative of Kudumbahree in collaboration with the Tribal Department to address the special issues of the tribal population of the State, in a systematic manner. The project primarily targets at bringing the marginalized tribals under the aegis of the Kudumbashree network and provide them with facilities which were otherwise less accessible or denied, as part of its poverty eradication mission.
Collective Farming is an initiative to encourage cultivation by neighbourhood groups. It not only brings in significant changes in the lives of the poor but also helps to increase agricultural production by bringing fallow and cultivable waste land into agricultural use, and has significance as a food security measure.
Major initiatives
Ashraya is an initiative that rehabilitates destitute families and integrates them with mainstream of the civil society. The specific objectives include provision of food for starving, land for home, shelter to the homeless, infrastructure to support for the destitute through medical and care service, educational facilities to children and pension support and income generation activities.
BUDS (Programme for Intellectual Disability) has been started to set up model special schools for physically and mentally challenged children under the leadership of Local Self Government and cater to the developmental, social, and emotional needs of the children whose needs were formerly ignored or neglected. So far 62 BUDS schools and 83 BUDS Rehabilitation Centers have come up in the State.
Balasabha is a structured neighbourhood network of children. The prime objective of constituting Balasabhas is to prevent inter-generational transmission of poverty through capability enhancement of children. Small Learning Groups for experimental and systematic learning, opportunities for understanding democratic process, participation in conserving environment, enabling children to unfold the intricacies of collectivisation are the basic focal points of Balasabha. The details are given in Appendix 2.93.
Balapanchayats have been formed in gramapanchayats with the support of UNICEF initially. Kudumbashree initiatives of Balasabha and Balapanchayaths enable to impart voice, face and power to children hailing from poor and vulnerable socio economic backgrounds. The idea behind the Bala Panchayath is the creation of a children’s forum where children’s issues and concerns can be bought to the notice of local development planners- i.e. the Local Self Governments. One such interface has been that of local environmental audits conducted by the children of Kudumbashree.
Gender Self Learning
It aims to create awareness about the rights, status and justice of women by themselves through the discussions of their experience, identify their role in the local development process and equip women to recognize their rights, equality and violence against them. Major gender self learning programme initiatives are given below.
1. Gender Corner
2. Snehitha Gender Help Desk
3. Sreesakthi – The Web Portal
4. Crime Mapping
5. Anti Human Trafficking (AHT)
Samagra Projects is an initiative independently developed by Kudumbashree and being implemented in the State in collaboration with the three tier local self governments and other agencies. It is an attempt to address the entire production – supply value chain holistically, by scaling up productive activity both qualitatively and quantitatively and seeking viable supply opportunities. Some of the Samagra Projects that are implemented in various districts are given below.
1. Kannur Goat Farmers Producer Company
2. Nedumkandam Ksheerasagaram Producer Company
3. Kasargode Saphalam Cashew Project-Collective
4. Gramashree Ornamental Fish Producers Collective in Vaikom Block of Kottayam
5. Unnathi Society of IT Enterprises
6. Amrutham Society of Nutrimix Entrepreneurs
2.189 Kudumbashree is a nodal agency for various centrally sponsored programmes. Some of the major programmes for reducing poverty under Rural Development Sector are described below.
National Rural Livelihood Mission (NRLM)
NRLM seeks to provide self/wage employment opportunities for the rural poor through Self Help Groups. The core objective of the programme is to establish micro-enterprises covering all aspects of self employment viz, organization of the rural poor into self-help groups and their capacity building, planning of activity clusters, infrastructure build up, technology, credit and marketing.
Deen Dayal Upadhyaya Grameen Kaushalya Yojana (DDU GKY)
‘DDU GKY (erstwhile Aajeevika Skills)’, the skill and placement initiative of the Ministry of Rural Development (MoRD) is a significant initiative which aims at skilling poor rural youth and providing them with jobs in the organized sector.
Implementation of different Rural Development Schemes and the initiatives taken by Kudumbashree have helped the poor to improve the quality of life in the State. While MGNREGS has generated sizable employment in rural areas, Swachh Bharat Mission (Gramin) has helped to improve sanitation facilities in rural areas. However concrete efforts have to be taken to sustain the present achievements and to improve the standard of living in Rural Kerala.
.
Section -9
Food security
2.190 The World Food Summit of 1996 defined food security as existing when all people at all times have access to sufficient, safe and nutritious food to maintain a healthy and active life. Public Distribution System (PDS) assures food security to people, particularly to Kerala, a State which has a very high deficit in production of food grains; Kerala produces only 15 per cent of its requirement. Necessarily, PDS has a critical and functional role in Kerala.
2.191 Public Distribution System was launched in Kerala in 1962 with the implementation of the Kerala Rationing Order. Timely lifting of commodities allocated from the Central pool and ensuring distribution of the same through more than 14,000 ration shops and ensuring that it occurs in time and effectively is a major responsibility of the PDS. Kerala made pioneering achievements in the implementation of a Universal Rationing System. The approach to the Twelfth Five Year Plan stresses reforms to plug the leakages in the PDS such as end to end automation of the entire PDS chain, introduction of GPS tracking, activating vigilance committees and so on across the State.
2.192 Number of ration cardholders in the State reached 83.13 lakh in 2014-15 from 82.73 lakhs in 2013-14
(Appendix 2.94). Similarly number of APL cardholders also increased slightly to 62.52 lakh in 2014-15, which was 62.51 lakh in 2013-14. There are 14.78 lakh BPL cardholders in 2014-15 which was 14.81 lakhs in 2013-14. and 5.83 lakh Anthyodaya Anna Yojana (AAY) card holders in 2014-15 which was 5.85 lakh in 2013-14. There are 0.26 lakh Annapoorna card holders also.
2.193 During 2014-15 rice allotment to APL cardholders was 4.45 lakh MT and BPL card holders 4.31 lakh MT. At the same period rice allotment to AAY card holders was 2.5 lakh MT. Supply price of rice for APL and BPL from 2012-13 was ₹.8.90 and ₹.1 respectively and that of wheat is ₹.6.70 for APL and ₹.2 for BPL.
2.194 Details of distribution of rice, wheat, kerosene and sugar through PDS from 2007-08 to 2014-15 is shown in Appendix 2.95.
Food grain at ₹.2/kg and ₹.1/kg
2.195 In 2011, Government of Kerala approved a scheme for proving food grain at ₹.2/kg to all prescribed special category of beneficiaries subject to certain condition. All BPL and APL beneficiaries in the State were provided with rice and wheat at ₹.2/kg in 2014-15. Since 1st September 2011, the State Government has started to implement schemes for issuing rice at ₹.1/kg to all BPL beneficiaries in the State. Food grain distribution details under PDS for BPL and APL in 2014-15 is shown in Appendix 2.96.
Anthyodaya Anna Yojana (AAY) & Annapoorna Scheme (ANP)
2.196 The scheme is to provide 35 kg of rice per month to the poorest of the poor families under BPL and is being implemented in the State since 25-12-2001. In 2014-15, also the allotment of rice under AAY continued at the level of 250260 MT. Government. of India supplies food grains under AAY to the State at ₹.3/kg and the State Govt. in turn provides it to the beneficiaries at the subsidised rate of ₹.1/kg.
2.197 Annapoorna scheme provides 10kg of rice free of cost per month to destitute of the age of 65 years and above who are not in receipt of any of the pensions from the Govt. There are 26,800 ANP cardholders in the State as on 31.3.2015. Details of distribution of food grains under AAY and ANP schemes during 2014-15 are given in Appendix 2.97
Central Allotment of Sugar and Kerosene
2.198 Allotment of sugar to Kerala in 2014-15 was 55,255 MT and that of Kerosene, 94,077 KL. Allotment of sugar is restricted to BPL/AAY card holders.
Kerala State Civil Supplies Corporation (Supplyco)
2.199 Kerala has one of the best Public Distribution System networks in India. Kerala State Civil Supplies Corporation being the second line of Public Distribution System is instrumental in stabilising the prices of essential commodities in the State. It was set up in 1974 to provide food security to the State.
2.200 Kerala, being a consumer oriented State, controlling the undue rise in prices is not possible without a powerful public distribution system that intervenes the open market effectively throughout the year. The system ensures the distribution of essential items through Fair Price shops and Supplyco outlets to reach every person in the State.
2.201 Supplyco has its headquarters in Kochi and operates through 5 regional offices, 56 depots and many outlets. Details of outlet are given in Appendix 2.98. Retailing of Fast Moving Consumer Goods (FMCG) at lower prices, conducting special fairs for arresting the undue rice in prices during festival seasons, retailing of medicines by opening medical stores, procurement of paddy, processing and distribution of wheat and its products, acting as dealer of petroleum products like kerosene, petrol, diesel and LPG and also acting as nodal agency to implement the programmes of Government of India in the State to start Micro Biology Lab and Food Processing Unit.
Mid-day Meal Programme
2.202 Mid-day Meal Programme in schools is implemented in the State with the financial support of State Government and Central assistance. Supplyco is entrusted with the responsibility of providing commodities to mid-day meal programme in the State. The required quantity of rice is taken from Food Corporation of India. During 2014-15, the Corporation supplied 476527.79 quintals of rice, 125995.03 quintals of special rice benefiting 26.35 lakh children. The cost of the food grains is met through Education Department. Number of children benefitting from the mid-day meal programme is given in Figure 2.15 and details of supply of food grains from 2007-08 to 2014-15 is shown in Appendix 2.99.
Fig 2.15
Mid-day Meal Programme
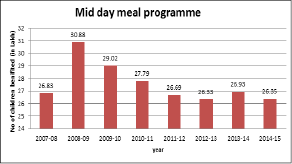
Source: supplyco
Outlook
Long term forecasting for commodity markets in an increasingly uncertain and dynamic world is a challenging job. From the short term perspective, global commodity prices are expected to remain weak in 2016 due to low international demand and comfortable supply. Prices of commodities could fall further if market rebalancing in response to recent excess supply conditions were to take longer than expected (IMF, 2015). Strengthening of domestic market, agro processing and value addition, safe to eat and organic mode of production are to be supported further to improve income of the farmers.
Expansion of commercial dairy units coupled with marketing network with farm fresh milk supply could be initiated for large scale adoption for a sustainable livestock sector in the State.