Chapter 3
INDUSTRY, LABOUR AND EMPLOYMENT
Introduction
The rising number of unemployed persons in industrialized economies and need for employment generating activities, point to the central role that productive activity and jobs have in the life of individuals and countries. Employment arises out of the efforts of entrepreneurs and governments generating new businesses and economic activities. Sustained job creation depends on the ability of an economy to innovate and generate new activities characterized by higher value addition and productivity growth.
One of the key findings of UNIDO’s Industrial Development Report 2013 is that countries need to move from lower technology to higher technology sectors, from lower value-added to higher value added sectors and from lower productivity to higher productivity sectors. The report also underlines the critical need for international cooperation to achieve the structural change and economic growth required to combat poverty.
Section 1
Manufacturing
India accounts for 1.8 per cent of the world’s manufacturing output. World manufacturing growth was 3.4 per cent in the first quarter and 3.0 per cent in the second quarter of 2014-15, according to the United Nations Industrial Development Organization’s (UNIDO) Quarterly Report on World Manufacturing Production.
3.2 At the national level, the contribution of manufacturing sector to Gross Value Added (GVA) at constant prices (2011-12) during the 1st half of 2015-16 is ₹9.64 lakh crore. At current prices, manufacturing sector registered a growth of 6.9% for the first half of 2015-16 as compared to the growth of 12.2 percent in the first half of 2014-15. As per the estimates, the share of manufacturing sector to GVA is 17.62% at current prices.
3.3 The trends in growth of manufacturing sector in India as per provisional estimate of GVA by economic activity at constant prices for a period from 2012-13 to 2015-16 (H1) is exhibited in Figure 3.1.
Fig 3.1
Growth of Manufacturing Sector in India
Source: Central Statistics Office
3.4 As per Quick Estimate of Gross Value Added (Economic & Statistics Department) the manufacturing sector of Kerala grew by 12.33 per cent at current prices during 2014-15 compared to 6.92 per cent in the previous year. At constant prices (2011-12), the sector registered a growth of 8.92 per cent in 2014-15 as against 1.97 percent in 2013-14. The share of manufacturing sector to GVA at constant and current prices during 2014-15 was 10.82 per cent and 10.19 per cent respectively. The income from manufacturing sector to GVA from 2011-12 to 2014-15 is given inAppendix 3.1.
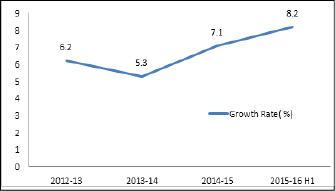
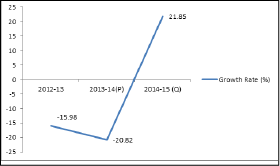
3.5 The trend in growth rate of income from manufacturing sector in Kerala on the basis of GVA at constant prices for the period from 2012-13 to 2014-15 is shown in Figure 3.2.
Fig 3.2
Rate of Growth of Manufacturing Sector - Kerala
Source: Directorate of Economics and Statistics
3.6 The income from manufacturing sector in Kerala which registered 12.47 per cent growth in 2012-13 witnessed a decline during 2013-14 (1.97 per cent) and recorded a moderate growth of 8.92 per cent during 2014-15.
Mining
3.7 India is a mineral rich country with large deposits of iron ore, barytes, rare earth and mineral salt. India produced 90 minerals, 11 metallic, 52 non metallic and 23 minor minerals in 2012-13. India was ranked 2nd in the production of Barytes, third in chromite, and coal and lignite, 5th in iron ore and steel (crude), 6th in bauxite ore, 7th in manganese ore and 8th in aluminium (crude) in the world in 2012. The number of mines in India which reported mineral production (excluding minor minerals, petroleum (crude), natural gas and atomic minerals) was 3318 in 2014-15 as against 3722 in 2013-14. The total value of mineral production (excluding atomic minerals) during 2014-15 has been estimated at ₹267637 crore as against ₹278150 crore during 2013-14.
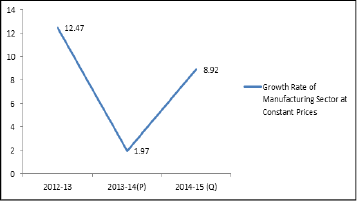
3.8 As per Provisional Estimate (PE) of Gross Value Added (GVA) at constant prices (2011-12) for 2014-15, mining and quarrying sector at national level grew by 2.4 per cent as against 5.4 percent in 2013-14.During the period April-September (H1) 2015-16, the mining and quarrying sector contributed ₹1.37 lakh crore to Gross Value Added (GVA) at constant prices. The sector grew by 3.6% as compared to 3% in the first half of 2014-15. At current prices, the sector contributed ₹1.43 lakh crore to GVA during 2015-16 (H1) with a minus growth rate of 0.1% as compared with the growth of 4.4% of 2014-15 (H1). The trend in national growth rate of Mining and Quarrying sector at constant prices is shown Figure 3.3.
Fig 3.3
National Growth Rate of Mining and Quarrying Sector
Based on GVA at Constant (2011-12) Prices
Source: Central Statistical Office
3.9 Mining and Quarrying sector at the national level showed a decline by -0.2 per cent in 2012-13, a growth of 5.4 per cent in 2013-14 and 2.4 per cent in 2014-15. In the first half of 2015-16, the sector registered a growth of 3.6 per cent.
Growth of the Mining Sector in the State
3.10 The contribution of Mining and Quarrying sector to Gross Value Added at constant prices is estimated at ₹220881 lakh during 2014-15 registering a growth of 21.85 percent compared to the previous year. The share of the sector in GVA at constant prices stood at 0.56 percent during 2014-15 as against 0.49 per cent in 2013-14.
3.11 The growth of income from the sector as per estimate of GVA at constant prices (2011-12) from 2012-13 to 2014-15 is depicted in Figure 3.4.
Fig 3.4
Growth Rate of Income from Mining and Quarrying Sector in Kerala
Source: Directorate of Economics and Statistics
3.12 There are 83 major mineral mines that are operational in the State as on 31st March 2015. During 2014-15, 87 mining leases for major minerals, 532 quarrying leases, 6222 quarry permits in minor minerals and 1549 dealers license were granted. In 2014-15 there were 188 registered metal crusher units in Kerala.
3.13 The total area covered by mining leases as on September 2015 is 2233.37 hectares of which lime shell/seashell accounts for 1350.40 hectares, mineral sand 349.77 hectares, limestone 245.69 hectares, china clay 106.1 hectares. Area covered by graphite and bauxite are 1.25 hectares and 0.72 hectares respectively. Mineral wise details of area covered by mining lease are given in Appendix 3.2.
3.14 During 2014-15, 378.07 lakh tonnes of major and minor minerals were produced in Kerala. Among major minerals,china clay tops the list with 8.89 lakh tonnes followed by limestone (4.27 lakh tonnes), bauxite/laterite (2.98 lakh tonnes) and ilmenite (1.1 lakh tonnes). Among minor minerals highest production is granite building stone (244.44 lakh tonnes) followed by ordinary earth (45.77 lakh tonnes), ordinary sand (22.41 lakh tonnes), river sand (20.51 lakh tonnes) and laterite (15.87 lakh tonnes).
3.15 During 2014-15 an amount of ₹70.6 crore was received as royalty from minerals, of which ₹13.91 crore was from major minerals and ₹56.69 crore from minor minerals. During 2014-15 highest royalty among major minerals is from limestone (₹3.05 crore) followed by bauxite/laterite (₹3.01 crore), china clay (₹2.76 crore) and ilmenite (₹1.86 crore). Among minor minerals granite building stone stands first by contributing ₹39.11 crore as royalty followed by ordinary earth (₹9.15 crore) and laterite (₹2.54 crore) during 2014-15. The production and royalty of minerals in the State during 2014-15 are given in Appendix 3.3.
3.16 District wise analysis of revenue collection shows that Ernakulam district has the highest collection of ₹11.74 crore (16.63% of total revenue) followed by Palakkad ₹8.83 crore (12.51%) and Kollam ₹6.24 crore(8.84%). The least revenue collection of ₹1.62 crore (2.29%) is from Wayanad. The district wise collection of revenue from major and minor minerals is furnished in Appendix 3.4.
Section 2
Public Sector Undertakings
3.17 In India, Public Sector Enterprises have been set up with an objective of attaining higher economic growth with self-sufficiency in the production of goods and services with long term stability in economic activities. There were 234 operating Central Public Sector Enterprises (CPSEs) in India as on March 2014 (Public Enterprises Survey 2013-14). Out of these 163 had been profit making and 71 loss making.
Central Sector Investment
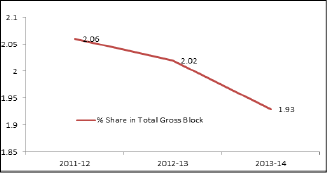
3.18 The aggregate real investment in Central Public Sector Enterprises (CPSEs) in India, measured in term ‘gross block’ increased from ₹1555575.29 crore in 2012-13 to ₹1757450.17 crore in 2013-14 registering a growth of 12.98 per cent over the previous year. Though the investment in CPSEs in the State in terms of gross block grew by 7.65 per cent from ₹31460.19 crore in 2012-13 to ₹33866.85 crore in 2013-14, its percentage share in total gross block decreased from 2.02 in 2012-13 to 1.93 in 2013-14 (Public Enterprises Survey 2013-14). State wise analysis shows that Maharashtra ranked first with the highest investment of ₹297280.93 crore (16.92%) followed by Andhra Pradesh ₹127586.55 crore (7.26.%) and Tamil Nadu ₹120155.09 crore (6.84%). Details of Central Sector Investment in Kerala from 2011-12 to 2013-14 are given in Appendix 3.5 and Central Sector Investment in selected states as on 31/03/2014 are given in Appendix 3.6.
3.19 The percentage share of investment received in Kerala from 2011-12 to 2013-14 is exhibited in Figure 3.5. It may be seen that the share of Kerala has been falling during the last three years.
Fig 3.5
Investment in CPSEs in Kerala
Source: Public Enterprises Survey 2013-14
State Public Sector Undertakings
3.20 In Kerala, there are 95 active State Level Public Enterprises (SLPEs) as on March 2014; 87 Government Companies and 8 statutory bodies. Among Government Companies 44 units were reported as profit making. As on March 2014, the total capital investment in public enterprises in the State was ₹34007.88 crore as against the investment of ₹29271.01 crore during the previous year.
3.21 Under Industries Department there are 44 SLPEs, of which 37 are in manufacturing sector and 7 in non-manufacturing/service sector. The performance trend of PSUs under Industries Department during the last 5 years is given in Appendix 3.7.
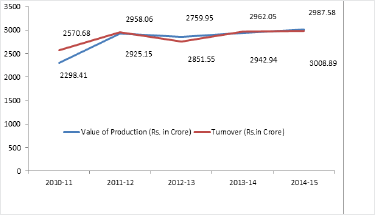
3.22 Total value of production in 44 SLPEs under Industries Department had increased from ₹2942.94 crore in 2013-14 to ₹3008.89 crore in 2014-15 registering a growth of 2.24 %, whereas their turnover grew by 0.86 percent only during 2014-15 compared to previous year. Details of PSU-wise turnover and profit/loss during 2013-14 are shown in Appendix 3.8. The performance trend of 44 SLPEs under Industries Department in terms of value of production and turnover from 2010-11 to 2014-15 is shown in Figure 3.6.
Fig 3.6
Value of Production and Turnover of SLPEs under Industries Department
Source: Public Sector Restructuring and Internal Audit Board
3.23 It may be seen that there is no significant variation in value of production and turnover for the last four years.
3.24 SLPEs under Industries Department numbering 14 reported profit during 2014-15 as against 15 in 2013-14. The profit made by them decreased from ₹108.16 Crore in 2013-14 to ₹74.5 crore in 2014-15. Major profit making units during 2014-15 are Kerala State Industrial Development Corporation Ltd (₹29.64 crore), Malabar Cements Ltd (19.28 crore) and Kerala Industrial Infrastructure Development Corporation (₹9.70 crore).
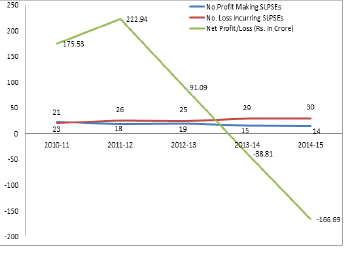
3.25 The number of loss making SLPEs had increased from 29 in 2013-14 to 30 2014-15 and the amount of loss from ₹146.97 crore to ₹241.19 crore. As a result, the net loss of SLPEs under Industries Department had increased from ₹38.81 crore in 2013-14 to ₹166.69 crore in 2014-15. Major loss making SLPEs during 2014-15 are Kerala State Cashew Development Corporation (₹33.79 crore), Transformers and Electricals Kerala Ltd. (₹27.62 crore), Kerala Minerals and Metals Ltd. (₹24.89 crore) Travancore Titanium Products Ltd. (₹24.25 crore) and Kerala State Textile Corporation Ltd.(₹24.08 Crore). Performance trend of 44 SLPEs from 2010-11 to 2014-15 is depicted in Figure 3.7.
Fig.3.7
Performance Trend of SLPEs under Industries Department
Source: RIAB
3.26 SLPEs under Industries Department which reported an increase in net profit from ₹175.53 crore in 2010-11 to ₹222.94 crore in 2011-12 witnessed a drastic decline to ₹91.09 crore in 2012-13 and then fell into net loss of ₹38.81 crore in 2013-14 and ₹166.69 crore in 2014-15. Unhealthy import of Titanium Dioxide from China, lack of modernisation and technology up gradation, tough competition from market etc adversely affected the performance of SLPEs. It is high time to initiate focussed and time bound action for bringing out drastic changes in the sector to improve the performance of SLPEs which will in turn stimulate the economic growth of the State.
Public Sector Restructuring and Internal Audit Board (RIAB)
3.27 RIAB, constituted in 1993, executes State Owned Enterprise Reform Initiatives. Major responsibilities of the agency are performance planning and monitoring of PSUs, enterprise reconstruction, capacity building / recruitments in PSUs and governance advisory support to SLPEs.
Box 3.1
Major Initiatives in PSUs during 2014-15
• As part of modernisation of PSUs, Kerala Electrical and Allied Engineering Co Ltd has initiated a Cast Resin Transformer project at its Eradikoode unit with an outlay of₹8.50 crores during the year.
• Modernisation and Expansion projects have been initiated by TRACO Cables Company Ltd,Kerala Drugs and Pharmasuticals Ltd, Steel Complex Ltd,Travancore Cochin Chemicals etc. during 2014-15.
• Keltron and its subsidiary units have initiated various development projects as part of expansion and modernisation during 2014-15 in line with Electronic Manufacturing Policy of Government of India.
• Reopened the Cherthala unit of Malabar Cements Ltd. Clinker was imported for the first time through Cochin Port and trial-run was done during this period.
• As part of performance improvements of PSUs, Performance and Audit Monitoring system have been strengthened through RIAB.
• Implementation of e-procurement with e payment system in PSUs ensured more transparency and competition in purchase.
• As part of corporate social responsibilities, PSUs have initiated various social welfare measures for the development of different sectors of the society.
Source: RIAB
Joint Stock Companies
3.28 There are 25863 Joint Stock Companies in Kerala as on March 2015, of which 24338 (94.10%) are Private Limited and 1525 (5.90%) Public Limited. Also, 1012 companies are newly registered from April to September 2015. During 2014-15, 1607 companies were newly registered (1575 Private Limited and 32 Public Limited) and 330 companies were wound up/dissolved/struck off during this period. Nine public companies were converted to private companies and 5 companies were converted from private to public. Total number of government companies as on March 2015 is 139(95 Public Limited and 44 Private Limited). Details of joint stock companies working in Kerala are given in Appendix 3.9.
Industrial Financing
Kerala Financial Corporation (KFC)
3.29 Kerala Financial Corporation has been playing a major role in industrialisation of Kerala through industrial financing. The main objective of Kerala Financial Corporation (KFC) is to promote rapid industrialisation of the State by extending financial assistance to Micro, Small and Medium Enterprises (MSME), in manufacturing and service sectors. Financial assistance is provided in the form of term loans, working capital loans and special schemes. KFC is a member of Credit Guarantee Fund Trust for Micro and Small Enterprises. Activities of the Corporation are the following.
- • Sanction of Term Loans to new Micro, Small and Medium enterprises in the manufacturing and services sector.
- • Sanction of Term Loans to existing industrial concerns and services sector units for expansion/modernisation/diversification.
- • Sanction of working capital loans to meet working capital requirements of industrial/service enterprises under special schemes.
- • Special schemes for Financial Assistance to Civil Contractors.
- • Special scheme for Financial Assistance for producing Feature Film and TV serials.
- • Special scheme for modernisation, up gradation and expansion of existing cinema theatres and establishment of new multiplexes.
- • Special scheme for purchase of laboratory equipments/waste management.
3.30 The Corporation sanctioned loan of ₹947.45 crore during 2014-15 and disbursed an amount of ₹657.09 crore in 2014-15. An amount of ₹427.52 crore was disbursed to various SSI units and ₹229.57 crore to other units during 2014-15. The Corporation reported profit (before taxation) of₹30.03 crore during 2014-15 as against ₹57.10 crore during 2013-14. Performance of KFC during the last five years is given in Appendix 3.10. The details of loan operations and industry-wise classification of loans during 2014-15 of KFC are shown in Appendix 3.11 and Appendix 3.12.
Kerala State Industrial Development Corporation (KSIDC)
3.31 Kerala State Industrial Development Corporation Ltd. (KSIDC), formed in 1961, was established for promotion and development of medium and large scale units in the State. KSIDC also plays a vital role in entrepreneurship development in the State.
3.32 KSIDC has sanctioned 11 projects involving a capital investment of ₹232.57 crores with direct term loan assistance of ₹108.76 crores in the financial year 2014-15. Out of projects sanctioned, four are in Ernakulum, three in Thiruvananthapuram, two in Alappuzha and one each in Palakkad and Malappuram districts. The new projects are expected to generate employment for 10,000 persons directly and indirectly. The Corporation has also registered ₹43.19 crores disbursement and ₹ 92.90 crores in recovery. The total income of the Corporation has come to ₹50.25 crores during 2014-15. Majority of projects financed by the Corporation during 2014-15 are from tourism and manufacturing sectors. The Corporation has also sanctioned projects in IT sector, logistics, infrastructure and agro processing sectors etc. Details of investment and employment made in KSIDC units during 2014-15 are given in Appendix 3.13. The physical and financial performance of KSIDC during 2014-15 is given in Appendix 3.14. Details of allotment of land in KSIDC Industrial Parks as on 30-9-2015 is given in Appendix 3.15.
Box 3.2
Major Projects Initiated by KSIDC
• Petrochemical Park, Kochi- to promote petroleum chemical and petrochemical investment.
• Mega Food Park ,Cherthala
• Electronic Hardware Park at Kochi – a world class manufacturing and R&D facility
for Electronic Sector.
• Life Sciences Park for setting up state-of-the-art manufacturing and R&D facility
for Biotechnology, Nano Technology, Contract Research etc.
• Titanium Sponge Project at Kollam
• Supplementary Gas Infrastructure Project
• Coconut Industrial Park, Kuttiyadi
• Organic Industrial Park, Kodungallor
• Light Engineering Industrial Park, Palakkad.
3.33 KSIDC conducted ‘Young Entrepreneurs Summit” (YES) on 12th September 2014- for promoting young entrepreneurs especially from student community focusing on sectors in which the State offers significant possibilities for entrepreneurship viz, Food Processing, Marine Processing, Life Sciences, Health care etc. The Corporation also organized Global Agro Meet along with BIOFACH INDIA-2014 at Kochi for creating common platform for farmers, processors and retailers. KSIDC has also initiated a new mission called Women Entrepreneurs Mission (WE Mission) to attract and encourage women entrepreneurship in the State and organized “WE Summit-2015”. About 1500 women entrepreneurs from across the State participated in the summit.
3.34 KSIDC has also initiated a special finance assistance scheme known as “Angel Fund/Seed Fund” to promote entrepreneurship among youth making them as job providers rather than job seekers and has made a total disbursement of ₹1.35 crore to 14 ventures as on 31st March 2015.
Kerala Industrial Infrastructure Development Corporation (KINFRA)
3.35 Development of industrial infrastructure plays a vital role in industrial development of a nation. In order to create conducive infrastructure for accelerating industrial development in the State, Government of Kerala established Kerala Industrial Infrastructure Development Corporation (KINFRA) in 1993. The corporation has been focussing on industrial infrastructure development by setting up industrial parks, townships, zones etc. The Industrial Parks developed by KINFRA have facilities like developed land or built up space, dedicated power, continuous water supply, communication facilities etc., in addition to supporting social infrastructure facilities like administrative block, bank, post office, round the clock security etc. The parks provide a ready-made manufacturing environment for easy start up of industrial units with minimum time and cost.
3.36 KINFRA has completed infrastructure development in 12 key industrial sectors with world – class infrastructure in 19 Industrial Parks, of which 9 are catering exclusively to the Small & Medium Enterprises Sector. Some of the notable achievements are the successful completion of International Apparel Park at Thiruvananthapuram, Export Promotion Industrial Park at Ernakulam, Infotainment Park and the Film & Video Park at Thiruananthapuram and Food Processing Industrial Park at Malappuram.
3.37 KINFRA has promoted investments in the State and created investment friendly climate within its Parks, contributing significantly to the State’s economy. As on September 2015, 637 industrial units have been started in the various Industrial Parks of KINFRA with total investment of₹1486.50 crore with direct employment of 25754. KINFRA has also implemented a Single Window Clearance system in all the Parks. The Single Window Clearance system operating in the Parks are helping the investors to establish their units without hassles. The details of allotments in KINFRA Industrial Parks as on 30/09/2015 are given in Appendix 3.16.
Box 3.3
Ongoing and New Projects of KINFRA
• Industrial Park, Ottappalam
• Industrial Park, Piravanthoor
• Industrial Park, Mattannur, Kannur
• Gem and Jewellery Park, Thrissur
• Spices Park, Muttom, Thodupuzha
• Nano – Tech Zone, Hi tech Park, Kalamassery
• KINFRA Business Park, Kollam
• Global Ayurveda Village, Thiruvananthapuram
• Mega Food Park, Palakkad
• Foot Wear Park, Ramanattukara
• Trade and Convention Grounds, Ernakulam
• Industrial Development Zone
• Defence Park, Ottapalam (New Project)
Source: KINFRA
Section 3
Micro Small and Medium Enterprises (MSMEs)
3.38 Worldwide, micro, small and medium enterprises (MSMEs) act as the engine of economic growth and for promoting equitable development. MSMEs play a critical role in innovation and have ability to experiment with new technologies on small scales.
India - Micro, Small & Medium Enterprises
3.39 The MSME sector in India is diverse in terms of its size, levels of technology employed and range of products and services produced. Starting from village industries, the products from the sector span to auto components, micro-processors, electronic components and electro-medical devices. MSMEs have shown a consistent growth of 11% till 2010-11, whereas growth rate was 19% in 2011-12 and 14% in 2012-13.
3.40 As per the Fourth All India Census of the MSME total number of MSM enterprises were 3.61 crore, of which 0.16 crore are registered enterprises. These MSMEs, contribute 37.5 per cent of India’s GDP, have a critical role in boosting industrial growth and ensuring the success of the Make in India programme. A number of schemes are being implemented by Ministry of MSME, Government of India, for the establishment of new MSMEs and growth and development of existing ones. These include:
(a) Prime Minister’s Employment Generation Programme,
(b) Micro and Small Enterprises-Cluster Development Programme,
(c) Credit Guarantee Fund Scheme for Micro and Small Enterprises,
(d) Performance and Credit Rating Scheme,
(e) Assistance to Training Institutions, and
(f) Scheme of Fund for Regeneration of Traditional Industries
3.41 During Twelfth Five Year Plan an outlay of ₹24,124.00 crore has been allocated for Ministry of MSME, which represents an increase of 133.53% over the XIth Five Year Plan allocation of ₹10,330.00 crore.The Ministry of MSME has been allocating outlays of ₹2251.00 crore, ₹2610.00 crore and ₹2612.51 crore for the years 2013-14, 2014-15 and 2015-16 respectively under Plan for promotion of MSMEs in the country.
The Micro, Small & Medium Enterprises Development Act, 2006
3.42 India is one amongst very few countries which has a legal framework for the MSME Sector in the form of MSMED Act 2006, as per which investment limit for Micro, Small & Medium enterprises are specified for Manufacturing and Service enterprises.
Box 3.4
Udyog Aadhaar Memorandum (UAM) a simplified registration format for MSMEs
The Ministry of Micro, Small & Medium Enterprises in September-2015 under the MSME Development Act, 2006 has notified that every MSME unit shall file Udyog Aadhaar Memorandum (UAM). This is a path breaking step to promote ease-of-doing-business for MSMEs in India as the UAM replaces the filing of Entrepreneurs’ Memorandum (EM part-I & II) with the respective States/UTs. The entrepreneurs in the MSME sector can file UAM on http://udyogaadhaar.gov.inonline, if they have an Aadhar number and will instantly get a unique Udyog Aadhaar Number (UAN). The UAM can be filed in offline mode (i.e. on paper form), with the General Manager (GM) of the concerned District Industries Centre (DIC).
MSME in State
3.43 In Kerala, the Micro, Small and Medium Enterprises (MSME) sector contributes to the process of economic growth, employment generation and balanced regional development. It has the potential to emerge as a strong, vibrant and globally competitive sector in the State’s economy. Kerala, with its excellent connectivity, communication network, availability of highly or average skilled human resources and developing industrial infrastructure, is best suited for the growth of the micro, small and medium scale enterprises.
3.44 The potential of IT industry in the MSME sector is big as the State offers best connectivity with broadband reach in almost all parts of the State. It is estimated that the share of Tier-III cities in the IT industry in India is expected to grow up from 10 per cent now to 80 per cent. Consultancy firm KPMG has suggested that the State can become an economic growth driver of the country by tapping its SME and IT sectors.
3.45 The Micro Small and Medium Enterprises sector help in industrialisation of rural & backward areas, targeting various social groups like SC, ST, Women, Youth, Physically Handicapped etc. thereby, reducing social/regional imbalances, assuring more equitable distribution of income and wealth. This sector contributes enormously to the socio-economic development of the State. As per the MSME survey & Quick Results of 4th Census, 5.62% of all India share of MSME enterprises is in Kerala.
3.46 The industries coming under this sector are handicrafts, Handloom, Khadi, Food processing industries, Garment making and Textile industries, industries related to coir/ wood/ bamboo/ Plastic/ rubber/ leather/ clay/ small scale manufacturing, electronic/electric components, etc.
3.47 The Directorate of Industries and Commerce of Government of Kerala acts as a facilitator for industrial promotion and sustainability of MSME sector and traditional industrial sector in the State with the help of Directorates of Handloom & Textiles, Directorate of Coir and Khadi & Village Industries Board. A total amount of ₹2373.74 Crore have been provided for the development of Industry and Minerals, during the first four years of 12th plan.
State Budget –2015-16- Announcements
3.48 Highlights of 2015-16 State budget announcements in industry sector are:
• Encouraging entrepreneurship in the State is one of the seven themes focused on State budget
2015-16.
• The State budget 2015-16 gives priority on new initiatives for the development of a culture of
entrepreneurship and establishment of business incubation centres to coordinate entrepreneur
promotion activities for creating more employment opportunities, in the industry sector.
• It is proposed to establish Trade Facilitation Centres in selected district industries centres to promote
trade in products like Handloom, Handicrafts, Coir etc. to enhance traditional industries sector.
Kerala Perspective Plan 2030 – Vision & Initiatives
3.49 The Mission outlined in Kerala Perspective Plan 2030 under Micro, Small and Medium Sector is “Kerala’s evolution into knowledge–driven competitive economy with spirit of entrepreneurship, innovation, social inclusion, tolerance and diversity”. The measures/schemes initiated in integration with perspective plan is shown in Box 3.5.
Box 3.5
Kerala Perspective Plan 2030 – Initiatives
Measures/Schemes initiated in integration with Perspective Plan 2030
Improving infrastructure in existing DA/DP’s, Construction of multi storied Industrial Estates & Assistance for promoting industrial area/plots in private sector
• Infrastructure investments on PPP mode
• Promoting mutual trust between government and entrepreneurs through partnerships
• Involve real world entrepreneurs
• Promote private investments
• Develop eco –friendly parks
Entrepreneur Support Scheme & Start up subsidy for creation of new employment opportunities
• Encourage technology up gradation and product innovation
• Promotion of microfinance
Business incubation Centres in Handloom, Power loom and DIC.
• Involve real world entrepreneurs
• Promote entrepreneurial learning in an informal learning environment.
• Increase visibility and emphasise the role of entreneurship in creating new jobs.
State Profile of the MSME Sector
3.50 The number of New Enterprises filed Memorandum under MSMED Part II in Kerala during the year 2014-15 was 15455, 3.05% more than that of previous year which was 14997. Out of 15455, 600 (4%) MSMEs were registered by SC, 85 (0.5%) by ST and 3735 (24%) by women. Investment on the sector increased by 7.57% to ₹238794.75 lakh from ₹222412.30 lakh in the previous year while employment generated decreased by 5% from 87789 to 83500 numbers. The value of goods and services produced in 2014-15 increased by 5.4% to ₹711975.39 lakh from₹675597.11 lakh in the previous year. The details are given in Appendix 3.17.
3.51 In Kerala, during the current year (as on 30.09.2015) 6915 new enterprises have filed memorandum with an investment of ₹157799.62 lakh to provide employment to 38280 persons. The details are given in Appendix 3.18.
3.52 As on 31.03.2015, the total number of working SSIs/MSMEs registered in Kerala is 249696. Out of the total SSIs/MSMEs, 4% were promoted by SCs, 0.7% by STs and 25% by women entrepreneurs. The total investment was ₹1673851.70 lakh while the total value of goods and services produced was ₹6444288.56 lakh which indicates an increase of 26% over ₹50848.27 lakh of previous year. The total number of employment generated was 1274385 as on 31.03.2015. The details are given in Appendix 3.19.
Performance of the Sector
3.53 Trends in investment, production & employment in MSME sector over the period from 2011-12 to 2014-15 is shown in Figure 3.8. Number of MSMEs registered for the same period is shown in Figure 3.9.
Fig 3.8
Investment, Production & Employment in MSME sector over the last 4 years
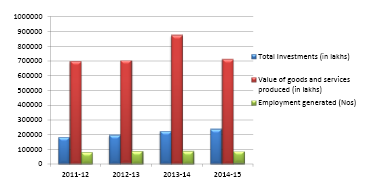
Source: Directorate of Industries & Commerce
3.54 The investment in the sector during the period from 2011-12 to 2014-15 has increased on an average by 9.8%. During 2014-15, the investment went up by 7.37% than that of the previous year. The trends shows that there was a significant increase in investment during 2013-14, ie. by 12.38% as against 2012-13. But the value of production shows an enormous increase of 25% during 2013-14 and employment generation shows an increase of 1.6%, against the previous year. The value of production and employment generation were at their peak during 2013-14. This is an outcome of the ‘self employment generation’ and ‘entrepreneur support’ programs/schemes initiated in 2012-13 by the State Government with keen focus on enhancing entrepreneurship opportunities and awareness among young skilled generation of the State, in addition to the self employment schemes of the Central Government such as PMEGP, SFURTI etc.
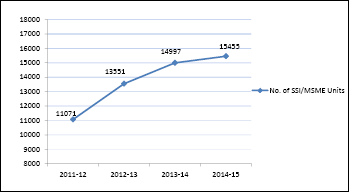
Fig 3.9
MSME units registered in MSME sector over the last 4 years
Source: Directorate of Industries & Commerce
3.55 The number of MSME units has steadily been increasing at a rate of 12.04% on an average during the period 2011-12 to 2014-15 and the total number of units registered as on 2014-15 was 15455 as against 14997 in 2013-14.
Fig 3.10
Employment generated in MSME sector over the last 4 years
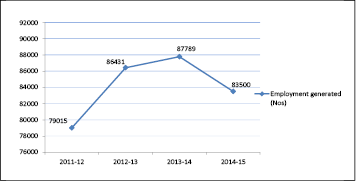
Source: Directorate of Industries & Commerce
3.56 Figure 3.10 shows the employment generated over last 4 years. There has been increase in employment generation for the period from 2011-12 to 2013-14. But the employment generated has decreased by 4.88% in 2014-15. This trend shows that the MSME sector in the State is more capital intensive rather than labour intensive. The details of number of units, investment in the sector, value of production and employment generation from 2007-08 to 2014-15 are given in Appendix 3.20.
District wise achievements
3.57 District wise analysis reveals that during the year under review, Ernakulam occupies highest position in all aspects with 2248 new MSME units and 15468 numbers of employment generated and Idukki was at the lowest position with 302 new MSME units and 1608 numbers of employment generated. Wayanad District shows the minimum value of goods and services produced of ₹7837.90 lakh.
Sector wise achievements
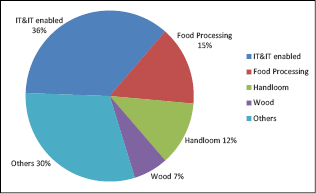
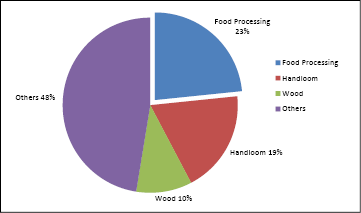
3.58 Sector wise analysis shows that IT & IT enabled services units registered higher number of units in the MSME sector at 5546. The number of food processing units is 2315 and number of handloom units is 1876 among a total of 15455 units registered during 2014-15. The details are shown in Figure 3.11. Details of sector wise MSME units registered during 2014-15 are given in Appendix 3.21.
Fig 3.11
MSME Units registered in 2014-15
Major State Plan Schemes and achievements
3.59 During 2014-15 State Government implemented various schemes successfully for improving the industrial environment of the state through development of industrial infrastructure, promoting entrepreneurship and providing skill development. Following are the major schemes and achievements.
Sl No |
Scheme Name |
Achievements 2014-15 |
| 1 | Infra- structure Development Schemes | These schemes intend to promote development of infrastructure in the industrial parks, estates, Development Areas/Plots with quality infrastructure like roads, power, water, waste management etc. & develop new multi-storied industrial estates, industrial parks, common facility centres for clusters etc. During 2014-15, the functional industrial estates at Changanasseri & Manjeri were upgraded and road work as part of infrastructure development in the Anthur Development Plot(DP), Kannur was initiated. An outlay of ₹2430.00 lakh was provided for the year 2015-16 for implementing the schemes. |
| 2 | Entrepreneur Support Scheme (ESS) | The scheme intends to provide extensive support to MSMEs and give one time support to entrepreneurs, with regard to special categories like women, SC/ST, etc., with more flexibility of operation and clear guidelines. During 2014-15, assistance was provided to 785 units/entrepreneurs under this scheme, Trivandrum district is at the top position with 120 numbers. An outlay of ₹4000 lakh was provided during the year 2015-16 for ESS. |
| 3 | Capacity building programme | The scheme intends to promote Entrepreneurial/ industrial promotional activities and skill development training in Micro, Small and Medium Enterprises. Under the scheme following events were conducted • Industries Extension Officer (IEO) induction training & training for Government officers. • Skill development training to fifty youth in each district in selected areas. • 4 training workshops for ED clubs at Kerala Institute of Entrepreneurship Development (KIED) to create in-depth awareness of personal entrepreneurial characteristic. • 420 Entrepreneurs Awareness Programme for 20,000 entrepreneurs in block/ municipality/ corporation. • Organised various industrial promotional activities like seminars, work shops, interactive meetings, Technology clinic in all districts for entrepreneurs. An outlay of ₹750 lakh was provided during the year 2015-16 for the scheme. |
Organized & Unorganized sector
3.60 As per the latest Census, Fourth All India Census of Small Scale Industries (SSI)/Micro, Small & Medium Enterprises (MSME) sector, conducted by Ministry of Micro, Small and Medium Enterprises,the total number of unregistered MSMEs functioning in the country stands at 346.12 lakh. In MSME sector the number of registered enterprises in Kerala was 1.50 lakh while unregistered enterprises was 20.63 lakh and employment in registered sector was 6.21 lakh numbers while in unregistered sector it was 43.4 lakh.
Employment in MSME Sector
3.61 As per the latest Census (Fourth All India MSME Census) as well as data extracted from Economic Census 2005 conducted by CSO, MoSPI, the total number of persons employed in the sector increased to 805.24 lakh in entire country. Kerala was at 6th position with 49.62 lakh people while UP (92.36 lakh) & West Bengal (85.78 lakh) were on top. Employment in MSME sector in Tamil Nadu (at 3rd position) and Karnataka were 80.98 lakh and 45.72 lakh respectively.
Industrial Co-operative Societies
3.62 In Kerala, the total number of working industrial co-operative societies as on 31.3.2015 was 405 against 566 in the previous year (28% fall in the year). Out of 405, 114 Societies were registered by women. The details are given in Appendix 3.22. During 2014-15, 19 societies were registered.
Industrial Development Plot / Areas
3.63 Directorate of Industries and Commerce (DIC) is providing and developing infrastructure facilities for small scale sector in the State. At present there are 37 Development Area / Development Plots under DIC having a total acquired area of 2405 acre, in which one has not yet commenced functioning and another one has not developed. A total of 1797 units are functioning in these DA/DPs in 2014-15 compared to 2176 in the previous year. The details are given in Appendix 3.23.
Mini Industrial Estates
3.64 The total number of mini industrial estates under DIC as on 31.3.2015 is 89 and the total number of SSI units are 777. The employment in the 683 units that are working is 3400. The details are given in Appendix 3.24.
Industrial Estates under SIDCO
3.65 Kerala Small Industries Development Corporation (SIDCO) provides infrastructure facilities such as land, work shed, water, distribution of scarce raw materials to the units in the small scale sector. There are 17 major industrial estates, which include 830 working units, under the administrative control of SIDCO. These working units provided employment to nearly 7376 people as on 31.03.2015. Besides, there are 36 mini industrial estates under SIDCO in which about 1303 employees are working in 289 units all over the State. Details of industrial estates under SIDCO are given in Appendices 3.25, 3.26 and 3.27.
Promotional Events / Exhibitions – Achievements of the MSME sector during 2014-15
3.66 The Directorate of Industries and Commerce conducted/participated in 27 Exhibitions / Fairs /Expos inside Kerala with 1219 stalls in 2014-15 and generated an income of ₹11.14 crore. The DIC represented Kerala in one international exhibition outside Kerala with 26 stalls. Details are given in Appendix 3.28. Following are the major activities undertaken by the Department of Industries during 2014-15.
• Conducted Industrial exhibition in 13 districts, Machinery Exhibition in 3 districts & Rubber Expo at CFSC, Manjeri.
• Participated in 34th India International Trade Fair (IITF) -2014 at PragathiMaidan, New Delhi, from November 14th to 27th, 2014.
• Business to Business MEET for MSME conducted at Kochi on 26/2/2014 to 28/02/2014.
• Conducted induction training for IEOs & training for Government officers.
• Imparted skill development training to fifty youth in each district in selected areas.
• Conducted 4 training workshops for Entrepreneurship Development (ED) clubs at Kerala Institute of Entrepreneurship Development (KIED) to create in depth awareness of personal entrepreneurial characteristic.
• Organised various industrial promotional activities like seminars, workshops, interactive meetings etc. for entrepreneurs
• Technology clinic for entrepreneurs conducted in all districts.
• Entrepreneurs Awareness Programme for entrepreneurs conducted in block/ municipality/
corporation wise (420 programmes with around 20,000 participants).
• Organised Entrepreneurs Development Programme for entrepreneurs in 14 districts, District and Taluk level seminars organised for entrepreneurs & seminar for entrepreneurs, on biodegradable plastics, conducted in all districts.
• Potential survey conducted in all districts for updating useful data, local mapping, preparation of reports, project profiles and entrepreneur’s guide.
• Conducted Kerala bamboo fest at Cochin.
• Assisted to start new venture under Prime Minister’s Employment Generation Program (PMEGP) scheme involving financial assistance of ₹1052.16 lakh to the entrepreneurs (Employment generated-3942, No of projects-678).
Bank Credit to SSI / MSME Sector
3.67 As per the State Level Bankers’ Committee (SLBC) report, the outstanding bank credit to various sectors by the commercial banks in Kerala at the end of March 2015 increased by about 13.9% ie. ₹218706 crore against ₹192010 crore in the previous year. The outstanding flow of credit to MSME sector was ₹35730 crore with an increase of 11.4% over ₹32069 Crore of previous year. The status of flow of credit to various sectors is given in Appendix 3.29.
3.68 Financing MSMEs, which have been largely dependent on promoter’s resources and loans from banks/financial institutions, particularly knowledge based enterprises has some issues as these industries do not create tangible assets. SIDBI has played a critical role in developing the MSME venture eco-system in the country. SIDBI has so far contributed to the corpus of 75 venture capital funds that have catalysed investment of more than ₹5600 crore to more than 472 MSMEs.
3.69 The total MSME credit of SIDBI as on March 31, 2014 was ₹61,271 crore, with cumulative financial assistance provided by the Bank aggregating ₹37 crore, benefiting more than 340 lakh units/persons. Details are given in Appendix 3.30.
Box 3.6
MSME Amendment Bill, 2015
The Ministry of Micro, Small and Medium Enterprises Development (Amendment) Bill, 2015 proposes to (i) enhance the existing limit for investment in plant and machinery considering changes in price index and cost of inputs consistent with the emerging role of the MSMEs in various Global Value Chains, (ii) include medium enterprises apart from small enterprises in section 7(9) to enable the aforesaid category of enterprises to avail the benefits and become competitive, and (iii) empower the Central Government to revise the existing limit for investment, by notification, considering the inflation and dynamic market situation
Entrepreneurship Development
3.70 Entrepreneurial activity is a pillar of economic growth, across countries. For evidence of the economic power of entrepreneurship, we need look no further than the United States, where young firms have shown to be a more important source of net job creation than incumbent firms. In both developed and developing countries, fostering entrepreneurship for sustainable development could improve and create more sustainable consumption and production systems overall. Educating current and potential entrepreneurs enables them to create viable alternatives to existing production and consumption systems that fail to adequately address sustainability issues, such as environmental deterioration along the supply chain and overall quality of life. Entrepreneurial education fosters innovation and helps entrepreneurs build better products, processes, and services. It is especially effective when it takes into account the social, economic and ecological complexities of development, the values of sustainability, and a long-term perspective.
3.71 As per World Bank SME database, where annual data was collected from 136 countries, India is at 6th position in the number of new limited liability companies (98029 numbers) registered during the year 2014. The top 5 countries are UK, Russia, Australia, Hong Kong-China, and Chile. But India stands at 126th position in new business density with 0.12. (Business density is the number of newly registered firms with limited liability per 1,000 working-age people (ages 15-64) per calendar year). See Table 3.2.
Table 3.2
Top ten countries with newly registered limited companies
No. |
Economy |
New business density |
Number of new limited liability companies |
1 |
United Kingdom | 12.9 |
5,37,658 |
2 |
Russian Federation | 4.2 |
4,27,388 |
3 |
Australia | 14.91 |
2,31,920 |
4 |
Hong Kong SAR, China | 31.3 |
1,67,280 |
5 |
Chile | 8.03 |
98,406 |
6 |
India | 0.12 |
98,029 |
7 |
France | 2.26 |
94,927 |
8 |
Italy | 2.32 |
91,853 |
9 |
Spain | 2.97 |
91,544 |
10 |
Korea, Rep. | 2.3 |
84,676 |
Source: World Bank SME database, 2014
3.72 In Kerala, entrepreneurship is promoted in low knowledge-intensive sectors such as trade, transport and tourism, as well as knowledge-intensive sectors such as IT, IT enabled services, engineering etc. The labour scenario in Kerala is very challenging for entrepreneurs.
Box 3.7
ASPIRE - Central Government Programme
A Scheme for Promotion of Innovation,
Rural Industry and Entrepreneurship (ASPIRE)
ASPIRE was launched on 16.03.2015 with an objective to set up a network of technology centers, incubation centres to accelerate entrepreneurship and also to promote start-ups for innovation and entrepreneurship in rural and agriculture based industry with a fund of ₹210 crores.
• The planned outcomes of ASPIRE are setting up Technology Business Incubators (TBI), Livelihood Business Incubators (LBI) and creation of a Fund of Funds for such initiatives with SIDBI.
• 1st LBI set up in April-2015 under ASPIRE within a month of launching the Scheme. The first batch of 107 youth has been trained and skilled through it.
• 19 LBIs have been approved till September 2015 and another 9 LBIs & 2 TBI is ready to be approved.
Promoting Skill Development
3.73 Staff training and vocational and continuous on-the-job training ensure a constant upgrading of workers’ skills. In India, Ministry of Micro, Small and Medium Enterprises provided entrepreneurship and skill development training to 16,87,324 persons during the 11th Plan and 11,58,562 persons during the first two years of the 12th Plan, through various institutions like MSME-Development Institutes, KVIC, Coir Board, NSIC etc.
3.74 MSME-Development Institute, Thrissur, Kerala (MSME-DI, Thrissur), has conducted 81 tailor made development training programmes in 2014-15 viz., 5 Entrepreneurship Development Programmes, 25 Industrial motivation campaigns, 36 Entrepreneurship Skill Development programmes, 1 Management Development programmes and 14 skill development programmes. 2894 persons benefited through these programmes. Details are given in Appendix 3.31.
Skill Development & Training Institutes in Kerala
| MSME Development Institute, Thrissur, Kerala (MSME-DI, Thrissur) | Institute under the Ministry of MSME, Government of India takes care of the needs of MSME sector in the State of Kerala and the Union Territory of Lakshadweep in the area of Techno-economic and managerial consultancy services. It conducts need based development training programme on Entrepreneurship, Business Skill & Management and other awareness programmes. |
| Kerala Institute for Entrepreneurship Development (KIED) | A Public Sector Training Institute aimed to create awareness for entrepreneurs and sort out the issues for the development of entrepreneurial culture. The institute conducts various programmes for developing the spirit of entrepreneurship among the people such as Entrepreneurial Awareness Campaign, Seminars, Workshops, Research etc. |
| Kerala Academy of Skill excellence (KASE) | Setup by Government of Kerala to implement focused and specialised skill development programmes in domains from traditional industries to knowledge economy. |
| Kerala Institute of Labour and Employment (KILE) | Constituted by Government of Kerala for training and research in labour and allied subjects. |
Industrial Cluster Development
3.75 Industrial clusters are increasingly recognised as an effective means of industrial development and promotion of small and medium-sized enterprises. For MSME participants, clusters play an important role in their inclusiveness, technology absorption, efficiency improvement and availability of common resources. The Ministry of Micro, Small and Medium Enterprises (MSMEs) adopted the cluster approach as a key strategy for enhancing the productivity and competitiveness as well as capacity building of small enterprises.
3.76 The State has already adopted the cluster development approach for industrialisation to reap the benefits of agglomerations through transformation of the traditional systems of activities or industrial districts to new networks ready for competition and innovation. The State supports cluster development through MSME-DI, Thrissur and K-Bip. The Common Facility Centres which are in various stages of development in the State are in the areas of Wood, Plywood, Furniture, Rubber, Terratile, Rice Mill, Plastic, Printers, Ethnic Food, Agriculture Implements and General Engineering. The State has identified about 75 SME clusters and they are at different stages of development. Central Government agencies like Coir Board, SISI, and NGOs like Federation of Industrial Clusters etc. are also taking initiative in Cluster Development.
Box 3.8
Agglomeration Economies
In urban economics, economies of agglomeration means the benefits that firms obtain by locating near each other (‘agglomerating’). This concept relates to the idea of economies of scale and network effects. As more firms in related fields of business cluster together, their costs of production may decline significantly (due to presence of competing multiple suppliers, greater specialization and division of labour). Even when competing firms in the same sector cluster, there may be advantages because the cluster attracts more suppliers and customers than a single firm could achieve alone. Agglomeration economics causes the formation and growth of cities. China, Republic of Korea and Singapore are the countries which reap the benefits of agglomeration.
Financial Package for rural industries - Prime Minister’s Employment Generation Programme (PMEGP)
3.77 A national level credit linked subsidy scheme, namely, ‘Prime Minister’s Employment Generation Programme (PMEGP)’was introduced for generating an estimated 37.38 lakh additional employment opportunities by setting up of micro-enterprises in the non-farm sector in rural as well as urban areas. During the period from 2008-09 to 2013-14, 2.48 lakh units have been assisted with margin money subsidy of ₹4745.15 crore to create employment for an estimated 22.29 lakh persons in the country. For 2014-15 an outlay of ₹1418.28 crore has been earmarked for the scheme. During 2015, ₹860.51 crore has been released by the Ministry as margin money under PMEGP out of which ₹528.32 crore has already been disbursed by the banks and 24126 new enterprises providing employment to 170983 persons have been benefited under the Scheme. There is more than 50 per cent increase over the previous year in terms of funds disbursed by the banks, no of projects with funds disbursed and the employment generated.
3.78 The Khadi and Village Industries Commission (KVIC) was approved as the nodal agency for implementation of the scheme at national level. In Kerala, State KVIC Directorate, State Khadi and Village Industries Board (KVIB), District Industries Centres (DICs) and bankers are the agencies for implementation of the scheme. A target of 730 number of units were allocated to DICs. As on 31.05.2014, applications worth ₹1509.28 lakh were pending for subsidy release for want of funds. As per directions of 20th SLMC, DIC had not recommended any applications in 2014-15 except SC/ST applications to meet sub category target. The banks sanctioned 707 applications and provided Margin Money of ₹1052.18 lakh. Though financing banks had sanctioned 707 applications in 2014-15, margin money has been released for 678 applications only. Details are given inAppendix 3.32. During 2015-16 upto September 2015, 461 applications worth ₹696.55 lakh were sanctioned by bank. Details are given in Appendix 3.33.
Box 3.9
Cluster branding in China
A cluster economy is made up of professional towns and villages, functioning as production hubs focusing on one product/industry,and creating highly specialised large clusters. In China, the cluster policy focuses on branding clusters on the basis of their speciality. These are, for instance, Shengze textiles, Wujiang Hengshan sewing machines, Ningbo costumes, Wenzhou shoes, Shaoxing synthetic textiles, Haining leather coats, Yiwu small commodities, Yongkang hardware and so on and so forth. Small firms in the cluster are those employing up to 300 workers and medium ones have 300 to 2000 workers. Most clusters are developed such that they have entire value chains augmented within the cluster. Each firm is specialised and is connected with other firms through production networks. This increases efficiency and survival rate and reduces cost. These clusters thus have strong forward and backward linkages through value chains.
Section-4
Food Processing
3.79 The developed world’s food basket consists of 80 per cent of processed food, while the share is only 1.3 per cent in India. The Government of India has set a target of raising the share of processed food in the total food basket to 10 per cent in 2015 and 25 per cent in 2025. India’s food processing sector ranks fifth in the world in exports, production and consumption. The contribution of the food processing industry to the gross domestic product at 2004-05 prices in 2012-13 amounts to ₹845.22 Billion. During 2014-15, the sector constituted as much as 9.0 per cent and 10.1 per cent of GDP in manufacturing and agriculture sector, respectively. Food processing sector has grown at 7.1 per cent during this period under review.
Initiatives of Ministry of Food Processing Industries –MoFPI
3.80 The Ministry of Food Processing Industries is implementing various schemes for providing impetus to the development of food processing sector, viz. Infrastructure Development for Food Processing with the components of (i) Mega Food Park (ii) Cold Chain (iii) Setting-up/Modernization of Abattoirs, Scheme for Quality Assurance for setting up of Food Testing Laboratories and Technology Up gradation Scheme.Government has de-linked National Mission on Food Processing (NMFP) in the States from Central Government support with effect from 01.04.2015. However, NMFP is being supported by the Central Government in UTs. Some of the initiatives taken by the Ministry include the following.
• The Scheme of Mega Food Park was launched to provide modern infrastructure for food processing units in the country. Presently, 39 Mega Food Parks have been granted approval, two of which are in Kerala.
• The Cold Chain Scheme was launched to provide integrated cold chain and preservation infrastructure facilities without any break, from the farm gate to the consumer. Government has approved 138 cold chain projects during 2009-2015.
• An allocation of ₹2800.00 crore has been made for the Scheme of Infrastructure Development for Food Processing during the 12th Five Year Plan.
• A Food map of India identifying surplus raw material has been prepared and uploaded on the Ministry website. Idea is to identify the surplus and deficient areas in the country of various agricultural and horticultural produce so as to plan processing clusters by means of setting up processing facilities under current schemes.
• The services of pre-conditioning, pre-cooling, ripening, waxing, retail packing, labeling of fruits & vegetables have been exempted from Service Tax w.e.f. 01/04/2015.
• The Indian Institute of Crop Processing Technology (IICPT) which is a pioneer Research and Development and Educational Institution under the MoFPI, Goverment of India, was upgraded as a national institute and called as Indian Institute of Crop Processing Technology.
• National Institute of Food Technology, Entrepreneurship and Management (NIFTEM) located at Kundli, Haryana is an autonomous organisation under the MoFPI, which imparts B.Tech, M.Tech, Ph.D courses and research work in food technology & engineering and also conducts Skill Development trainings and outreach programmes for the benefit of students, farmers and entrepreneurs. It has conducted 104 such programmes skilling 8469 persons. NIFTEM has trained 44 persons under the Pradhan Manthri Kaushal Vikas Yojana (PMKVY) scheme.
• NIFTEM has also initiated a unique initiative “Village adoption program” for linking rural entrepreneurs and farmers. So far, 9 visits have been accomplished under this programme covering 39 villages across 18 States. And recognizing the efforts of this, NIFTEM was awarded the Agriculture Leadership Award for the year 2015 in the area of promoting rural entrepreneurship in the sector.
Food Processing in Kerala
3.81 As per the Kerala Perspective Plan 2030, food processing sector in the State enjoys a revealed comparative advantage among other Indian states. The industry is also one of the largest employment creators, with growth in direct employment in the organised food processing sector standing at 6.05% between 2010-11 and 2011-12. In terms of employment, the total number of persons engaged in registered food processing units in MSME sector was 14.68 lakh. The contribution of food processing sector to GDP has been growing faster than that of the agriculture sector.
3.82 Food Processing has been recognized as a priority sector in Kerala due to its potential for sustainable and more inclusive growth, diversification, possibility of generating substantial employment and further advancement in respect of industrial development in urban and rural areas. Dairy products, fish/meat products, rice & wheat products, ready to eat/ ready to cook products and bakery products, masala powder, coconut & other oils, ayurvedic medicines, fruit juices etc. are the major food items produced in the State.
3.83 Food processing sector in Kerala has always made significant contribution to food exports. Kerala has been a major exporter of spices, marine products, cashew, coffee, tea and pickles. Two thirds of Kerala’s export income comes from processed food. Exports of food products from Kerala account for approximately 15 to 20% of the Indian export sector. Marine products lead the list of food products exported from the State, followed by spice products & cashew.
3.84 In Kerala, number of food processing units registered during 2014-15 is 2315, which is at the top position. The share of food processing units in the registered sector is shown in the Figure 3.12
Fig 3.12
Food Processing Units registered in 2014-15
Source: Directorate of Industries & Commerce
3.85 Infrastructure facilities so far developed in this sector are the 3 Food Parks at Kozhikode, Ernakulam, Pathanamthitta districts, Seafood Park in Alappauzha district, Incubation Centre at Kakkancherry, Kozhikode, Proposed Food Parks, Mega Food Park, Wayanad, Spices Park, Idukki and two Quality Control Laboratories. There are food processing units, including catering/canteen units, among 31000 MSME units under Kudumbasree.
3.86 Kerala Industrial Infrastructure Development Corporation (KINFRA) is the state agency engaged in the promotion of food processing industry in the State. KINFRA has set up exclusive Food Processing Parks to suit the specific needs of the food processing sector and they offer space for food processing units in their 19 Industrial parks, as the demand for space is high. Out of these Mazhuvannur (Ernakulam) food processing park has 30 units with 792 workers and Kakkancherry (Malappuram) food processing park has 23 units with 760 workers. KINFRA Food parks at Malappuram, Mazhuvannur, Adoor and Aroor were approved by MoFPI. Details of KINFRA food parks are given in Appendix 3.34.
3.87 Under the Mega Food Parks Scheme of Ministry of Food Processing Industries, “In-Principal” approval has been accorded to Mega Food Park, Cherthala, Alappuzha under KSIDC and Mega Food Park, Palakkad under KINFRA on 31.03.2015, out of 38 Mega Food Parks in the country.
Quality Management in Food Processing Industries
3.88 The National Centre for HACCP Certification (NCHC) in association with K-BIP has initiated the process of auditing and certification of food processing and allied units from the State and outside the State. NCHC imparted training programmes on Food Safety (HACCP) system to Government officials nominated from various departments.
Section-5
Traditional Industries
Handicrafts
3.89 Handicraft industry is one of the traditional industries of Kerala, providing employment to artisans. Eighty percent of these artisans are from socially and economically backward classes. Kerala has the tradition of making beautiful handicrafts with ivory, bamboo, palm leaves, seashells, wood, coconut shells, clay, cloth, coir, metals, stone, lacquer ware and so on. Many old handicraft classics can be seen in palaces, old heritage homes and museums in the State.
Importance of Handicraft Industry
3.90 Kerala State Handicrafts Apex Co-operative Society (SURABHI), Handicrafts Development Corporation and Artisans Development Corporation are the major promotional agencies in the handicraft industry. SURABHI is the apex organization of primary handicrafts co-operatives established with a view to uplift the artisans by marketing their products through the primary co-operatives and implementing welfare schemes with the assistance from State and Central Governments..The turnover of the society during the year 2014-15 was ₹337.33 lakh. Apex society received an amount of ₹100 lakh during the year under the scheme, “Assistance to apex organisation in handicrafts sector”. This was primarily used for conducting exhibitions and repair works of showrooms. There are 47 societies and SURABHI made a profit of ₹11.09 lakh from 12 exhibitions and fairs in the year 2014-15. Details are given in Appendix 3.35. The renovation of marine drive show room and Thrissur show room were completed. The construction of administrative block at craft development centre is entrusted with Construction Corporation and the work is progressing.
3.91 Handicrafts Development Corporation of Kerala (HDCK) is engaged in procuring and marketing handicraft products by giving fair returns to artisans through Sree Moolam Shashtyabdapurthi Memorial Institute (SMSMI) and Kairali emporia spread all over India. At present it is having a net work of 19 such sales emporia other than SMSMI. HDCK has been running a Common Facility Service Centre (CFSC) at Thiruvananthapuram for artisans who engage in development wood crafts. HDCK received an amount of ₹50.00 lakh during the year 2014-15 under the Scheme “Assistance to apex organisation in handicraft sector” which was utilised for organising exhibitions cum sales . This benefitted more than 5000 handicrafts artisans (both directly and indirectly). HDCK made a profit of ₹25.99 lakh from 42 exhibitions and fairs in the year 2014-15.Details are given in Appendix 3.36. The Kerala Artisans Development Corporation (KADCO) is one of the State agencies providing assistance to artisans for establishing production units, promoting marketing of products and providing employment opportunities through schemes of trade fairs and marketing centres.
Bamboo Industry
3.92 Bamboo is a highly productive renewable & eco friendly resource and has several applications. It is widely used in environment protection, as a nutrient food, high-value construction material and in about 1,500 other applications. It is estimated that about 2.5 billion people use bamboo in one form or the other at the global level. Advanced research activities are conducted to utilize bamboo for efficient fuel generating system.
3.93 From a raw material known as the “poor man’s timber” bamboo is currently being elevated to the status of “the timber of the 21st century”. India has a vast diversity of bamboos with 136 species. Next to the North East region, Western Ghats is the area which has the second largest diversity of bamboos. It is estimated that 8 million artisans are dependent on bamboo craft for their livelihood and the annual turnover of the bamboo sector is estimated to be around ₹2400 crores, in India.
3.94 In Kerala, 28 species of bamboo are found. Bamboos from the Kerala forest are being supplied mainly to the pulp and rayon units under concessional rates. It is estimated that there are about one lakh people in the State dependent on bamboo for their livelihood. A unique feature of the Kerala bamboo scene is that 67.3% of the extracted bamboo comes from home gardens rather than from the forests. Recent data from the panchayats indicate that there has been a great drain in the number of artisans from the sector to semi skilled and unskilled jobs in the tertiary sectors like construction.
3.95 The Kerala State Bamboo Corporation Ltd. was established in 1971 in Kerala to develop and promote industries based on Bamboo, reed, cane and rattan. Kerala State Bamboo Corporation’s main activity is collection of good quality reeds from Government forests and distributing these reeds to the registered mat weavers of the Corporation, throughout the State, on credit basis and procuring woven mats made of these reeds at reasonable prices, thus providing employment and regular means of livelihood to these weaver sections of the society. Bamboo mats, Bamboo ply, Flattened board, Flooring tiles are the main products. The artisans in the weaving sector around Angamali region is supported by the Kerala State Bamboo Corporation. An Innovation Centre for Bamboo Development and Development of Premium Designs for Mementos is being set up. The major achievements during the year under review was the introduction of bamboo furniture / fabrication of eco friendly huts on a turnkey basis, participation in National Games by supplying signboards, gazebo, pavilion etc. to turn the event green.
Kerala State Bamboo Mission
3.96 Kerala State Bamboo Mission (KSBM) constituted in the year 2003 is designated as the Bamboo Development Agency (BDA) of the State for implementation of the various schemes of the National Bamboo Mission (NBM), under the Department of Agriculture & Cooperation, Ministry of Agriculture and Farmers’ Welfare, Government of India. KSBM has four Sub-Committees namely Propagation of Bamboo, Technology Intervention and R & D, Marketing & Livelihood and Design & Training.For ensuring effective implementation and monitoring of the Schemes, State Bamboo Steering Committee (SBSC) was constituted with the Additional Chief Secretary (Forest & Wildlife) as its Chairman.
3.97 The interventions initiated after the formation of KSBM include promoting cultivation of bamboo, creation of new designs for innovative products in the handicrafts sector along with appropriate skill development, promotion of bamboo based modern industries supported by technology adaptation and development. It is expected that this will bring in greater business opportunities at various levels, especially among women and hence improve the living standards of the rural people, there by contributing to the overall growth of the sector.
Box 3.10
Kerala Bamboo Missions – Major Interventions in 2015 -16
| Kerala Bamboo Fest 2015 | The Department of Industries & Commerce in association with Kerala Bureau of Industrial Promotion (K-BIP) and Kerala State Bamboo Mission (KSBM) organized the 12th edition of ‘Kerala Bamboo Fest’ at Marine Drive, Kochi from December 4 to 8, 2015. The fest overall conveyed the importance of using natural items as bamboo in day to day activities. |
| Facilitated participation of Bamboo artisans / craftsmen in various Regional / National Events | During the financial year 2015 - 16, KSBM facilitated participation of Bamboo artisans / craftsmen in four Regional Events and three National Events as a result of which artisans were able to find new markets for their products. |
| Trainers Training Programme to Bamboo Artisans / Craftsmen | KSBM organized 6 days residential Quality Enhancement Training Programme at Wayanad, participated by 20 artisans from various Bamboo Groups / organizations. This helped them in achieving better productivity, quality and finishing. |
| Bamboo Innovation Centre | Kerala State Bamboo Mission (KSBM) in association with Kerala State Bamboo Corporation (KSBC) is setting up Bamboo Innovation Centre at the premises of KSBC, Angamaly, Ernakulam. It aims at the dissemination of need based knowledge, support service, conduct need based training etc. to the bamboo sector. |
| Development of Supply chain of treated Bamboo | Kerala State Bamboo Mission (KSBM) in association with Kerala State Bamboo Corporation (KSBC) is in process of development of Supply Chain of Treated Bamboo to the beneficiaries through the Depots of KSBC to ensure uninterrupted availability of the raw materials. |
| Providing Tools / Equipments as Common Facilities | The groups represented in the Quality Enhancement Training Programme have trained their groups and provided general tools and equipments as groups Common Facility .This will help them to improve their productivity, finishing and capacity to meet the demands of the market. |
Textile Industry
3.98 The textile sector in Kerala is limited in the sense that the spinning mills in Public-Private-Cooperative sectors are concentrating on spinning and weaving. The production and sales of vivid varieties of clothing are basically confined to Handloom and Khadi sectors.
Handloom Sector
3.99 The average handloom cloth production in India from 2008-09 to 2013-14 was 6900 million sq. meters per year with an average growth rate of 1.79 percent. The sector provides employment to 43.31lakh persons engaged in about 23.77 lakh handlooms. The production in the handloom sector recorded a figure of 7116 million sq. meters in the year 2013-14.The total cloth production in the sector till 30th September 2014 is 3547 million sq. meters. (Source: Annual Report 2014-15, Ministry of Textiles, Government of India).
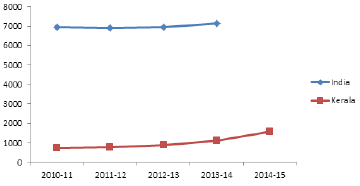
3.100 The average handloom cloth production in Kerala for the period 2011-12 till 2014-15 is 32.65million sq. meters per year with an average growth rate of 12.61 percent. There was a significant increase in the cloth production during 2014-15 as compared to the previous year.ie, 18.27 percent. The status of cloth production, both in India and Kerala for the period from 2010-11 to 2013-14 and Kerala for the year 2014-15 is shown in Figure 3.13.
Fig 3.13
Cloth Production by Handloom Sector (in million sq.meters)
Source: Annual Report 2014-15, Ministry of Textiles.
3.101 The growth rate of cloth production in Kerala is far better than that of the country as a whole. But the contribution of the State to national cloth production is only 0.473 percent. The year wise details of production and productivity under handloom industry in Kerala for the period from 2010-11 to 2014-15 is provided in Appendix 3.37.
3.102 As regards Central Assistance to the States, from the period from 2001-02 to 2013-14, the state of Tamil Nadu occupies first place followed by Andhra Pradesh, Gujarat, West Bengal, Rajasthan, Kerala, Uttar Pradesh, Haryana and Madhya Pradesh. Kerala occupied 6th position till 2013-14.
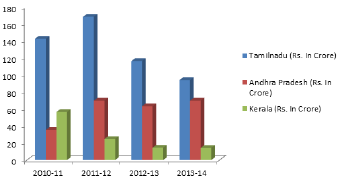
3.103 The status of Southern states with respect to Central Share released is presented in Figure 3.14. It may be noted that Karnataka does not figure among the top 10 states and thus has not been represented in the figure. 3.14
Fig 3.14
Handloom Sector Central Assistance Released to States
Source: Ministry of Textiles, Various Annual Reports, G.O.I.
3.104 In the financial year 2014-15 too, the State received a Central Assistance to the tune of ₹14.75 crore and utilized the same. The Central release to the states depends on parameters like number of handloom weavers and allied workers, number of units and number of handlooms. Tamil Nadu and Andhra Pradesh are the leading southern states in terms of these parameters in India.
3.105 The state-wise status of number of handloom weavers and allied workers, units and number of handlooms is exhibited in Figure 3.15.
Fig 3.15
South Indian State-wise details of Handloom Units, Workers and Looms

Source: Handloom Census Report 2009-10, International Journal of Multi
Disciplinary Research and Development
3.106 Kerala is lagging behind other southern states in terms of number of handloom weavers, number of units and number of handlooms. Moreover, the number of adult workers as per the Handloom Census 2013 is 14,518 which is only 0.38% of the all India total. Out of the 14,518 adult workers, 74.29% are females whereas the per cent female weavers at all India level is 77.47%. (Source : EPRA Inter National Journal of Economic and Business Review)
3.107 Out of ₹5540.5 lakh allotted to the handloom sector for the year 2013-14, an amount of ₹5174.54 lakh was utilized, percent utilization being 93.4%. This is inclusive of ₹795.40 lakh utilized for the revival reform package, which was a Centrally Sponsored Scheme with central share of 80%. As against the outlay of ₹4691.50 lakh during 2014-15, the expenditure registered is ₹4783.62 lakh (101.96%). Out of this, the utilization under revival package was ₹395.01 lakh. In 2015-16, the expenditure booked as on 05-01-2016 is ₹3677.38 lakh (92%), against the allocation for the year, ₹4004.51 lakh. But the revival package has been discontinued with effect from the financial year 2015-16 and is not in force. The year wise details of assistance (₹in lakh) extended by way of loan and grant for the development of handloom industry for the period from 2013-14 to 2014-15 is given in Appendix 3.38.
Box 3.11
Major Achievements
1. Under the Revival, reform and restructuring package for handloom sector, 233 PHWCS, Hantex and 5 Individual weavers have benefitted. A total amount of ₹.209.52 core was provided for this package.
2. Assistance was given for the modernization of Handloom Co-Operative and Apex Societies. In 2014-15, an amount of ₹.871.56 lakh was utilized under the scheme extending assistance for MDA-71PHWCS, Margin money -7yarn banks, Work shed maintenance-10 societies, Value Added Products-26 Societies, Technology upgradation Assistance-51 societies, Weaving accessory-1888 weavers, Revitalization -5PHWCS and 2 apex societies.
3. Skill upgradation training for handloom weavers was conducted and 110 weavers from different parts of the State have benefitted during 2014-15.
4. Weavers / allied workers motivation programme intends to motivate weavers/allied workers to improve productivity by providing attractive incentives. 15,000 weavers have benefitted under this programme. An amount of ₹300 lakh had been utilized for this purpose in the year 2014-15.
3.108 Since the data on handloom sector based on the Handloom Census of India 2009-10, (Ministry of Textiles, Govt. of India) and the State Departmental figures differed in terms of the number of handloom households, number of societies, total membership, production etc, a ‘Detailed Survey on Handloom Industry in Kerala’ has been initiated in Annual Plan 2013-14 and is being conducted by Centre for Management Development. The objectives of the Survey are the following,
• To ascertain both physical as well as financial structure of the handloom sector.
• To obtain the details regarding the number of household and non household weaving units, production of handloom textiles, type of looms, consumption of yarn, number of working days, earnings of the members, bank details and the physical assets of all societies, ownership of looms, sales, exports, wages etc.
• To study the socio economic impact on weavers who benefited from implementation of various developmental activities.
• To study the financial assistance received in each co-operative society under various schemes (loan, share and grant) and present outstanding dues.
• To study problems faced by the primary co-operative societies due to higher rate of working capital interest, blockage of funds with HANTEX/HANVEEV and State Government.
3.109 The survey is also intended to ascertain the reasons for the disparity in figures reported by the Directorate of Handloom & Textiles. The survey report is awaited. Category and year wise details of handloom co-operative societies within the State for the period from 2010-11 to 2014-15 as furnished by Directorate of Handloom and Textiles is given in Appendix 3.39.
3.110 Almost all crisis in the Khadi and Village industries sector such as shortage of workers, surplus stock in unsold handloom, lack of product innovation, high cost of production etc are prevailing in this sector too. Problems such as lack of adequate working capital, inadequate availability and increasing price of raw materials, high wage rates on alternative occupation, stiff competition from powerloom sector and low sales turn over were also identified in the sector through the Evaluation Study on Handloom Industry in Kerala, conducted by the Evaluation Division, State Planning Board, October 2014.
Promotional Measures of Handloom Sector
3.111 Promotional measures for handloom sector such as procurement, sales and marketing of handloom fabrics are being undertaken by two state level organisations namely Hantex and Hanveev.
3.112 Hantex, the apex society of around 450 primary handloom societies in the State, was formed in 1961 with the objective of organizing the handloom industry in the State on sound commercial basis. Despite grants and loans being given to the society, the organisation is running at a heavy loss. The year wise working results of Hantex for the period from 2010-11 to 2014-15 is given in Appendix 3.40.
3.113 The Kerala State Handloom Development Corporation Ltd. (HANVEEV) is a Government of Kerala undertaking incorporated in 1968 for the welfare and development of traditional weavers in the unorganized sector and engaged in the manufacturing and marketing of wide range of handloom products depending on the market trends and sale through various outlets in Kerala. At present, the Corporation has 52 own showrooms, 6 exclusive agency showrooms and 33 production centres. This organisation is running in heavy losses. The year wise performance and working results of Hanveev for the period from 2010-11 to 2014-15 is given in Appendices 3.41 & 3.42 respectively.
Suggestions to improve the Handloom Sector
3.114 We have to adopt better measures for modernizing and upgrading the technology to ensure improvements in product quality and productivity in the handloom sector, make use of the possibilities of Information technology to improve the production and marketing of value added handloom products in national and international markets. To improve the productivity of weavers, productivity linked incentives shall be routed through Direct Benefit Transfer System (DBTS). The labour migration and mobility should be reduced in this sector by increasing the wage rate of the labourers in the sector and making it at par with the wage rate prevailing in the State, which in turn can be achieved only through modernization/mechanization in the sector by bringing in cost efficiency.
3.115 As part of the Handloom innovation programme production of organic clothes with ‘made in Kerala’ branding can also be promoted. The handloom sectors rich traditions should be leveraged to develop tourism potential through showcasing the unique skills and products of this sector, with live demonstrations of the craft along with sales counters at strategic locations within the proposed handloom village.
Textile Sector – Spinning Mills
3.116 The Textile Industry in Kerala is spread over public , private , Co-operative and joint sectors. The textile mill industry in Kerala, however, are not running profitably and mills involved in spinning and weaving are facing problems from demand and supply side. Scarcity of raw material is the biggest obstacle of the textile mills in Kerala, since it constitutes major share of production costs and Kerala although is traditionally regarded as an agriculture state, cotton has never been a prominent among its cash crop in the State. Outdated machinery and stiff competition can be regarded as the other significant problems of the textile mills in Kerala, along with high cost of raw material, low productivity, decreasing profits, lack of working capital and high cost of labour.
Kerala State Co-operative Textile Federation Limited –TEXFED
3.117 Kerala State Co-operative Textile Federation Limited (TEXFED), is the apex body of Co-operative Spinning Mills and Integrated Power loom Co-operative Societies in the State. It integrates all the segments of the textile industry from spinning to weaving, processing and garmenting. There are seven Co-operative Spinning Mills as members of TEXFED. Five of them are administered by the Government and two by elected boards.
3.118 The main handicaps faced by the mills under TEXFED were the lack of working capital and non availability of raw materials. The Government has put in place a centralised purchase system to procure cotton for the entire textile sector through professionally constituted committee comprising of Public Sector Restructuring and Internal Audit Board (RIAB), Kerala State Co-operative Textile Federation Limited (TEXFED) and Kerala State Textile Corporation Ltd (KSTC). The sale of yarn through the depot is also monitored by the committee. Consequently raw material cost has come down heavily, sufficient savings are being generated due to which revenue and turnover has improved.
3.119 Obsolete technology and age old machineries used in the mills also pose another problem. Even though partial modernization has been done in certain units, it was not at par with the industry standards. Therefore, the Government constituted an Expert Committee to study the crisis prevailing in the mills and the committee recommended modernisation of five Co-operative Spinning Mills in the State.
3.120 Initially the Government had taken up modernisation of Malappuram and Cannanore Co-operative Spinning Mills and completed the first phase modernisation processes. The second phase modernisation of the above mills has started with the assistance of the National Cooperative Development Corporation of Government of India (NCDC). Now the Government has been considering the renovation of plant and machinery of Alleppey, Quilon and Thrissur co-operative spinning mills with NCDC loan assistance, to the tune of ₹3394.15 lakh, ₹5739.16 lakh and ₹2997.78 lakh respectively. Out of which ₹518 lakh was provided in the State budgets in financial years 2013-14 and 2014-15 for the above mills.
Modernisation of Co-operative Spinning Mills
3.121 State Planning Board conducted a study on the revival of spinning industry during 2007-13 and found out that the spinning mills under co-operative sector were profitable only in 2010-11. During the rest of the period under study, all the spinning mills were working under huge loss. The Government took diligent efforts to revive the co-operative sector with scheme, assistance for the expansion of Co-operative Spinning Mills and assistance for K. Karunakaran Memorial Spinning Mills at Mala, Priyadarsini Co-operative Spinning Mill (Prico Mills), and Malabar Co-operative Spinning Mills for upgrading existing machinery and technology for producing export quality yarn were provided.
3.122 The total project cost of K. Karunakaran memorial co-operative spinning mills (Mala) was ₹2387.55 lakh, out of which an amount of ₹950.28 lakh has already been provided. The Government has already provided an amount of ₹2710.09 lakh for the expansion programme of Malabar Co-operative Textile Mills(Malcotex) against the total project cost of ₹4217.62 lakh and a total amount of ₹785.00 lakh, had been provided for the technology upgradation and overhauling of machinery attached to Priyadarsini Co-operative Spinning Mills against the total project cost of ₹3716.00 lakh.
Power loom Industry
3.123 The market for cloth in Kerala is large but around 75% of the textile mills in Kerala are spinning mills which produce cotton yarns. Therefore the Government has set up four integrated power loom co-operative societies in the State to promote the weaving sector as well. Now there are 45 power loom co-operative societies. The co-operative sector owns 594 looms of the total 658 power looms in the State. 95 percentage of cloth production is in the co-operative sector which shows an increasing trend in quantity and value of production in recent years. The year wise details of production and productivity under powerloom industry for the period from 2010-11 to 2014-15 is given in Appendix 3.43.
Khadi and Village Industries
3.124 Khadi & Village Industries has truly grown by leaps & bounds across the country by providing cumulative employment to 1.40 crore people, producing goods worth ₹26109.08 crore by the end of 2013-14. As on December 2014, the cumulative employment generation at the national level was 1.43 crore people and production was worth, ₹21675.89 crore.
3.125 But the Kerala Khadi & Village Industries sector has not been performing well. Data on value of production, value of sales and employment generation for the period from 2010-11, till 2014-15, are provided in Table 3.3.
Table 3.3
Production, Sales and Employment generation in Khadi & village industries sector
Year
|
Production in crores |
Sales in crores |
Employment Generationn (Lakh mandays) |
||||||
National |
Kerala |
Percentage State Share |
National |
Kerala |
Percentage State Share |
National |
Kerala |
Percentage State Share |
|
1 |
2 |
3 |
4 |
5 |
6 |
7 |
8 |
9 |
10 |
2010-11 |
19871.86 |
152.59 |
0.77 |
25792.99 |
174.55 |
0.68 |
113.8 |
1.33 |
1.17 |
2011-12 |
21852.04 |
144.73 |
0.66 |
26797.13 |
167.47 |
0.62 |
119.1 |
1.29 |
1.08 |
2012-13 |
24024.24 |
145.79 |
0.61 |
27839.69 |
170.84 |
0.61 |
124.76 |
1.20 |
0.96 |
2013-14 |
26109.08 |
139.79 |
0.54 |
31152.4 |
172.55 |
0.55 |
140.38 |
1.17 |
0.83 |
2014-15 |
21675.89 |
136.35 |
** |
28753.2 |
170.03 |
** |
143.41 |
1.09 |
** |
*Data at National level as on 31st December 2014
Source:-Annual Report 2014-15, Ministry of MSME, GOI & Khadi & Village Industries Board, Kerala
** Since the data at National level pertaining to the year 2014-15 is only available up to 31st
December 2014, the percent state share is not in picture in the table above.
3.126 The value of production of goods in the sector in Kerala by the fully owned units of K&VI Board as on 2013-14 is ₹139.79 crore and has come down to ₹136.35 crore during 2014-15. The cumulative employment generation for the year 2014-15 fell down to 1.09 lakh man-days from 1.17 lakhs man-days during 2013-14.
3.127 The per cent contribution of Kerala with regard to employment generation, production and sales indicators as against those at National Level, from 2010-11 to 2013-14, is shown in Figure 3.16.
Fig 3.16
Employment Generation, Production and Sales Under Khadi & Village Industries Sector
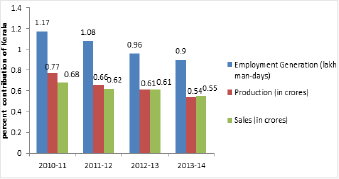
Source: Annual Report 2014-15, Ministry of MSME, GOI & Khadi & Village Industries Board , Kerala.
3.128 The major setback in Khadi & Village Industries Sector, Kerala, is the decline in employment generation. The present production and sales values of the sector within the State is also showing a downward trend and the share of production and that of sales remain constant since 2012-13. The major cause which accounts for the fall in the number of workers engaged in the sector is the migration of workers to more attractive avenues, prosperous endeavors and remunerative employment opportunities in other sectors.
3.129 There are many other causes of significance which also account for this stagnancy prevailing in the sector, viz. surplus stock of unsold khadi, mismatch in khadi production, procedural and technical delays in adoption of project finance approach in place of the existing pattern, shortfall in availing credits and loan from banks, lack of adoption of new market techniques, lack of product innovation, low quality of products,high cost of production, failure in capturing the brand image of traditional khadi etc.
3.130 Non-availability of sufficient raw-materials for large-scale production, Boom in the Textile Industry with power looms across the country and shift in priorities of clothing among public, inefficient and low productive Charkhas, Looms and other Accessories and youngsters opting for higher education in pursuit of salaried jobs in particular also account for this stand still status of this sector in the State.
3.131 The allocation of funds from various sources to K&VI Board for the year 2013 -14 and 2014-15 along with expenditure there upon is given in Table 3.4.
Table 3.4
Receipt and Expenditure of K&VI Board (₹ in lakh)
Particulars |
2013-14 |
2014-15 |
||
Receipt |
Expenditure | Receipt | Expenditure | |
State Government Grant – PLAN 1. Administrative Expenses (Budget provision) 2. Income Support Scheme (Fund through DIC) |
2490 1800 |
2490 1800 |
341.6 2200 |
341.6 2200 |
State Government Grant – Non-Plan 1. Non – Plan – Administrative Expenses 2. Non- Plan – Special Rebate |
2930 1500 |
2930 1500 |
2812.24 1160 |
3493.09 1160 |
KVIC Grant 1. PMEGP – Margin Money Grant 2. Grant for District Awareness Camps and District Level Exhibition of PMEGP 3. Grant for Stationery, Publicity, TA, expense for the Scheme PMEGP |
820.13 4.40
1.85
|
820.13 4.40
1.85
|
813.62 5.40
2.15
|
813.62 5.40
2.15
|
| Grant Total | 9546.38 | 9546.38 | 7335.01 | 8015.86 |
Source: Khadi and Village Industries Board, Government of Kerala.
3.132 The total budgeted outlay for plan schemes for the financial year 2014-15 for the sector was ₹1347.60 lakhs and expenditure is ₹341.60 lakhs (25.35%), till 30th September 2015. The Production / Festival Incentives to Khadi Spinne₹ and Weavers to the tune of ₹151.60 lakhs and ₹. 20 lakh earmarked for Establishment and Strengthening of Departmental Village Industries Units have fully been utilized, which is 51% of the total utilization. Similarly, the total budgeted outlay for the year 2015-16 is ₹1347.60 lakhs and the expenditure as on 03.12.2015 is ₹337.50 lakhs (25.04%). This amount in full has been utilized for the Special Employment Generation Programme as against its targeted outlay, ₹500 lakh in the Budget 2015-16 for the purpose.
Major Achievements 2014-15
3.133 As regards the major physical achievements for the year 2014-15, one hundred cotton bales have been purchased for the project at Ettukudukka in Kannur District utilizing ₹20 lakh and transformer installed utilizing ₹25 lakhs. Ready-made garment unit at Thiruvananthapuram was established and new machinery in hand-made Paper Unit at Elanthoor, Pathanamthitta, installed. The oil unit at Olarikara, Thrissur was renovated. Under the special employment scheme, 91 new units were established, covering all the 14 districts and providing employment to 194 persons. Construction of building to Mini Industrial Park (Village Industries Park) at Pappinissery in Kannur District has been completed and setting up of Village Industries Units with the participation of private entrepreneurs is in progress.
3.134 Moreover, Khadi and Village Industries goods worth ₹523.16 crores has been produced through the Aided Units of the K&VI Board, including the performance of Rural Employment Generation Programme (REGP) and Prime Minister Employment Guarantee Programme (PMEGP), and goods worth ₹567.51 crore has been sold, providing Employment to 142925 persons. It is observed that the productivity per person is much higher in K&VI Aided Units than in K&VI Departmental units. The production, sales and wages paid and employment generated during 2013-14 & 2014-15 and District wise details of Departmental sales outlets and sales under K&VI Board for the period referred to are provided in Appendix 3.44 and Appendix 3.45 respectively. Moreover the details of district wise achievement under self employment generation programme for the year 2014-15 is provided in Appendix 3.46.
Coir Industry
3.135 India is the largest producer of coir in the world accounting more than 80 percent of the production of coir fibre. The export of coir and coir products in India reached 1630.34 crore during 2014-15, recording a growth rate of 27 percent in value terms over the previous year. Coir and coir products were exported to 105 countries in during this period and among these countries; China ranked first followed by the United States of America, Netherlands, United Kingdom and South Korea in quantity and value of export.
3.136 Coir and coir products are one of the major agro based traditional export industry in Kerala. This sector is of prime importance in State economy since it is labour intensive and has high employment potential. It provides employment to nearly 3.75 lakh people of which women belonging to BPL constitute 75 per cent. The availability of coconut husks, natural conditions provided by the lakes, lagoons and back waters for retting coconut husk and traditional expertise of the people were the reasons for flourishing the industry in the State, especially in the coastal area. Co- operative sector plays a major role in the coir industry in Kerala.
Directorate of Coir Development and Agencies in Coir Sector
3.137 To give specific emphasis for the sustainable development of Coir industry in the State, Government has constituted a Directorate of Coir Development. Directorate is the major agency implementing schemes and programmes and designing policies for the sector. Kerala State Coir Corporation (KSCC), Kerala State Co-operative Coir Marketing Federation (Coirfed), National Coir Research and Management Institute (NCRMI), Foam Mattings India Ltd. (FOMIL), Kerala State Coir Workers Welfare Fund Board and Coir Co- operatives are the other major institutions in Coir sector. Coir yarn producers, Product manufacturers and exporters in private sector are also stake holders in the industry.
Kerala State Coir Corporation (KSCC)
3.138 Kerala State Coir Corporation (KSCC) was set up in 1969 for the systematic development of coir industry in the State. It caters the needs of the small scale coir manufacturers by providing them manufacturing and marketing facilities. Its diversified operations include curled coir manufacturing and allied products sectors. The value of export of the corporation has increased from 2.44 crore to 2.58 crore during the year 2014-15 compared to previous year.
The Kerala State Co-operative Coir Marketing Federation (Coirfed)
3.139 The Kerala State Co-operative Coir Marketing Federation (Coirfed) is the apex federation of primary coir Co-operative societies spread all over Kerala. It is entrusted with the task of procurement of the entire products of the member societies and marketing the product of these co-operative societies which provides sustenance to workers especially women. The value of export of Coirfed has shown a sharp decline from ₹4.19 crore to ₹3.37 crore during 2014-15 compared to previous year.
The National Coir Research and Management Institute (NCRMI)
3.140 The National Coir Research and Management Institute (NCRMI) is a State Government institution set up to strengthen the R&D activities in coir sector to enable the industry in producing more value – added products and products with new designs at reasonable cost. The NCRMI has developed improved version of Defibering Machine with crusher for both green and dry husks with a processing capacity of 600 husks per hour. It has also developed Automatic spinning machine, Willowing machine, Electronic ratt and screener with more productivity, Agri coir cell and fiber softening techniques. It is also developing pneumatic loom for the production of coir geo textiles and acoustic panel for the use in industry.
Foam Mattings India Ltd.( FOMIL)
3.141 FOMIL caters to the needs of domestic and international markets with a wide range of products by its accent on technology; infrastructure and machinery such as its Denmark make Latex Backing Plant producing international quality latex backed mattings, Modern Dye House, Semi Automatic and Fully automatic Power loom, Auxiliary facilities and uninterrupted power system etc. The value of exports from FOMIL has decreased from ₹0.72 crore during 2013-14 to ₹0.50 crore during 2014-15.
Kerala State Coir Workers Welfare Fund Board
3.142 Kerala Coir Workers Welfare Fund Board is a statutory body for the welfare of poor and down trodden coir workers. There are about 4 lakh members in the welfare board. It extends pension and other welfare assistances to members.
Co-operatives in Coir
3.143 Coir co-operative societies play substantial role collecting husk,defibring and producing varities of coir products in Kerala. There are 993 co-operatives registered in coir sector as on March 31st 2015. As per the report of the Coir Directorate 23 new societies were registered in 2014-15. There is also increase in the number of working societies. It increased from 503 to 536, an increase by 33 units. It is evident from the statistics that apart from newly registered 23 societies, the government initiatives turned 10 dormant societies into active production of coir. Details of the societies are shown in Appendix 3.47.
Procurement of Husk and Production of Yarn and Fibre in Co- operative sector
3.144 During 2014-15, the State procured 0.83 crore husk by spending an amount of ₹1.01 crore, purchased 20634.89 tonnes of fibre at a cost of ₹29.06 crore and produced 9071.78 tonnes of yarn worth ₹55.93 crore, through coir co-operative societies. There is an increment in the procurement of husk by coir co-operatives during 2014-15 compared to previous year. Details of the last five years are shown in Appendix 3.48.
Domestic Market Promotion
3.145 Promotion of the sale of coir products in India & elsewhere is one of the important features of Coir Industry. The Domestic Market Promotion includes efforts for enhanced sale of Coir products through various showrooms and sales outlets and also popularizing coir & coir products by way of publicity, organizing exhibition in different parts of the country, through audio and visual media, sales campaign etc.
3.146 In Kerala during 2014-15, 420 coir co-operative societies are working in the yarn sector and 68 Working Societies are there in the product sector. (mats and mattings and small scale produce co-operation). The total number of workers in the yarn sector in the year 2014-15 is reported to be 181134 and in the product sector the total number of workers are 6933.
Export of Coir and Coir Products
3.147 The export of coir and coir products from India in quantity during the year 2014-15 was 626666 MT valued at 1630.34 crore as against 537040 MT valued at 1476.04 crore during the previous year. This recorded an overall increase of 17 per cent in quantity and 11 per cent in value over the export of previous year. Curled coir, coir fibre, coir rugs, coir pith, coir rope, coir yarn, coir geo-textile, handloom matting, Power loom Mats, rubberized coir and other sorts constitutes the major export items of the industry during 2014-15.
3.148 The State Government directly supports coir sector in promotion of export of coir products. The exporters collect products from small scale producers’ co-operatives through Kerala State Coir Corporation (KSCC). Government support this by Purchase Price Stabilisation Scheme. The State Government supports the public sector enterprises, viz. Kerala State Coir Corporation (KSCC), Coirfed and Foam Matings (India) Ltd. (FOMIL) export large quantities of coir products by participating in various national and international exhibitions and B2B conferences. Coir Kerala– an International event on Coir and Natural Fiber Products aimed at exploring and expanding the international market for coir and coir products in consecutive years since 2011 gives impetus to the export of the industry as a whole and particularly the PSUs. The details of export of Coir and Coir Products during last 5 years by Public sector undertakings / Coirfed in Kerala is in Appendix 3.49 and Figure 3.17.
Fig 3.17
Export of coir & coir products by State PSUs from 2010-11 onwards
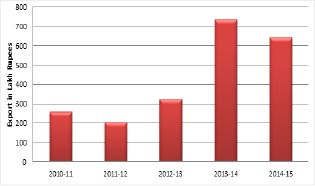
Source: Govt. of India, Directorate of Coir Development, Govt. of Kerala
3.149 The export of coir and coir products of Public Sector Undertaking in Kerala grew considerably in 2013-14. But in 2014-15 a decrease in production and export was registered. At National level growth in production and export is positive, although it fluctuates over years. Figure 3.18 provides the comparison of the growth rates of State PSUs to the nation level of Coir production and export.
Fig 3.18
Comparison of the growth rates of State PSUs to the national level in coir sector
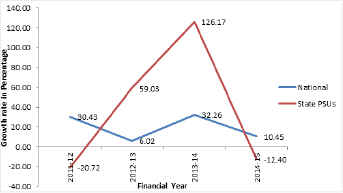
3.150 The State PSUs were able to increase production at substantial rate in 2012-14 after a negative growth in 2011. But they were not able to consolidate the growth in 2014-15 and registered a negative growth (-12.40%).
Major Initiatives in Coir Sector
Coir Kerala 2015
3.151 The conduct of ‘Coir Kerala 2015’ at Alappuzha, an International fair on natural fibre and allied products participating buyers from various countries meet, conferences, exhibitions, seminars and B2B meets were arranged in the event. This also serves as a platform for the entrepreneurs, co-operatives, workers from the whole industry, viz., Defibering, Yarn and Product sector, academics and policy makers meet. This gives impetus to the industry as a whole.
Govt. of India Thrust Areas for Development of Coir Industry
3.152 The thrust areas for development of coir sector in the country are modernisation of production infrastructure by means of appropriate technology without displacement of labour, expansion of export of coir and new products through undertaking market promotion measures abroad, promotion of research and development activities like process improvement, product development and diversification & elimination of drudgery and pollution abatement. Development of skilled manpower through training extension of research and development findings through field demonstration and development of coir industry in all coir producing States in association with the State Government are some of other measures for developing coir industry.
National Coir Policy
3.153 Coir Board has evolved a draft National Coir Policy and Vision 2025 with a view to develop coir industry in a holistic manner. The policy broadly defines the vision of Government of India on coir sector development and the targets to be achieved by 2025. The National Coir Policy aims at,
• Enhancing the utilization of coconut husks available in the coconut producing states for coir fibre
extraction.
• Improving the quality of coir fibre, yarn and products produced in India.
• Women empowerment through value addition of coir products and coir pith.
• Zero wastage in the extraction of fibre and manufacturing process.
• Inventions in product and process for use in betterment of society and environment
• Modernising equipments so as to eliminate drudgery in the production processes and enhance
productivity and quality.
• Addressing the problem of infrastructure bottlenecks
• Supporting modernization and technology up gradation of industry
• Assistance for capacity building in industry
• Providing fuller employment to the existing coir workers and generate additional employment
• Undertaking vigorous research and development activities for finding new areas for coir
• Development of high productivity defibering units and mechanical spinning machines
• Finding new uses for Coir Wood, Coir Pith and explore more business opportunities within India
and abroad.
• Augmenting fibre availability in the country and facilitate high growth and competitiveness of the coir sector
• Developing domestic and export of coir products
• Promoting Consortium approach in the production and marketing of coir products
• Implementing schemes for welfare of coir workers.
• Promoting towns of export excellence in coir in areas of coir production.
Skill upgradation Quality Improvement Mahila Coir Yojana and welfare measures
3.154 Coir Board continued to impart training in processing of coir to artisans and workers engaged in the coir Industry through its training centres ie., National Coir Training and Design Centre (NCT &DC) Kalavoor, Alappuzha and Research cum Extension Centre Tenkasi, Tamil Nadu.
Mahila Coir Yojana
3.155 The Mahila Coir Yojana is the first women oriented self- employment scheme in the Coir Industry which presides self- employment opportunities to the rural women artisan in regions producing coir fibre. The conversion of coir fibre into yarn on national ratt in rural households provides scope for large scale employment, improvement in productivity and quality, better working conditions and higher income to the workers. The scheme envisages distribution of motorised ratts in rural households and provides scope for large scale employment, improvement in productivity & quality, better working conditions and higher income to the workers. The scheme also includes distribution of motorised ratts to women artisans after giving training for spinning coir yarn.
Coir Udyami Yojana
3.156 The Ministry through Coir Board is implementing a Central Sector Scheme of Rejuvenation, Modernisation and Technology Up gradation of Coir Industry (REMOT). Under this scheme, financial assistance is provided for replacement of out-dated ratts/looms and for construction of work sheds so as to increase productivity/ productions and earnings of workers. The selling limit for setting up of coir units under this scheme has been increased to 10 lakhs in spinning sectors and tiny / household sector.
Box 3.12
Achievements of Directorate of Coir Development during 2014-15
- • State Level and Project Level Coir Awards in Coir Sector
- • Market Development Assistance for 23 Coir Mats and Mattings Societies, FOMIL,Coirfed and KSCC
- • Assistance for 196 societies under infrastructure development scheme
- • Workshop conducted for the Secretary/President/Board Members of coir societies
- • Training given to workers of societies on Spinning in Electronic Ratt in Chirayinkeezhu,Kollam, Kayamkulam
- • Production and marketing Incentives given to 321 societies
- • Assistance for 20 societies under Government Share participation scheme
- • Inaugurated Coir Machinery Manufacturing Factory at Alappuzha
- • Conducted Coir Dinam -” November 5”
- • Pension distributed to coir workers for an amount of ₹21,68,77,500/-
Major schemes being implemented by Directorate of Coir Development during 2014-15.
3.157 Following are the major schemes implemented in the coir sector during 2014-15.
1. Regulated Mechanization of Coir Industry intended to modernize the industry
2. Marketing, Publicity, Propaganda, Trade Exhibitions and Assistance for Setting up of Showrooms
3. Coir Kerala-2015 – ‘an International fair on Natural fibre and allied Products’
4. Price Fluctuation Fund intended to stabilize the price of coir fibre, and yarn
5. Cluster Development Programme.
6. Coir Geo Textiles Development Programme intended to implement pilot projects for including Geo textilles as a standard engineering material.
7. Production and Marketing Incentive aims.
8. Market Development Assistance for the Sale of Coir and Coir Products.
3.158 Major challenges and bottlenecks faced by Coir Industry are from within the industry itself. Since it is natural fibre and return to nature is the slogan of the recent times, the industry has a better prospect in future years if it is able to remedy the bottlenecks like weak procurement of coconut husk, increased cost of production, shortage of coir fibre, pollution in traditional method of ratting and husk beating, competition from synthetic materials, lack of professional management and migration of workers to other areas through innovative /scientific/cost effective solutions.
Cashew Industry
3.159 India is the third largest producer of cashew nuts which is the world’s favourite nut and the third widely consumed edible tree nut. In 2013, India’s total production was 7,53,000 metric tons, which accounted for 17 percentage of the total cashew production of 4,439,960 metric tons in the world. The World’s top 5 producers are Vietnam, Nigeria, India, Ivory Coast and Benin.
Table 3.5
Cashew production – World scenario, 2013
No. |
Country |
Production (in MT) |
1 |
Vietnam | 11,10,800 |
2 |
Nigeria | 9,50,000 |
3 |
India |
7,53,000 |
4 |
Ivory Coast | 4,50,000 |
5 |
Benin | 1,80,000 |
|
World Total | 44,39,960 |
Source: faostat3.fao.org – website of Food & Agriculture Organization of the United Nations
Fig 3.19
Cashew World Production (in MT)
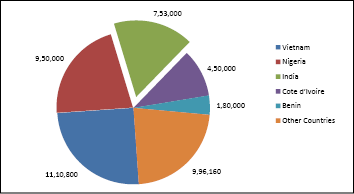
3.160 India stands first in cashew nut processing and processes around 1.59 million tons of cashew nuts every year though only around half of the cashews processed in the country are produced domestically. More than 50 percentage of cashew processing is in the unorganised sector. Due to large processing capacity, India imports raw cashew nuts from other countries. African countries process least quantity of nuts and more than 90% of the raw nuts produced in the region are exported to India, Vietnam and other processing countries.
3.161 India was the first country to enter the global cashew trade. The cashew kernels produced in India are sold both in the international and domestic markets. The major international markets for Indian cashew kernels during 2014-15 were United States of America, United Arab Emirates (UAE), Netherlands, Japan, Saudi Arabia, Germany, Korea DP Republic, the United Kingdom (UK), France, Italy, Spain etc. Among these, considerable increase was noted in exports to Korea DP Rep (83%). According to DGCI&S figures, the total export of cashew kernels from India during 2014-15 was 1,18,952 MT valued at ₹5432.85 crore. There has been an increase of 3.62% in quantity and 7.40% in value in comparison to the export of 1,14,791 MT cashew kernels valued at ₹5058.73 crore during 2013-2014. Cashew kernels exports during 2014-15 is an all time record in terms of value and crossed ₹5400 crore during the year. Among export commodities from India cashew nuts stands in 6th position based on value, as on 2013. foreign exchange earnings of India from cashew industry for the period from 2007-08 to 2014-15 is given in Appendix 3.50.
3.162 India is the third largest consumer of cashew nuts in the world. On an average 150 to 160 thousand MT of cashew kernels produced in India get absorbed in Indian markets where the demand for cashew for consumption has been steadily increasing over the years.
Cashew Industry- Kerala scenario
3.163 Kerala’s contribution to Indian cashew industry is remarkable in the processing and exporting sectors. With approximately 800 cashew processing units/factories functioning in Kerala, the demand for raw cashew nuts is high. Cashew processing in Kerala started as a cottage industry. This traditional industry is mainly concentrated in Kollam District and is highly labour intensive which employs about 2,50,000 workers, majority of whom are women.
3.164 Kerala during 2014-15, was at the 5th position in production of cashew nuts, after Maharashtra, Andhra Pradesh, Orissa and Karnataka, with a production of 80000 MT. The area under cultivation of raw cashew in Kerala is 84530 ha during 2014-15. Among the states Maharashtra and Andhra Pradesh have the major share of the total area under cashew cultivation. Production and yield of cashew in the states which are new to cashew cultivation, like Maharashtra, Andhra Pradesh, Odisha and Tamil Nadu have been increasing and with the state government’s support, these states were adopting high yielding variety seeds for plantation, which gives them high yield per acre in shorter time periods. The production of raw cashew nuts in India for 2009-10 to 2014-15 the last four years is given in Appendix 3.51.
Fig 3.20
State-wise production of Raw Cashewnuts in MT
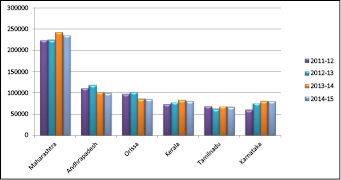
3.165 Major cashewnut growing belts in the State are Kasaragod, Kannur, Malappuram, Kozhikode, Palakkad, Thiruvananthapuram and Kollam and recommended varieties of cashewnut are Madakkathara-1,2, Kanaka, Dhana, Amrutha, K-22-1 and Vridhachalam-3.
3.166 Exports of cashew kernels from Kerala has increased slightly both in terms of quantity and value, during the year 2014-15. In 2014-15, the export of cashew & cashew kernels through Cochin port was 68150 MT, while it was 65679 MT in 2013-14. The import of raw cashew was 213106 MT as against 188485 in the previous year, which is 212% more than the export. The Export of Cashew & Foreign exchange earnings are given in Chapter 6.
3.167 Cashew processing is a highly labour-intensive activity including roasting, shelling, peeling, grading, value addition, and packaging of finished products, which demands the skills of the workers. Hence, problems/issues in the industry with regard to wage rates, welfare, safety and healthy working environment of the workers are to be addressed. Also the problems like supply-demand imbalance, huge mechanisation cost in processing sector and environmental issues are to be addressed, for the sustainable economic development of Cashew sector in the State.
3.168 The Kerala State Cashew Development Corporation (KSCDC) and Kerala State Cashew Workers Apex Co-operative Society (CAPEX) are the two agencies of the State engaged in cashew processing sector in Kerala. CAPEX with headquarters in Kollam, is the apex body of cashew workers primary societies engaged in the procurement of raw cashew nuts and marketing the processed kernels. As on March 2015, CAPEX owns 10 factories with about 4500 workers. The society could provide employment for 232 days in 2014-15 and the turnover increased from ₹6347.86 lakh of previous year to ₹7282.79 lakh, showing a profit of ₹298.77 lakh. During the period from 2012-13 to 2014-15 the number of workers in CAPEX factories has decreased but the turnover has increased by 9 per cent. This is due to the increase in the value of raw cashew nuts & cashew kernels, depreciation of rupees and increased productivity owing to the partial mechanisation of cashew factories. During the period from 2012-13 to 2015-16, Government has provided a total amount of ₹8030 lakh to CAPEX towards the modernisation and partial mechanisation of factories. The performance of CAPEX by the last 4 years from 2012-13 to 2015-16, is given in Appendix 3.52.
3.169 The Kerala State Cashew Development Corporation (KSCDC) has 30 factories with about 13000 workers. The Corporation processes raw cashew nuts and produces value added products. The Corporation could provide employment for 190 days in 2014-15 and 38 days during 2015-16 upto September 2015. Turnover of the corporation in 2014-15 is ₹14690 lakh which is 20 per cent higher than that of the previous year. During the period from 2012-13 to 2014-15 the number of workers in KSCDC factories has decreased by 28 per cent and turnover of the Corporation has increased by 19.5 per cent. During the period from 2012-13 to 2015-16, Government has provided a total amount of ₹12960 lakh to KSCDC towards the modernisation and partial mechanisation of factories, but the amount was not fully utilized for the purpose. The performance of KSCDC during the last 4 years is given in Appendix 3.53. CAPEX and KSCDC together employ about 18000 workers which is about 8% of the total workers in the sector. The rest of the workers are employed in private sector.
Kerala State Agency for the Expansion of Cashew Cultivation (KSACC)
3.170 Kerala State Agency for the Expansion of Cashew Cultivation (KSACC) was constituted by Government of Kerala to overcome the crisis of diminishing area under cashew cultivation in the State. Since 2008, KSACC has been organizing promotional activities in cashew cultivation and distributing cashew grafts of high yielding varieties and providing financial assistance to farmers and institutions in the State. KSACC is the nodal agency for the Cashew cultivation activities in Kerala, approved by NHM (National Horticulture Mission). NHM identified northern districts of the State, such as Kasargod, Kannur, Kozhikode and Malappuram, for the expansion of cashew production. Accordingly, an additional 22150 ha has been brought under the canopy of the project and implemented by KSACC during the period 2008-09 to 2014-15. During 2014-15 KSACC distributed about 6.3 lakh cashew grafts of high yielding varieties to farmers and other public, which can achieve cashew cultivation in 3150 hectares land. During the current financial year, the agency distributed 3.00 lakh grafts under cultivation programme upto 30st September 2015. During the period from 2012-13 to 2015-16, an amount of ₹1810 lakh has been provided to KSACC towards the cultivation of cashew.
Cashew Export Promotion Council of India (CEPCI)
3.171 The Cashew Export Promotion Council of India(CEPCI) was established by the Government of India in the year 1955, with the active cooperation of the cashew industry with the object of promoting exports of cashew kernels and cashew nut shell liquid (CNSL) from India. The Council provides the necessary institutional frame-work for performing the different functions that serve to intensify and promote exports of cashew kernels and cashew nut shell liquid. The Council also serves as a liaison between foreign importers and member exporters and offers investment to producers for the purchase of innovative technology and equipment and operates plan schemes of Government of India. The council has set up a laboratory and technical division of international standards which is recognised as an approved Research Centre for Doctoral research by Kannur University and University of Kerala. The service of CEPC Lab is available to cashew industry as well as entire food processing industry in India and abroad. During 2014-15, 6753 cashew kernels and other samples were analysed in the laboratory
Section 6
Labour and Labour Welfare
3.172 Labourers in Kerala have been protected by intervention of the Government on right to work of one’s choice, right against discrimination, prohibition of child labour, social security, protection of wages, redressal of grievances, right to organize and form trade unions, collective bargaining and participation in management. It is accepted that the labour laws and labour welfare schemes implemented by the State go far beyond that in other parts of the country. The Government is of the view that every employee/ worker should be a member in a Welfare Board and they must be protected by the State throughout their lives. Currently around 33 Labour Welfare Fund Boards exist in the State, of which 16 are under Labour Commissionerate.
3.173 Kerala has been facing challenges in terms of high rate of unemployment and under employment, low rate of productive employment, inadequate levels of skill creation and training, low level of labour force participation and low worker population ratio and so on. Essentially, the State has to create employment opportunities and employment-intensive growth and re-allocate labour force from low-value added activities to high-value added activities.
3.174 Existing labour policy envisages the creation of 15 lakh new jobs within five years. Other thrust areas of State labour policy are unified and consolidated legislation for social security schemes, reprioritisation of allocation of funds to benefit vulnerable workers, long term settlements based on productivity, labour law reforms in tune with the times, amendments to Industrial Disputes Act, revamping of curriculum and course content in industrial training and policy progress monitoring.
Daily Wage Rate
3.175 As compared with other parts of the country, reported wage rate of workers in both agricultural and non-agricultural sectors to Kerala are higher. Average daily wage rate of agricultural and non-agricultural workers in India published by Labour Bureau, Government of India shows that for male general agricultural workers in rural Kerala it is ₹590 (as on June 2015). The national average of the wage rate for this category of workers is only ₹232. The wage rate in Kerala is over 150 percent higher than the National average. Figure 3.21 shows the performance of Kerala in terms of male agricultural workers in rural area with national average and the southern states.
Fig 3.21
Average Daily Wage Rate of Male Agricultural Workers in Rural Kerala
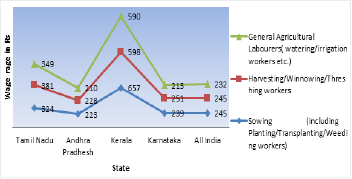
Source: Labour Bureau,Ministry of Labour & Employment,GoI
3.176 For female agricultural workers in rural Kerala, ₹410 is the average daily wage rate compared to the national average ₹177. For sowing and harvesting workers, the wage rate in Kerala are 452 and 403 compared to the national average of ₹196 and ₹206 which is 130 and 95% higher than the National average respectively. A comparission of daily wage rates of female agricultural workers in southern states as on June 2015 is given in the Figure 3.22.
Fig 3.22
Average Daily Wage Rate of Female Agricultural Workers in Rural Kerala
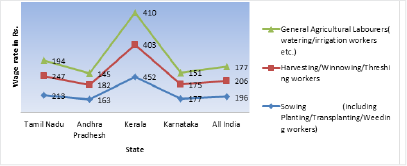
Source: Labour Bureau,Ministry of Labour & Employment,GoI.
3.177 Even though the wage rates of agricultural labourers in rural Kerala are higher than that in other parts of the country, the wage disparity between the male and female workers is noticeable. The male-female wage gap among the rural workers engaged in harvesting/winnowing/threshing is 33 percent ie. female worker wage rate is equals to 67% of male workers’ wage rate. Table 3.6 shows the male-female difference of agricultural workers in Kerala and other southern states of India.
Table 3.6
Wage difference among male and female agricultural workers in Kerala
State |
Sowing (including Planting/Transplanting/Weeding workers) |
Harvesting/Winnowing/Threshing workers |
General Agricultural Labourers |
|||
Wage rate (Female) |
% of women wage rate to men wage gap |
Wage rate (Female) |
% of women wage rate to men |
Wage rate (Female) |
% of women wage rate to men |
|
Tamil Nadu |
213 |
66 |
247 |
65 |
194 |
56 |
Andhra Pradhesh |
163 |
73 |
182 |
80 |
145 |
69 |
Kerala |
452 |
69 |
403 |
67 |
410 |
70 |
Karnataka |
177 |
74 |
175 |
70 |
151 |
71 |
All India |
196 |
80 |
206 |
84 |
177 |
76 |
Note: Wage gap = Wage rate (F) / Wage rate (M) x 100
Source : Compiled data from Labour Bureau,Ministry of Labour & Employment,GoI
3.178 Similar to agricultural workers, the wage rate for non agricultural woekers in rural Kerala is also higher than those in other parts of the country. Figure 3.23 shows the average daily wage rates of the non agricultural workers engaged in different occupations in Kerala. The daily wage rate of a carpenter in Kerala is ₹726, which is 102 % higher than the national average of ₹358. Likewise, the average daily wage rate of a mason in Kerala is ₹737 which is 86% higher than the national average of ₹395.
Fig 3.23
Average Daily Wage Rate of non-agricultural workers in rural Kerala
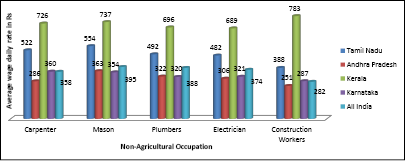
Source: Labour Bureau, Ministry of Labour & Employment, GoI
LFPR and WPR
3.179 Even though labour in Kerala is more literate, the Labour Force Participation Rate (LFPR) and Worker Population Ratio (WPR) for the persons of age group of above 15 are below the national average and this has been a persistent characteristic of the Kerala labour market. The 4th Round of Report on Employment & Unemployment Survey, 2013-14, Labour Bureau, Ministry of Labour & Employment, and Government of India shows that LFPR in Kerala is 49.7% while it is 52.25% for the country as a whole. In rural Kerala LFPR is 50.6% which is one of the lowest among the Indian states. However, in urban Kerala it is 47.7% which is equal or slightly higher than the national average of 47.2%. Among the Indian states, Telangana and Andhra Pradesh report LFPR of 66.3% and 64.5% respectively and are at the top.
Fig 3.24
Labour Force Participation Rate
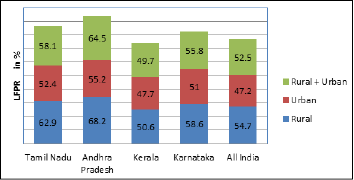
Source : Ministry of Labour & Employment, Government of India.
3.180 For Worker Population Ratio, the national average is 49.9% while it is 43.8% in Kerala.This gap is attributed by the low level of rural WPR of 44.6% which is 16 % lower than the national average. Among the southern states, rural WPR in Andhra Pradesh (66.4%) and Tamil Nadu (61%) are higher.
Fig 3.25
Worker Population Ratio
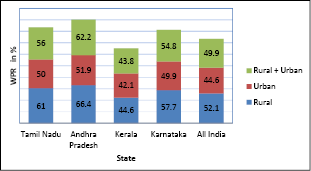
Source : Source : Ministry of Labour & Employment, Government of India.
Composition of Workers
3.181 The labour community in Kerala mainly consists of those who are engaged in the informal sector (loading & unloading, casual work, construction work, brick making self employment etc), traditional industries (coir, cashew, handloom, beedi etc), manufacturing sector (small, medium and large industries), IT industry, units in export promotion zones and those who are seasonally employed.
Industrial Relations
3.182 Healthy relation between employer and employee is the key to sustained industrial development. The responsibility of the Labour Department is to aid and maintain a harmonious balance between the labourers and management to maintain conducive atmosphere for achieving the objective of industrial growth and prosperity in the State.
Fig 3.26
Mandays lost due to strikes and lock outs
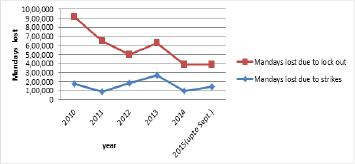
Source: Labour Commissionerate,GoK.
3.183 The man-days lost due to strikes in the State for the year 2014 is 94 thousand against 2.68 lakh in the year 2013. Likewise, in the case of mandays lost due to lock out, the figure for the year 2014 is 2.91 lakh while it was 7.41 lakh in 2010.
3.184 This is despite the fact that for the last ten years, the number of working factories in the state has steadily increased. Appendix 3.54, 3.55 and 3.56 shows the details of man days lost due to strikes, lock outs and layoff in Kerala.
Fig 3.27
Number of Working Factories in Kerala
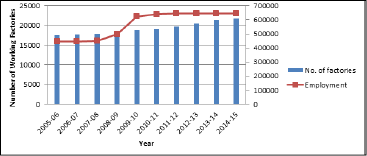
Source: Factories and Boilers Department, GoK
3.185 Number of factories working in the State during 2005-06 was 17486, now it has increased to 21764. Subsequently the average daily employment creation in these factories increased from 4.45 lakh in 2005-06 to 6.46 lakh in 2014. Appendix 3.57. shows number of working factories and employment details in Kerala.
Industrial Disputes
3.186 Providing a platform for raising and settlement of the issues between employee and employer is an essential requirement for ensuring harmonious labour relations in the State. Industrial Dispute Act of 1947 gives the legal framework for the purpose. Number of disputes pending at the beginning of the year increased from 2770 in 2009-10 to 3525 in 2014-15. The total disputes handled during 2009-10 was 5122 and the disputes settled for the same year was 2357.In 2014-15 number of disputes handled is 5445 and settled is 2242. Details of number of disputes in Kerala is given in the Appendix 3.58.
Fig 3.28
Industrial disputes in Kerala
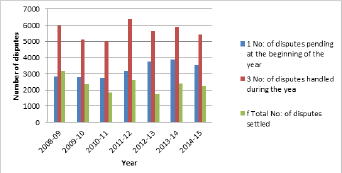
Source: Labour Commissionerate,GoK
Safety of the Factory Workers
3.187 The Department of Factories and Boilers is the statutory authority to ensure safety, health and welfare of all workers in factories and the general public, living in the vicinity of factories. The Department carries out various programmes for the safety of the workers. During 2014-15, 63 priority inspections have been done for studies were completed in hazardous factories, 328 inspections of hazardous factories by specialist inspectors and nine medical examinations of factory workers have been completed. The Department has been conducting training programmes not only for factory workers and employees but also for school children and general public near factory premises.
Employees State Insurance Scheme
3.188 The Employees’ State Insurance Scheme (ESI Scheme) of the Indian Government aims at protecting ‘employees’ against the hazards of sickness, maternity, disability and death due to employment injury and to provide medical care to insured persons and their families. This scheme covers all the employees working in factories running on non-seasonal power that employ 10 or more persons, and factories not using power that employ 20 or more persons. It also includes those working in shops, hotels, restaurants, cinemas, road motor transport undertakings and newspaper establishments. Each insured employee and their employer are required to contribute a certain percentage of their wages to the ESIC every month. These rates are revised from time to time. The ESI Scheme runs like most of the social security schemes. It is a self-financing health insurance scheme and the contributions are raised from covered employees and their employers as a fixed percentage of wages. The payments are to be made on a monthly basis. An employee covered under the scheme has to contribute 1.75% of the wages whereas the employer contributes 4.75% of the wages payable to an employee. The total contribution in respect of an employee thus works out to 6.5% of the wages payable. However, employees earning less than ₹50 a day are exempted from making the contribution. All insured persons and dependants are entitled to free, full and comprehensive medical care under the scheme. This medical care is provided through a network of ESI dispensaries, empanelled clinics, diagnostic centres and ESI hospitals. Super speciality facilities are also offered through empanelled advanced medical institutions. Currently, six types of benefits are provided. These are medical, sickness, maternity, disablement, dependants’ and funeral expenses.In Kerala there are 139 dispensaries whose distribution across the state is given in Figure 3.29. It is to be noted that there is no ESI dispensary in Wayanad.
Fig 3.29
District wise ESI Dispensaries in Kerala
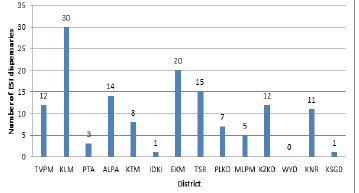
Source: Directorate of Insurance Medical Services, TVPM
Migrant Labour
3.189 The recent trend in the employment sector in the State shows a large inflow of migrant workers from other states such as West Bengal, Bihar, Odisha, Uttar Pradesh, Chhattisgarh, Jharkhand etc. besides the neighbouring State.
Fig 3.30
Origin wise Inter State Migrant Workers in Kerala
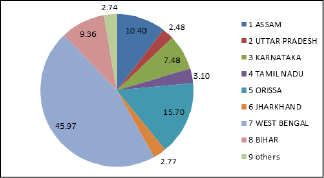
Source: Labour Commissionerate, GoK
3.190 The distribution of migrant workers from different states is given in Figure 3.30. As may be seen out of the total ISM workers 46% are from West Bengal followed by Orissa (16%) and Assam (10%). The distribution of district wise migrated workers in the state shows that Ernakulam has the highest proportion of inter-state migrant workers (17%) followed by Wayanad (13%) and Kannur (12%). Figure 3.31 presents distribution of ISM workers by district. Details are given in the Appendix 3.59.
Fig 3.31
District Wise ISM Workers in Kerala
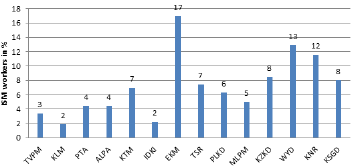
Source: Labour Commissionerate
3.191 The ISM workers are engaged in different areas such as agriculture, construction, hotel and restaurant, manufacturing and trade. It is seen that 60% of the migrant workers are engaged in the construction sectors,8% in manufacturing, 7% under hotels and restaurants, 2% each under trade and agriculture and the remaining 23% workers are engaged under other activities.
Size and Sectoral Composition of Domestic Migrant Labourers in Kerala
3.192 Kerala has witnessed two major transformations during the last four decades. Firstly, migration of labour to the Middle- East, the current stock of which is of the order of 22 lakh. Secondly, almost universal enrolment of children in schools and the elongation of the duration of education meant withdrawal of entry into the labour force in Kerala, or delayed entry. Those who come out of the educational system do not enter a number of sectors such as agriculture, construction and so on. The two processes together have created demand for labour in the Kerala economy which is being met by migrants from all over India.
3.193 Migration of labour from other parts of the country into Kerala began in trickles in the 1990s and was confined to some pockets of the state. Domestic Migrant Labour in Kerala, a study completed in February 2013 adopted a unique train based survey of Domestic Migrant Labour (DML) to estimate their stock and the annual inflow. The train survey covered all the 63 long distance trains entering Kerala through Kasaragod and Palakkad and generated estimates of the stock of DML of over 25 lakhs, annual arrivals of 2.35 lakhs, and remittances of over ₹17, 500 crores a year. Currently, 32 lakh labour would be working in Kerala. They are spread over all parts of the state and all sectors of the economy. Migrant labour is not a homogeneous mass. They are differentiated by language, their state and district of origin, the channels through which they reach Kerala, and the place and sector in which they work.
3.194 Over 75 per cent of the DML come from five states, namely Uttar Pradesh, Assam, West Bengal, Bihar and Orissa. The largely male work force aged 18 to 35 years uses friends and relatives as the main channel of migration, and they mostly work under contractors and get employment for six to seven days a week. Whereas 60 per cent of them are employed in the construction sector, their presence is felt in hospitality, manufacturing, trade and agriculture. The skill sets range from unskilled to skilled carpentry, masonry, electrician and the like. Over 70 per cent of them earn wages above ₹.300 per day, remit ₹.70, 000 per person annually almost entirely through banking channels.
3.195 DML work long hours and are dedicated and sincere; they put in long hours and are ready to do overtime. The normal working day ranges between 8 to 14 hours depending upon the sector, location and type of contract. But they are denied social security benefits. Many of the DML, who have worked outside their states of origin, have been attracted to Kerala by the higher wage level and the prompt payment. The DML often live in crowded rooms with hardly any space to move around: 42% reported seven or more in a room, 13% reported six, 12% reported five, 13% four and 8% reported three in a room. Only about 5% of all DML reported one or two persons in the room. Further, almost 84% of them congregate and 94% do common cooking among their own language groups.
3.196 The size of domestic migrant labour has grown over the years but an understanding of their employment is poor. Little is known about their employment in establishments and their proportions in total workers. A recent study explored this vast area in terms of the incidence, demographic profile, and work life of the migrant labour in Thiruvananthapuram. The study estimated the incidence of employment of migrant labour in the establishments (proportion of establishments hiring at least one migrant labour) in Thiruvananthapuram to be 30.23 per cent. Among the establishments surveyed, hotels and construction activities report incidence of 100 per cent. In dry cleaning centres, the incidence was 66 percent. In vegetable, fruits, and fish selling establishments the incidence was 60 percent and in furniture and wood works 55 per cent. Fifty percent of the hardware and workshops employ migrant labour.
3.197 There is no incidence of migrant labour in establishments like stationary, provisions, medical shops, electricals, mobile shops, petrol pumps, and jewelry shops. Employment of migrant workers in medical shops and electricals is not to be found, probably because it requires a minimum education and fluency in the vernacular language, which rules out the possibility of employment of migrant workers.
3.198 Turning to the proportion of migrant workers in the total workers, 35.18 per cent of labour working in the establishments in Thiruvananthapuram city are migrant labour. Construction sector is not included in the estimation as it is difficult to estimate the total number of labour working on construction sites. As regards variation in proportion of migrant labour across sectors, the highest proportion is in hotels and restaurants (54.29 per cent) followed by groceries (40 per cent). At 39.98 per cent, bakeries and sweet stalls come third. The group of establishments consisting of sawmills, hire shop, shops selling spices, bore well service, cement shops, tile shops and gas agency, report the proportion of migrant workers in the total at 36.63 per cent.
3.199 West Bengal, Assam and Jharkhand account for nearly 71 percent of the total migrant labour in Thiruvananthapuram. About 19 per cent of the migrant labour are from Bihar, and Uttar Pradesh. And the rest are from Orissa, Tamil Nadu, Gujarat, Manipur, and Nepal. The migrants from West Bengal, Assam, Bihar and Uttar Pradesh are seen in almost all sectors. However, the Tamil migrant workers are seen only in few bakeries, tea stalls, and textiles. The Manipuri migrant workers are seen in beauty parlours and Nepali migrants in hotels and Gujaratis in tailoring. Overall, migrant labourers have become the backbone of Kerala economy.
3.200 With the large inflow of migrant workers, their welfare and protection has to be ensured. The schemes for their protection lag in their implementation following the lack of awareness on the part of the migrant workers. This can be related to the language difference as most of the advertisements regarding Government schemes are in English or Malayalam which are not the language of the migrants. The right to the city, which encompasses rights and access to food, housing, education, health, work, and local democracy, should also apply to migrants. Migrants provide a low-cost flexible workforce for the urban informal economy. They often work long hours in poor working conditions, devoid of social security and legal protection .There is a need to ensure that all migrants and their families have access to services and entitlements as enshrined in policies and law, while ensuring urban settlements become inclusive spaces as they expand in size and diversity
Section 7
Employment
Unemployment Situation in Kerala
3.201 One of the major problems that exists in Kerala is unemployment. There is an increase in labour supply due to the increase in the number of women job seekers in various sectors since the 1970’s, has resulted in rapid rise in unemployment in Kerala. Further the growth of educated manpower has increased the demand for white-collared jobs. As there is a lack of job opportunities in our State, which ensure high wages, many are emigrating especially to Gulf countries. Migration of people to foreign countries results in inflow of remittances into the State, which is one of the important drivers of our economy. However, emigration also has several drawbacks and adverse impacts on the domestic economy.
3.202 The Employment and Unemployment Surveys conducted by the National Sample Survey Office (NSSO) are the prime source of data on labour market in India. These surveys are usually conducted every five years. However, recently NSSO carried out two surveys at two year interval in the years 2009-10 and 2011-12. The reason for conducting a survey in 2011-12 in such quick succession was due to the economic conditions in 2009-10. The world wide recession and drought made 2009 a bad base year for comparisons.
3.203 The State records the highest unemployment among the Indian states. According to the latest Survey, Kerala is having the highest Unemployment Rate (UR) under all approaches (See Appendix 3.60 and Figure 3.32). Only two small States viz; Nagaland and Tripura have a higher UR than Kerala. Unemployment in Kerala is found to be over three times the all India average.
Fig 3.32
Unemployment Rate of major States as per 68th
National Sample Surveys (UPSS) – 2011-12 (Age: 15-59 years)
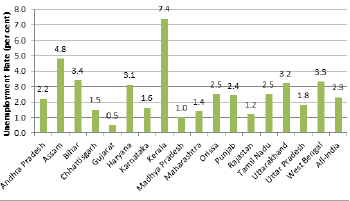
Source: Employment and Unemployment Situation in India, NSS Report No. 554 (NSS 68th Round, July 2011- June 2012)
3.204 As per Usual Principal Subsidiary Status (UPSS) approach, the lowest unemployment rate of 0.5 per cent is estimated in Gujarat. The other major States, which have lower Unemployment Rate than the all India average (2.3 per cent) are Madhya Pradesh (1.0 per cent), Rajasthan (1.2 per cent), Maharashtra (1.4 per cent), Karnataka (1.6 per cent), Uttar Pradesh (1.8 per cent) and Andhra Pradesh (2.2 per cent). Tamil Nadu has an unemployment rate of one-third of Kerala’s rate.
3.205 In Kerala, the unemployment rate is higher in rural areas as compared to urban areas under all approaches (See Figure 3.33). While comparing the unemployment rate of male and female, it is seen that UR is much higher among females as compared to males. A comparison between different estimates of unemployment indicates that the Current Daily Status (CDS) estimate of unemployment is the highest. This scenario reflected both in rural and urban areas. The higher unemployment rates according to the CDS approach compared to the Current Weekly Status (CWS) and usual status approaches (UPS and UPSS) indicate a high degree of intermittent unemployment in Kerala.
Fig 3.33
Unemployment Rate in Kerala under different approaches as per 68th
National Sample Surveys – 2011-12 (Age: 15-59 years)
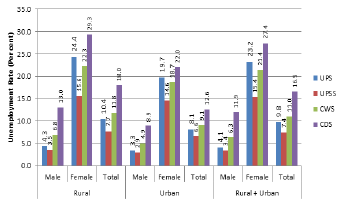
Source: Employment and Unemployment Situation in India, NSS Report No. 554 (NSS 68th Round, July 2011- June 2012)
3.206 Persons aged 15-29 years is considered as youth and in Kerala the youth accounted for about 23 per cent of the total population. It is seen that during 2011-12 the unemployment rate among the youth in Kerala is much higher as compared to that in the overall population. The UR of the youth is 21.7 per cent for rural areas and 18.0 per cent for urban areas. Further the UR among the female youths is much higher than that of the male youth. For instance, in rural Kerala the female UR is 47.4 per cent as against the male UR of 9.7 per cent. (Figure 3.34).
Fig 3.34
Unemployment Rate of the Youth in Kerala and India as per UPSS approach
(68th National Sample Surveys – 2011-12) (Age: 15-29 years)
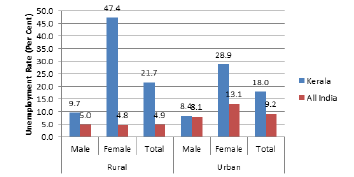
Source: Employment and Unemployment Situation in India, NSS Report No. 554 (NSS 68th Round, July 2011- June 2012)
3.207 Estimates on key indicators reflecting the prevalence of employment/ unemployment in Kerala for all persons based on the surveys conducted by the NSSO in 2009-10 and 2011-12 are given in Appendix 3.61. All India figures may be seen in Appendix 3.62.
Employment in the Organised Sector
3.208 In Kerala, employment in the organised sector is coming down. For instance, persons employed in organised sector decreased from 12.26 lakh in 2000 to 11.4 lakh in 2005 and further to 10.88 lakh in 2013, a reduction of 11.3 per cent over a period of 13 years. This is mainly due to the reduction of persons working in the public sector. However, the number raised marginally to11.29 and 11.36 lakh in 2014 and 2015 respectively.
3.209 The organised sector comprises private and public sectors and it is interesting to note that private sector employment is steadily increasing since 2011in Kerala. For instance, in 2015 out of 11.36 lakh persons employed in the organised sector 5.7 lakh (50.2 per cent) are in the public sector and 5.66 lakh (49.8 per cent) are in the private sector. (See Appendix 3.63 and Figure 3.35). All India figures may be seen at Appendix 3.64.
Fig 3.35
Employment in the Organized Sector- Kerala
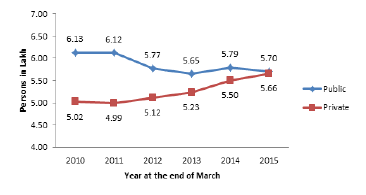
Source: Directorate of Employment, Govt. of Kerala, 2015
3.210 Within the public sector employment as on December 2015, 45 per cent are employed in State Government and 10 per cent are in Central Government, 24 per cent are in state quasi, 5 per cent in LSGI and 16 per cent are in Central quasi institutions. One interesting feature is the decreasing number of Central Government workers over the years (Figure 3.36, Appendix 3.65 and 3.66).
Fig 3.36
Distribution of Employment in Public Sector- December 2015
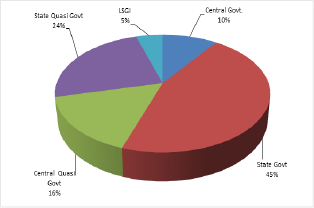
Source: Directorate of Employment, Govt. of Kerala, 2015
3.211 Data on district-wise employment as on March 2015 indicate that Ernakulam and Wayanad are the two districts which respectively accounted for the highest and lowest employment both for Public and Private Sectors. Total organized sector employment in Ernakulum District is 2.00 lakh persons, which accounted for 17.6 per cent of the total employment of the State. Whereas in Wayanad the employment under organized sector is 26,173 persons, which accounted for only 2.3 per cent of the total employment. An interesting point is that men outnumber women in public sector employment, about 66.0 per cent of public sector employment is men (See Appendix 3.67 & Appendix 3.68).
3.212 The sectoral distribution of workers in organised sector across different years indicates that the dependence on agriculture continues to decline; whereas dependence on service sector continues to rise. The employment in agriculture (relative to other sectors) gradually fell from 7.5 per cent in 2004-05 to 5.9 per cent in 2014-15. Whereas, the relative share of employment in Community, Social and Personal Services increased from 44.7 per cent in 2004-05 to 50.43 per cent in 2014-15 (See Appendix 3.69). This indicates that nearly half of the employment is in the community, social and personal services. Manufacturing sector accounted for 20.4 per cent of employment. All India figures may be seen in Appendix 3.70.
Employment in Unorganised Sector
3.213 Unorganised sector constitutes a pivotal part of the Indian economy. More than 90 per cent of workforce and about 50 per cent of the Gross Domestic Product are accounted for by the unorganized economy. A high proportion of socially and economically weaker sections of society are concentrated in the unorganized economic activities in India and Kerala.
3.214 According to the latest employment and unemployment survey carried out by the NSSO as part of the 68th round during 2011-12 it is estimated, as per UPSS approach, self employed workers in Kerala constituted 37.7 per cent of the total workers. Comparatively the percentage share of regular wage/salaried employee accounted for 22.5 per cent and that of casual labour accounted for 39.8 per cent.
3.215 Department of Employment in Kerala is taking measures to reduce instances of unfair practices that exist. Employment in the unorganized sector is carried out usually through private agencies, who sometimes exploit both the service seekers and service providers by exhorting huge commissions from them. A web based interface is proposed to be launched soon to bring both the service seekers and service providers together without the intervention of middle men.
Employment Exchanges and their Services
Registered Job Seekers
3.216 At the national level, as on 31-12-2013, there were 468.03 lakh registered job seekers at the 956 Employment Exchanges all over India. Out of this, 302.54 lakh are men (65.0 per cent) and 165.49 lakh women (35.0 per cent). Year-wise all India registration, placement, vacancies notified, submission made and Live Register for the period 2002 to 2013 are given in Appendix 3.71.
3.217 The main feature of live registers of employment exchanges in Kerala till 2012 was that the numbers of work seekers were increasing year after year mainly due to non-updation of lapsed registrations. The Employment Department has recently computerized live registers for making verifications. As a result the number of work seekers in the live registers of the employment exchanges in Kerala has decreased significantly.
3.218 According to live registers of employment exchanges in Kerala, the total number of work seekers as on 31st December 2012 was 44.99 lakh. But it has now declined to 36.57 lakh as on 31st December 2015, a reduction of about 8.42 lakh; mainly due to the computerisation of live registers and removal of lapsed registrations. Details of work seekers for various years may be seen at Appendix 3.72.
3.219 Contrary to the all India scenario women are found to be more in the live registers in Kerala. Of the total job seekers 56 percent (20.53 lakh) are women. Number of illiterate persons in the Live Register is 168. Distribution of job seekers by educational level indicates that only 11 per cent have qualification below SSLC. About 59 per cent of the work seekers are in the category of qualifications having SSLC. (Figure 3.37 and Appendix 3.73).
Fig 3.37
Registered job seekers in Employment Exchanges - Kerala
(As on 31st October 2015)
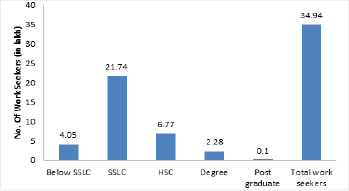
Source: Directorate of Employment, Govt. of Kerala, 2015
3.220 The number of professional & technical work seekers as on 31st October 2015 is 1.63 lakh. Data reveal that ITI certificate holders and Diploma holders in Engineering together constitute 97 per cent of the total professional & technical work seekers. There are 23,984 registered Engineering Graduates (Appendix 3.74).
3.221 A significant and peculiar feature of Kerala is that women outnumber men who seek employment through employment exchanges. This position is reflected in all districts in Kerala except Alappuzha,Kottyam and Idukki. The district-wise work seekers in Kerala is shown in the following graph (See Figure 3.38).
Fig 3.38
Work Seekers in Kerala as on 31-12-2015
(Status of Men and Women)
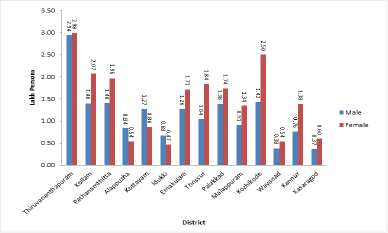
Source: Directorate of Employment, Govt. of Kerala, 2015
3.222 Thiruvananthapuram District ranks first in the number of work seekers in general and professional/technical categories as on 31-12-2015. The total number of work seekers in Thiruvananthapuram district is 5.9 lakh; of which 2.98 lakh are women and 2.94 lakh men. The second largest number of work seekers is in Kozhikode district with 3.9 lakh persons. The lowest number of work seekers is in Wayanad district with 0.92 lakh persons, preceded by Kasargode District with 0.97 lakh persons. Male work seekers exceed female is only three districts, Alappuzha, Kottayam and Idukki. (Appendix 3.75).
3.223 All registered job seekers cannot be treated as unemployed. Youngsters register their names mainly for Government jobs while many of them may be engaged in some useful productive work or might have migrated to other states or foreign countries for employment. Even though the live registers have been computerized, no effective mechanism is put in place to find out those persons who are engaged in useful productive work. It is essential that live registers reflect the actual unemployment position of the State so as to enable the Government to formulate policies and programmes for the real unemployed persons in a meaningful way. The government conducted a job fair’Niyukthi-2015’during 2014-15, The details are provided in Box 3.13.
Box 3.13
Niyukthi-2015
Niyukthi-2015 was a Mega Recruitment Drive conducted by the Government of Kerala through the Employment Department. Deviating from the traditional way of conducting job fairs, modern technologies like dedicated software, ‘whatsapp’ technology was used and hitherto-new event-management technology by the government officials, orientation programme for job seekers, pre-employers meet for the employers etc, were held .This mega event in which 42821 jobseekers participated, was held in 5 centers in the State and 17875 candidates got placed.
3.224 In 2015-16, the government launched the Comprehensive Mission on Employment Generation (MEGA), single overarching mechanism designed to provide holistic direction and oversight to self employment programmes implemented by various governmental agencies and Banks. Details of MEGA may be found in Chapter 9.
Self Employment Schemes implemented through Employment Exchanges
3.225 Three self employment schemes are implemented through the Employment Exchanges in Kerala. ‘Kerala Self Employment Scheme for the Registered Unemployed’ (KESRU) is being implemented since 1999 and is intended for unemployed persons in the live register between the age 21 - 50 years with annual family income not exceeding ₹.40,000 and individual income below ₹500 per month. Bank loan up to ₹1.00 lakh with a 20 per cent subsidy is given for self employment ventures.
3.226 ‘Multi-Purpose Service Centers/Job Clubs (MPSC/JC) is a group oriented self-employment scheme for development of enterprises in the unorganised sector. Bank loan up to ₹10 lakh with a maximum of ₹2 lakh as subsidy is given for starting self-employment group ventures of 2 to 5 members, who are unemployed persons in the live registers in the age group of 21-40 years.
3.227 ‘Employment Scheme for the Destitute Women’ (Saranya) is a scheme for uplifting the most backward and segregated women in the State, namely widows, divorced, deserted, spinsters above the age of 30 and unwedded mothers of Scheduled Tribe. Under this scheme interest free bank loan upto ₹50,000 with a 50 per cent subsidy (maximum ₹25,000) is given for starting self-employment ventures.
Unemployment Assistance
3.228 Government of Kerala has introduced an unemployment assistance scheme in 1982. Under the scheme, unemployed youths remaining in the live registers for over three years (physically challenged two years) after attaining the age of 18 and having passed SSLC (but the SC/ST & physically Challenged candidate need to have only appeared for SSLC examination) and having annual family income below rupees 12,000 and personal income below rupees100 per month are eligible for an unemployment assistance of ₹120 per month up to the age of 35 years of age. During the year 2015 an amount of ₹37.37 crore was disbursed to 196123 beneficiaries.
3.229 As per the Kerala Panchayat Raj Act (1994) and Kerala Municipality Act (1994), the scheme of unemployment assistance has been transferred to Grama Panchayats and Urban Local Governments since 1998. The eligible candidates can submit their application for unemployment allowance in the prescribed form to the local government concerned. The Welfare Standing Committee at the Local Governments scrutinizes the application based on the eligibility criteria and decides the eligible candidates.
Placement through Employment Exchanges in Kerala
3.230 The placement through Employment Exchanges in Kerala has been declining since 2010. Total placement has declined from 12643 in 2010 to 5855 in 2015. Reduction in placement may be due to temporary posts either being filled up on daily wage/contract basis or being kept vacant. The placement through employment exchanges in Kerala since 2010 is shown in Figure 3.39.
Fig 3.39
Placement through Employment Exchanges –Kerala
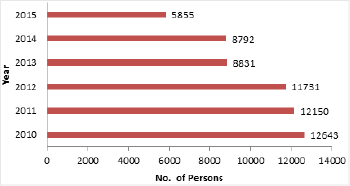
Source: Directorate of Employment, Govt. of Kerala, 2015
Outlook
There are not the best of times for industry and labour. In a situation of slide in growth following the global financial crisis emerging economies were a counter force. But crisis has overtaken the emerging economies too, almost all of them at the same time. The euphoria surrounding Indian high growth too has come under a cloud. Kerala never had great strength in manufacturing. But some of the traditional industries have shown better performance this year. Bad times for industry are bad times for labour as well. Kerala has taken some major steps is upgrading the skills of labour and for boosting entrepreneurship. Skill training has begun making strides in the State. A boost to entrepreneurship is the Comprehensive Mission on Employment Generation. When the tides turn for the better our workers who are better prepared will be the first to take advantage of it. The State needs to promote its small and medium enterprises and enhands its competitiveness. Entreperneurship, Innovation and skill development are the buzzwords to develop a strong industrial base in the State.