Chapter 4
SOCIAL SERVICE

Introduction
Kerala’s development and achievements on social front has been lauded in both national and international circles. The progress made in the realm of education, health and gender development have been noteworthy. The State has been much ahead of the rest of the states in terms of access to basic services including education and medical care and in improving the socio-economic conditions of SC/ST. This has been achieved mainly through large scale intervention and targeted efforts by the Government. However, the efforts needs to be sustained to maintain and even achieve higher levels of social development. Further the emerging challenges in each sector needs to be addressed to make the growth process more inclusive.
.
Section 1
Education
The development experience of Kerala has always invoked long and interesting discussions about the links between economic and social development in the context of third world countries. Kerala’s achievements in human development indicators are often considered unparalleled in the whole developing World and is often compared with the development indices of advanced countries. Kerala’s particular development experience of high human development achievements against low per capita income level was mainly attributed to the State’s public intervention in health and education sectors.
4.2 Throughout the discussion on the State’s achievements in human development, education has occupied a prime place. In fact, education has always had a central role in determining Kerala’s performance in social development. The early attempts during the 19th and early 20thcenturies – much before India became independent – made by the princely states and Christian missionaries to open schools in the different parts of the region were the first steps in Kerala’s journey towards a glorious educational development of the State. The network of educational institutions established during the early modern period coupled with other factors such as the social reform movements and the Government intervention helped the State to strengthen its foundation in this regard. In the early 1990s Kerala became the first ever State in the Indian union to attain universal literacy. The State has also managed to implement policies effectively to make elementary education accessible for its whole population, much ahead of other Indian States.
4.3 Inspite of its remarkable achievements in the education sector in the State, there are prominent gaps when it comes to quality of education being imparted in the State. The same remains true while considering the achievements of the State in the higher education sectors. In this context the State of Kerala is re-orienting its approaches and the institutional arrangements. The State Planning Board has constituted two expert committees. The first Committee, constituted under the chairmanship of Prof. N.R. Madhva Menon, examined the Plan Programmes of the State with a view to maximise access to central schemes and plan resources and prepare an action plan suggesting steps to remove barriers in accessing resources and difficulties in implementation particularly in the areas of higher and technical education. The committee has submitted its report.The second Committee constituted under the chairmanship of Prof. P.O.J. Lebba, looked into the various aspects of the quality of school education in the State and submitted its report with several recommendations to improve the quality of school education.
Expenditure on Education
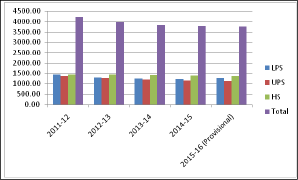
4.4 During the first year of the XIIth Plan an amount of ₹.. 590.24 crore had been earmarked for Education sector of which 98.78 % was expended and the outlay has increased significantly during these four years with an outlay of ₹.1044.62 crore in 2015-16. The percentage share of higher education has significantly increased over these four years whereas outlay of technical education has slightly increased during this period. General education gets more than 80% of the total allocation in all these four years. It is also seen that the percentage allocation for technical education is lower, but its percentage expenditure is better. Though the total outlay for all the three sub- sectors is increasing over these four years (See Figure 4.1), the percentage share of school education shows a declining trend during this period. It decreased from 56% in 2012-13 to 33% in 2015-16. This may be due to the fact that the State had achieved most of the primary targets in school education and it has yet to find out new areas of public expenditure for improving the quality of school education. Average Plan Outlay & Expenditure during the first four years of XIIth Plan is given in Table 4.1
Table 4.1
Average Plan Outlay & Expenditure during the first four years of XIIth Plan
(₹. in Crore)
Sectors |
Annual Plan 2012-13 |
Annual Plan 2013-14 |
Annual Plan 2014-15 |
Annual Plan 2015-16 |
||||||||
Outlay |
Exp. |
% of Exp |
Outlay |
Exp. |
% of Exp |
Outlay |
Exp. |
% of Exp |
Outlay |
Exp up to Nov 2015 |
% of Exp |
|
1.School Education |
287.15 |
286.54 |
99.79 |
333.15 |
220.2 |
66.1 |
336.81 |
226.63 |
67.29 |
349.75 |
78.37 |
22.41 |
2. Higher Education |
202 |
154.15 |
76.31 |
247.99 |
154.15 |
62.16 |
367.97 |
207.29 |
56.34 |
510.42 |
98.15 |
19.23 |
General Education |
489.15 |
440.69 |
90.09 |
581.14 |
374.35 |
64.41 |
704.78 |
433.93 |
61.57 |
860.17 |
176.52 |
20.52 |
3.Technical Education |
101.09 |
142.33 |
140.95 |
117.86 |
96.95 |
82.33 |
143.22 |
106.44 |
74.32 |
184.45 |
48.75 |
26.43 |
Total |
590.24 |
583.02 |
98.78 |
699 |
471.3 |
67.42 |
848 |
540.37 |
63.72 |
1044.62 |
225.27 |
21.56 |
Source: Annual Plan Document
Fig 4.1
Trend of sector wise outlay for Education for the first four years of 12th Plan
(₹. in Crore)

Source: Annual Plan document, 2016
Literacy
4.5 Literacy and education are important indicators in a society and play a central role in human development. As regards literacy, Kerala ranks first in the country with literacy rate of 93.91% closely followed by Lakshadweep (92.28%) and Mizoram (91.58%) (Census of India, 2011). Kerala’s literacy rate, which was only 47.18 % in 1951, has almost doubled by 2011. The male, female literacy gap which was 22% in 1951 has narrowed down to 4.41% in 2011. Kerala holds the first place in the country in female literacy with 92% and Rajasthan records the lowest female literacy rate (52.66%) (Census of India, 2011). Literacy rate of the State from 1951 to 2014 is shown in Appendix 4.1.
4.6 Variation in literacy rate among the districts of Kerala is low. While Pathanamthitta district (96.93%) reports the highest literacy rate in the State followed by Kottayam (96.4%) and Alappuzha (96.26%), Palakkad district has the lowest literacy rate in the State (88.49%). The low rate of literacy of Palakkad district may be due to the prevalence of substantial percentage of Scheduled Caste (SC) and Scheduled Tribe (ST) population in the district. 11.01% of the ST population in the State reporting an average literacy of 74.44% is residing in the district. (The share of ST population in the district population is 1.67%). The share of SC population in the district population is the highest in the State. Literacy rate by sex for districts in 2003 and 2015 is given in Appendix 4.2.
4.7 Kerala State Literacy Mission has been implementing literacy and equivalency programmes by appointing ‘Preraks’ (representatives of centre for propagating and continuing literacy programmes). Details of the number of people benefiting from equivalency programme of Literacy Mission from 2005 to 2015 are given in Appendix 4.3. It is seen that the number of persons attending up the 7th equivalency examination is steadily decreasing. Over these 10 years, it decreased from 11631 in 2005 to 3492 in 2015. The indications are that illiteracy has almost been eradicated.
Right to Education Act
4.8 The Right of Children to Free and Compulsory Education (RTE) Act, 2009, was enacted by the Parliament of India, which came into existence on 1st April, 2010. The Act describes the norms and standards of the free and compulsory education for children between 6-14 in India under Article 21-A of Indian constitution. By enacting this Act, India became one of the countries to make education a fundamental right of every child. The Act gives every child the right to quality elementary education. It requires the private schools to reserve some seats for poor categories and it also prohibits all unrecognised schools from practice, and makes provisions for no donation or interview of child or parent.
School Education
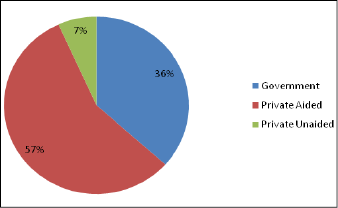
4.9 There were 12615 schools in Kerala in 2014-15: 4619 (36%) government schools, 7145 (57%) aided schools and 851(7%) unaided schools (Figure 4.2). More Government schools are functioning in lower primary section than upper primary or high school sections. Aided schools outnumber government schools in all sections.
Fig 4.2
Management wise share of schools in the State-2014-15
4.10 Malappuram District has the largest number of schools (1489) in the State followed by Kannur (1289) and Kozhikode (1237). Malappuram also has the largest number of government (546) and unaided schools (162) in the State. But the largest number of aided schools are functioning in Kannur district (959). Details of district-wise, management wise and stage-wise number of schools in Kerala during 2014-15 are given in Appendix 4.4.
4.11 There are 1373 schools in the State which are offering syllabi other than the one prescribed by the State government. These include 1178 CBSE schools, 148 ICSE schools, 33 Kendriya Vidyalaya and 14 JawaharNavodayas. One Jawahar NavodayaVidyalaya school each is functioning in all the districts. District-wise details of schools with syllabi other than state syllabus in the year 2014-15 are given in Appendix 4.5.
Box 4.1
Expert Committee on School Education
Inspite of the high educational attainments in terms of literacy, enrolment, gender parity in educational indicators, school infrastructure etc., the quality of education has been deteriorating in Kerala since recent years. In this context, as per the decision of 12th Board Meeting held on 14-05-2014, Kerala State Planning Board constituted an Expert Committee under the Chairmanship of Prof P O J Lebba for making recommendations for improving the school education system. The Committee met five times and several stakeholders meetings were held. The Committee submitted its recommendations in December, 2015 by addressing several aspects related to the quality of education.
Specific recommendations have been made on (i) teaching, assessment and learning outcomes, (ii) recruitment of teachers, (iii) school governance, (v) school infrastructure and teaching materials, (vi) synchronization of different agencies, (vii) pre-school education, (viii) children with special needs, (viii) arts, crafts and physical education and (ix) approval and accreditation to schools.
Source:State Planning Board 2015.
Physical Infrastructure and Facilities in Government Schools
4.12 All the Government Schools in Kerala are functioning in pucca buildings. Own buildings have to be constructed for 128 government schools which are now working in rented buildings. District-wise details of government schools having building facilities are given in Appendix 4.6.
4.13 Local Self Government Institutions and programmes like Sarva Shiksha Abhiyan (SSA) have contributed much to the overall development and improvement of physical infrastructure and common facilities in government schools in the State. Data show that 98.55% of government schools have access to drinking water and 99.7% have urinals/latrine facilities. District–wise details of government schools having drinking water/latrines/urinal facilities in Kerala in 2014-15 are given in Appendix 4.7.
Enrolment of Students
4.14 Enrolment of students in the State has been declining in recent years; the number has declined from 37.9 lakh in 2014-15 to 37.7 lakh in 2015-16 (provisional). Change in demographic pattern of the State due to low birth rate is the main reason attributed for this phenomenon. The decline in the number of students in Lower Primary (LP) section is 11782 numbers in 2014-15 from 2013-14. While the decline in Upper Primary (UP) section is 38406 numbers in 2014-15, and the High School (HS) section shows a decrease of 8652 students over the previous year. The stage-wise enrolment of students in schools in Kerala from 2011-12 to 2015-16 are given in Appendix 4.8. Details of management-wise and standard wise enrolment of students in schools in Kerala during 2015-16 are given in Appendix 4.9. District-wise stage-wise and sex-wise enrolment of students in schools in the State during 2015-16 is given in Appendix 4.10. The section wise decrease in the enrolment of students in schools is shown in Figure-4.3.
Fig 4.3
Stage-wise Enrolment of Students (in 1000s) in Schools in Kerala
Source:Directorate of Public Instruction
Enrolment of Girl students
4.15 Girl students constitute 49.43% of the total student enrolment in schools. Boys outnumbered girls in all the districts, except Thiruvananthapuram and Alappuzha. In Thrissur, more girls are enrolled in the LP and UP sections. The gender gap exists in Kerala also in terms of enrolment, though the gap is narrow compared to other parts of the country.
Strength of Scheduled Caste and Scheduled Tribe Students
4.16 In 2015-16, Scheduled Caste (SC) students constitute 10.82% of total students in the State. The percentage of SC students in government schools, private aided schools and private unaided schools are 13.66%, 10.59% and 4.03% respectively. It is seen that the percentage of SC students in government schools is higher than that in private aided and private unaided schools. But the number of Scheduled Caste students in private aided schools is 50 percent higher than those in government schools.
4.17 ST students constitute 2.1% of total enrolment in schools in the year 2015-16. The percentage of ST students in government schools, private aided schools and private unaided schools are 3.92%, 1.47% and 0.35% respectively in 2015-16. The standard-wise strength of SC/ST students in the State in 2015-16 is given in Appendix 4.11. Out of the total number of SC/ST students in the State, only 4% of SC and 1.8 % of ST students are enrolled in private unaided schools. The rest are admitted in government and private aided schools. Percentage of Enrolment of SC/ST students in Schools is provided in Table 4.2.
Table 4.2
Percentage of Enrolment of SC/ST students in Schools
Management |
Others |
SC |
ST |
Total |
Government |
82.42 |
13.66 |
3.92 |
100 |
Private Aided |
87.94 |
10.59 |
1.47 |
100 |
Private Unaided |
95.62 |
4.03 |
0.35 |
100 |
Source: Directorate of Public Instruction
Drop-out rate
4.18 Kerala has achieved the distinction of having the lowest dropout rate of school students among the Indian states. In the year 2013-14, dropout ratio among school students in Kerala was 0.27%. The dropout ratios in Lower Primary stage and High School stage are higher compared to that of the UP stage. Dropout rate is highest among high school students.
4.19 Among the Districts, Idukki has the highest dropout ratio in the lower primary section (0.89%). In upper primary section and high school, Wayanad has the highest ratios with 0.98% and 2.62% respectively. The high dropout ratio may be attributed to the higher population of Scheduled Tribe students in these districts. District-wise/stage-wise dropout ratio in schools in 2013-14 is given in Appendix 4.12. Drop-out ratio among SC students in Kerala during 2013-14 was 0.28% and that of ST students was 2.63%. District wise and stage wise details of drop out among SC and ST students in Kerala for the year 2013-14 are given in Appendix 4.13 & 4.14.
Number of Teachers
4.20 The number of school teachers in Kerala, including Teachers Training Institute (TTI) teachers, during 2014-15 was 164154. Of the total, 97875 (59.62%) teachers are working in aided schools and 12431 (7.57%) teachers are working in private unaided schools. The remaining 32.8 % of teachers are working in government schools. 51.79% of total teachers in the State are teaching in high schools, 24.74% in upper primary schools, 23.03% in lower primary schools and the remaining (0.44%) in TTI’s. 71.85% of total teachers in the State are women. Stage-wise and management-wise number of teachers in Kerala during 2014-15 is given in Appendix 4.15.
Uneconomic Schools
4.21 Schools with insufficient strength of pupils are termed as uneconomic schools. In 2014-15, there were 5573 uneconomic schools in the State, which was an increase of 161 schools over the previous year. Out of these, 2586 were government schools and 2987 were in the aided sector. District-wise analysis shows that highest number of uneconomic schools was in Kannur (743) followed by Kottayam (554), Kozhikode (528) and Pathanamthitta (523). The highest number of uneconomic schools in aided sector is in Kannur (599) followed by Kozhikode (379). In the government sector, Thiruvananthapuram has the largest (306) number of uneconomic schools followed by Ernakulam and Kottayam (267). Among the government uneconomic schools, 73.63% are lower primary schools. In the aided sector also 79.5% of uneconomic schools are from lower primary section. District wise details of uneconomic schools in the State in 2014-15 are given in Appendix 4.16.
Box 4.2
Ente-School - A model project on Comprehensive Education,
Thaliparamba Constituency
As an initiative to impart quality and comprehensive education in government and aided schools, “Ente School” project is being implemented in 115 schools in Thaliparamba constituency. The problems of schools which are situated in remote places and deprived of infrastructural facilities are addressed through convergence of MLA and MP funds, fund from local bodies, PTA initiatives and other sponsorships. Attractive school buildings and class rooms, clean toilets, access to drinking water, computer labs, libraries etc. have been made available in all 115 schools. The Information and Communication Technology is well introduced in the elementary classes and changes have been made in the class rooms in order to equip the challenges of ICT. Instead of teaching ICT as an isolated subject, it is incorporated to all subjects. Digital technology is used to impart ideas in languages, mathematics and science so that each student gets moulded in to an individual with unique personality. English language is given more importance and as a part of it, ‘English Theatre’ has been incepted in all schools. A Large Format Visual Display System is given to the schools through ‘IT @School’. Dramas and short films based on English text books are prepared and performed by the students. “Ente School” is a model project as it is implemented in all the schools in a comprehensive manner.
Source: Report from District Planning Office, Kannur
Sarva Shiksha Abhiyan (SSA)
4.22 Sarva Shiksha Abhiyaan was introduced in 2000-2001 as a flagship programme of Government of India to provide useful and relevant elementary education for all children in the age group of 6 to 14 by 2010. The programme seeks active participation of the community in the management of schools without social, regional, economic and gender barriers. It comprises all activities of school education-providing physical infrastructure, free text book for children, encouraging enrolment of girls and teacher training. The sharing of funds between the central and the state governments was 75:25 in the Tenth Plan. The funding pattern has been modified to 60:40 now.
Higher Secondary Education
4.23 Higher Secondary courses were introduced in the State during 1990-91 to reorganize the secondary level of education in accordance with National Education Policy. Higher Secondary Course is the turning point in the entire school education in our State. There were 2071 Higher Secondary Schools in 2015 in the State. Out of these, 832 (40.17%) are Government schools, 850 (41.04%) are Aided schools and the remaining 389(18.78%) are Unaided and technical schools. Among the districts Malappuram has the largest number of Higher Secondary Schools (246 ) in the State followed by Ernakulam (209 ) and Thrissur (204 ) respectively.
4.24 There are 7237 batches of higher secondary classes in 2015. The enrolment in Higher Secondary Schools was 3,79,880. Malappuram had the largest no of batches (1076) with an enrolment capacity of 53,129 students. District wise/Management-wise number of Higher Secondary Schools and number of batches are given in Appendix 4.17 and District wise enrolment of students in Higher Secondary Schools are given in Appendix 4.18.
4.25 The pass percentage of students in higher secondary courses increased to 74.89% in 2014-15 from 72.85 % in 2013-14. During 2014-15, 11,173 students secured A+ for all subjects and 2,88,642 students were eligible for higher studies. The details are given in Appendices 4.19 & 4.20. The pass percentage of SC and ST students in Higher Secondary Schools also increased in 2014-15 compared to 2013-14.The pass percentage of SC students increased from 57.29% to 60.84% and ST students from 55.28% to 61.39% during 2014-15. Details are given in Appendix 4.21 & 4.22.
Fig 4.4
Pass Percentage of Higher Secondary Students over the last three years
Source: Directorate of Higher Secondary Education
Vocational Higher Secondary Education
4.26 Vocational higher secondary education was introduced in the State in 1983-84. Vocational higher secondary education in the State imparts education at plus two level with the objective of achieving self/wage/direct employment as well as vertical mobility. There are 389 Vocational Higher Secondary Schools in the State with a total of 1100 batches. Out of these 261 are in the Government sector and 128 in the Aided sector. Kollam (52) followed by Thiruvananthapuram (41) has the largest number of Vocational Higher Secondary Schools in the State. District wise details of Vocational Higher Secondary Schools and courses during 2015-16 are given in Appendix 4.23.
4.27 The percentage of students eligible for higher education in Vocational Higher Secondary examination in March 2015 is 80.54% registering a fall from 89.16% in March 2014. The number of students who appeared and those who passed Vocational Higher Secondary examination from 2010 to 2015 and the results of school going students are given in Appendix 4.24 & 4.25.
University and Higher Education
4.28 The US politician and educationist Ron Lewis once stated that “Ensuring quality higher education is one of the most important things we can do for future generations”. The statement makes fine sense in the context of growing realization of the significance of higher education in any society. In the absence of a well-educated workforce, an economy is bound to show a downward slide in the long run. Having sufficient opportunities for higher education is an essential element for any economy to do well. However, the significance of higher education can’t just be restricted to the sphere of economy and workforce; rather it should be understood against the broader possibility of conditioning future citizens who are not only competent as a workforce but are also responsible citizens who can address the social needs in a mature and responsible manner.
4.29 Systems of higher education have also a critical impact in sustaining social integrity and a larger sense of social brotherhood. This is the context in which the XIIth Plan Document issued the statement that ‘higher education needs to be viewed as a long-term social investment for the promotion of economic growth, cultural development, social cohesion, equity and justice’. It is viewed that there must be a strategic shift from mere expansion to improvement in quality higher education. As a consequence, enrolment in higher education would have to be significantly increased in a demand driven manner.
4.30 Government of India has proposed a new scheme named Rashtriya Uchchatar Shiksha Abhiyan for funding the State Universities and Colleges. The scheme is envisaged as a prime vehicle for strategic funding of state institutions to ensure that issues of access, equity and quality are addressed in an equitable manner with the state as a composite unit of planning.
4.31 There are 14 universities functioning in the State. Out of these, four universities viz. Kerala, Mahatma Gandhi, Calicut and Kannur are general in nature and are offering various courses. SreeSankaracharya University of Sanskrit, Thunchath Ezhuthachan Malayalam University, Cochin University of Science and Technology, Kerala Agricultural University, Kerala Veterinary and Animal Science University, Kerala University of Health Sciences, Kerala University of Fisheries and Ocean Studies, Kerala Technological University offer specialized courses in specified subject areas. Besides these, the National University of Advanced Legal Studies (NUALS) established in 2005 and a Central University incepted in Kasargod district are also functioning in the State.
Autonomous Colleges in Kerala
4.32 The affiliating system of colleges was originally designed when their number in a university was small. The university could then effectively oversee the working of the colleges, act as a body conducting examination and award degrees on their behalf. The system has now become unwieldy and it is becoming increasingly difficult for a university to attend to the varied needs of individual colleges. The colleges do not have the freedom to modernize their curricula or make them locally relevant. The regulations of the university and its common system, governing all colleges alike, irrespective of their characteristic strengths, weaknesses and locations, have affected the academic development of individual colleges. Colleges that have the potential for offering programmes of a higher standard do not have the freedom to offer them. Highlighting the importance of autonomous colleges, the UGC document on the XI Plan profile of higher education in India clearly states that: “The only safe and better way to improve the quality of undergraduate education is to delink most of the colleges from the affiliating structure. Colleges with academic and operative freedom are doing better and have more credibility. The financial support to such colleges boosts the concept of autonomy.”
4.33 The Committee on autonomy for institutions of higher education in Kerala stated in its report that there are colleges in Kerala in the Government and private sectors which deserve autonomy and which can prove their full academic potential if only greater freedom is given to take risks with responsibility. The Committee strongly recommended that Kerala should introduce this reform without further delay. In the Budget speech of 2013, the Finance Minister of the State has announced the policy decision of granting autonomy to the deserving colleges in the State. The University Grants Commission (UGC) has granted autonomous status to nine colleges in the State for the 2014-15 academic year. The colleges are Maharaja’s College, Ernakulam; Mar Ivanios College, Thiruvananthapuram; Fatima Mata National College, Kollam; SB College, Changanassery; St. Teresa’s College, Ernakulam; Sacred Heart College, Thevara; Rajagiri College of Social Sciences, Kochi; St. Thomas College, Thrissur and St. Thomas College, Devagiri.
Arts and Science Colleges
4.34 There are 210 Arts and Science Colleges in the State comprising of 152 Private Aided Colleges and 58 Government Colleges. In 2014-15, Ernakulam (25) had the largest number of Arts and Science colleges in the State followed by Thiruvananthapuram, Kottayam and Thrissur (22). Thiruvananthapuram and Kozhikode have the largest number of Government colleges (10) in the State. District-wise number of Arts and Science colleges in the State in 2014-15 is given in Appendix 4.26.
Enrolment of Students
4.35 Total number of students enrolled in various Arts and Science colleges (excluding unaided colleges) under the four general universities in Kerala during 2014-15 is 2.27 lakh. Of this 1.56 lakh (68.66%) are girls. Number of students Enroled in Arts and Science Colleges is given in Table 4.3.
Table 4.3
Enrolment of Students in Arts and Science Colleges
Course |
Total Students |
Girls |
Boys |
% of Girls |
B.A |
97415 |
64993 |
32422 |
66.72 |
B.Sc |
91038 |
66676 |
24362 |
73.24 |
Bcom |
38047 |
23851 |
14196 |
62.69 |
Total |
226500 |
155520 |
70980 |
68.66 |
Source: Directorate of Collegiate Education
4.36 Out of the total students enrolled for degree courses, 43.01% are enrolled for BA degree courses, 41.35 % enrolled for BSc and 15.57% enrolled for B.Com degree courses.
4.37 Twenty seven subjects are offered for BA degree courses. Among the subjects, Economics has the largest number of enrolment of students. 31 subjects are offered for BSc course and Mathematics has the largest number of student enrolment. Details of enrolment of students in Arts and Science colleges for BA, BSc and B.Com are given in Appendix 4.27, 4.28 & 4.29. 30294 students are admitted to post graduate course in the State in 2014-15. 75.54% of those enrolled in PG courses are girls. Details of enrolment of students in Arts and Science colleges for MA, MSc and M.Com courses are given in Appendix 4.30, 4.31 & 4.32.
Box 4.3
Honours Degree Course in Govt. Colleges
As per the recommendations of the State Planning Board, Govt of Kerala have accorded sanction for starting Honours Degree Courses in four Colleges in the State. The bachelors’ degree courses are offered in the subjects of English, Economics, Commerce and Mathematics. The qualification for applying for the course is a pass in Higher Secondary or equivalent course with a minimum of 70% marks for general, 60% for SC, and 55% for ST category students.
Honours Degree courses are introduced in Women’s College, Thiruvananthapuram (English), Victoria College, Palakkad (Commerce) and Brennan College Thalassery (Mathematics) during 2013-14 academic year itself and in Maharajas College, Ernakulum (Economics) during 2014-15. This is an attempt to impart quality education at higher level and it is expected that after this course, students can go to renowned institutions for higher studies. Internships and exposure visits for students in renowned organizations, interaction with well-known persons in the areas concerned, public lectures etc. are designed in the course.
Scheduled Caste /Scheduled Tribe Students
4.38 The enrolment of Scheduled Caste (SC) students in degree and post graduate courses in the State is 30036 and 3981 respectively. SC students constitute 13.25 % of total students in 2014-15. Girls constitute 69.93% of total SC students in Arts and Science colleges. Percentage of SC/ST students in higher education is given in Table 4.4.
Table 4.4
Percentage of SC/ST students in higher education
Course |
Total Number of Students |
Number of SC Students |
% of SC students |
Number of ST students |
% of ST students |
Total number of SC-ST students |
% of SC/ST students |
B.A |
97415 |
12905 |
13.25 |
2222 |
2.28 |
15127 |
15.53 |
B.Sc |
91038 |
11730 |
12.88 |
851 |
0.93 |
12581 |
13.82 |
Bcom |
38047 |
5401 |
14.2 |
672 |
1.77 |
6073 |
15.96 |
Total Degree students |
226500 |
30036 |
13.26 |
3745 |
1.65 |
33781 |
14.91 |
M A |
11433 |
1653 |
14.46 |
486 |
4.25 |
2139 |
18.71 |
M Sc |
14077 |
1710 |
12.15 |
350 |
2.49 |
2060 |
14.63 |
M Com |
4784 |
618 |
12.92 |
109 |
2.28 |
727 |
15.20 |
Total P G Students |
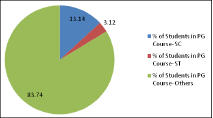
30294 |
3981 |
13.14 |
945 |
3.12 |
4926 |
16.26 |
Total degree & PG |
256794 |
34017 |
13.25 |
4690 |
1.83 |
38707 |
15.07 |
Source: Directorate of Collegiate Education
4.39 The number of Scheduled Tribe students enrolled for courses in Arts and Science colleges in 2014-15 is 4690. The enrolment of ST students in degree and post graduate courses are 3745 and 945 respectively. Girls constitute 64.76% of the total in Arts and Science colleges. Enrolment of SC and ST students in Arts and Science Colleges in Kerala during 2014-15 is given in Appendix 4.33 & 4.34.
Fig 4.5
Percentage of SC/ST students in Degree and PG Courses
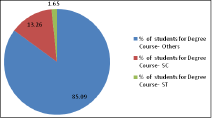
Source: Directorate of Collegiate Education
Scholarships
4.40 Central and state sector scholarships of 14 types are given to students. Various scholarships including Kerala State Suvarna Jubilee Scholarship (3000) and post metric scholarships (93264 nos.) were given during 2014-15. The Directorate of Collegiate Education has set up LED display board giving the details of scholarships offered by the Government of Kerala and India. The details of number of scholarships offered from 2012-13 to 2014-15 are given in Appendix 4.35
Teachers
4.41 The number of teachers in Arts and Science colleges in the State in 2014-15 was 9838, out of whom 54.64% are women. University-wise number of teachers in Arts and Science colleges in the year 2012-13 to 2014-15 is given in Appendix 4.36. 3218(32.71%) teachers in Arts and Science colleges in the State have Ph.D degree. Details are given in Appendix 4.37. A total of 1938 Guest Lecturers were working in Arts and Science colleges of the State in 2015. Details are given in Appendix 4.38.
Kerala Council for Historical Research (KCHR)
4.42 Kerala Council for Historical Research is an autonomous academic institution, established in 2001, committed to scientific research in archaeology, history and social sciences. It is a recognized research centre of the University of Kerala and has academic affiliations and bilateral academic and exchange agreements with leading universities and research institutes in India and abroad. KCHR is to publish a comprehensive volume on the scientific history of Kerala from pre-historic to the present times.
4.43 A sustainable/historical tourism project is conceived in the Kodungallur-Parur zone and KCHR is identified as the nodal agency to provide technical assistance. From 2006-07 onwards KCHR has successfully undertaken the multi disciplinary excavation at Pattanam. The excavation has yielded significant evidences for re-conceptualizing the early history of Kerala.
Technical Education
4.44 The Twelfth Five Year Plan document proposes to encourage the private sector to establish larger and higher quality institutions and Public–Private Partnerships (PPP) in higher education particularly in the establishment of research and innovation institutions. The State of Kerala has entered into MOUs with some of the leading global industrial enterprises and is going to implement some schemes in the technical education realm where skill development is a matter of concern. The State has entered into an MOU with Bosch Group which is a global company with wide network of operations in Automotive, Industrial and Consumer goods and building service sectors. Bosch Rexroth will setup one Centre of Excellence in Automation Technologies at College of Engineering, Trivandrum and one Centre of Competence in Automation Technologies at Government Polytechnic at Kalamaserry. These centres will work on Dual education system centres that will provide in depth knowledge on automation technologies.
4.45 The following courses are implemented under the technical education department in Public–Private Partnerships (PPP) mode.
a. Advanced Diploma in Automotive Mechatronics (ADAM) and Establishment of Centre of Excellence in Mechatronics at Government Engineering College, Barton Hill.
b. Centre of Excellence in Automation Technologies in College of Engineering Trivandrum.
c. Centre of Competence in Automation Technologies in Govt. Polytechnic College,Kalamassery.
d. Two year MS Course in Translational Engineering in Government Engineering College, Barton Hill, Thiruvananthapuram.
4.46 Directorate of Technical Education is the nodal department for technical education in the State. As envisaged in the 12th Plan, the basic objective is to achieve faster, sustainable and more inclusive growth. The details of technical institutions under the administrative and financial control of Directorate of Technical Education is given in Appendix 4.39
Box 4.4
E-Governance Initiatives in Technical Education
An online file management system of Digital Document Filing System (DDFS) has been implemented in the Directorate of Technical Education for the smooth and easy management of files. The files are received and processed online.
The GATE scholarship of PG students are disbursed using software application. An online Budget Monitoring and Management System is being implemented. The video conferencing facility is being utilised on a regular basis by the Higher Education Department and DTE for convening meetings with Principals of various institutions and an ‘A View’ server is being setup for the video conferencing applications. As part of computerisation of the departmental activities, a Management Information System (MIS) providing information on vacancy position, transfer, report of work status, admission to various courses etc. has also been implemented.
Source: Directorate of Technical Education
4.47 Various projects are being undertaken through funding from different agencies like Ministry of Human Resource Development, All India Council for Technical Education, Technical Education Quality Improvement Programme (TEQIP), Trivandrum Engineering Science and Technology (TREST) Research Park, Technology Business Incubators (TBI), Department of Science and Technology (DST), and University Grants Commission etc. Apart from this, up gradation of laboratories in various institutions are being taken up under Modernization and Removal of Obsolescence (MODROBS) scheme of AICTE.
Box 4.5
Indian Institute of Technology, Palakkad
The Union Finance Minister in his Budget speech 2014-15 has announced the setting up of a new IIT in Kerala along with those in the states of Chhattisgarh, Goa and Jammu & Kashmir. The establishment of an IIT in Kerala will help the State to take a leap forward in the educational front. The new IIT was established in Palakkad district vide G O (MS) no. 229/2015/H.Edn dtd 3/6/2015. It is expected that the new IIT can overcome the qualitative and quantitative backwardness in technical education and Research & Development in the State. The inception of new IIT can facilitate strong linkage with industries and thereby the overall development of the State. Government of Kerala has provided land and allocated fund for developmental activities of the IIT.
Source: Press Information Bureau, MHRD, GOI.
Engineering Colleges
4.48 There are 164 engineering colleges in the State with a sanctioned intake of 58237 students in 2015. Out of these engineering colleges 152(92.68%) are self financing colleges (unaided), 9 (5.49%) are government colleges and 3 (1.83%) are private aided colleges. Largest number of the unaided engineering colleges are functioning in Ernakulum (32) followed by Thiruvananthapuram (25). There is no government engineering college in Kollam, Pathanamthitta, Alappuzha, Ernakulam, Malappuram and Kasargod Districts. The District wise and management wise details of engineering colleges and sanctioned intake are given in Appendix 4.40. The sanctioned intake of Govt. colleges during 2015 was 3343 (5.7%), aided colleges 1700 (2.9%) and unaided colleges 53194 (91.34%).
4.49 Of the engineering colleges in Kerala, the largest number of branch wise seats was in Electronics and Communication (12045) followed by Mechanical Engineering (10451), Civil Engineering (10037) and Computer Science and Engineering (10005). Branch-wise distribution of seats in engineering colleges in 2015-16 is given in Appendix 4.41. 6370 students were enrolled in government and aided engineering colleges for graduate courses in 2015-16 of whom 36.86 % are girls. 1375 students have been admitted in government and aided engineering colleges for post graduate courses in 2015-16 and 1438 students in 2014-15. Girl students constitute 55.86% of total students in government and aided engineering colleges studying for post graduate courses. Details are given in Appendix 4.42 & 4.43.
Box 4.6
K- Base system
The K-base – Knowledge/learning management system supports the creation, organization, storage, decimation and preservation of the digital information assets of the engineering colleges and other institutions under the Department of Technical Education.
K-base is an e-learning initiated by the Directorate of Technical Education, Government of Kerala. The repository was established to facilitate deposit of the digital content of a scholarly nature created by the faculty, staff and students under the Directorate of Technical Education for a group of institutions. This is intended to be shared among the departments as well as to preserve the contents in a managed way. K-base includes materials such as research articles, before (pre-prints) and after (post prints) undergoing peer review and digital versions of theses and dissertations, administrative documents, course notes for learning objects etc. 9 Engineering colleges, 49 polytechnics, college of fine arts, technical high schools, Govt. Commercial Institute, tailoring and garment making training centres and vocational training centres which are under the Department of Technical Education have benefited from K-base.
Source: Directorate of Technical Education
Academic Excellence in Engineering Colleges
4.50 The academic excellence in Government Engineering Colleges is high and appreciable and this was due to the high pass percentage and increasing placement of students in reputed firms. The placement record of the students in various government institutions is relatively high. A large number of students are also being qualified for higher studies through competitive examinations like GATE, CAT etc. Most of the students get placement in multinational firms like WIPRO, TCS, and BOSCH etc. Placement details of students of various Govt. Engineering Colleges during 2014-15 is given in Table 4.5.
Table.4.5
Placement Details of Students of Various Engineering College during 2014-15
Sl No. |
Name of College |
No. of offers |
1 |
College of Engineering, Thiruvananthapuram |
430 |
2 |
Govt. Engineering College, Barton Hill |
239 |
3 |
RIT, Kottayam |
142 |
4 |
Govt. Engineering College, Idukki |
15 |
5 |
Govt. Engineering College, Thrissur |
191 |
6 |
Govt. Engineering College, Palakkad |
46 |
7 |
Govt. Engineering College, Kozhikode |
39 |
8 |
Govt. Engineering College, Wayanad |
26 |
9 |
Govt. Engineering College, Kannur |
102 |
|
Total |
1230 |
Source: Directorate of Technical Education
Polytechnics and Technical High Schools
4.51 Forty three Government polytechnics and six private aided polytechnics were functioning in Kerala. The annual intake of students in government polytechnics and private aided polytechnics during 2015-16 are 10333 and 1543 respectively. The total number of students in government polytechnics during the year 2015-16 is 27600 and that of private aided polytechnics is 4505. Details of annual intake and student strength in polytechnics for the year 2013-14 to 2015-16 are given in Appendices 4.44 & 4.45. Details of trade-wise annual intake of students in polytechnics of the State in 2015-16 are given in Appendix 4.46. Student intake is highest in the trade of Mechanical Engineering (2520) followed by Computer Science and Engineering (2210), Electronics Engineering (2170) and Civil Engineering (2070).
Fig 4.6
Student Strength in Polytechnics in Kerala
Source: Directorate of Technical Education
4.52 Total number of teachers working in polytechnics of the State is 1756. Women teachers constitute 28.87% of the total number of teachers in polytechnics. Student- teacher ratio is high in Government Polytechnics for both the years. Student- Teacher Ratio in Polytechnics is given in Table 4.6
Table 4.6
Student- Teacher Ratio in Polytechnics
Type of Institutions |
2014 |
2015 |
Government |
21 |
20 |
Private (Aided) |
11 |
10 |
Total |
19 |
17 |
Source: Directorate of Technical Education
4.53 Details of number of students and teachers in polytechnics are given in Appendix 4.47. Number of SC/ST students and SC/ST teachers in polytechnics in the reporting year is given in Appendix 4.48. Percentage of SC/ST students admitted in Polytechnics is shown in Table 4.7.
Table 4.7
Percentage SC/ST students in Polytechnics
Type of Institution |
2014-15 |
2015-16 |
||||||
SC |
ST |
Others |
Total |
SC |
ST |
Others |
Total |
|
1. Government |
8.19 |
1.01 |
90.80 |
100 |
7.08 |
0.86 |
92.06 |
100 |
2. Private (Aided) |
9.84 |
0.47 |
89.69 |
100 |
5.46 |
0.38 |
94.16 |
100 |
Total |
8.40 |
0.94 |
90.66 |
100 |
6.86 |
0.79 |
92.36 |
100 |
Source: Directorate of Technical Education
4.54 Thirty nine Government technical high schools are functioning in the State. Total number of students in technical high schools in the year 2015-16 is 8872, and 794 teachers are working in technical high schools of the State in the corresponding period. Women teachers constitute 23.93% of teachers in technical high schools. Number of students and teachers in technical high schools in 2013-14 to 2015-16 are given in Appendix 4.49. Compared to the previous year, the percentage of SC and ST students in technical high schools have declined from 12.76% to 9.36% and from 0.96% to 0.63% respectively. Details are given in Appendix 4.50 & 4.51.
4.55 The higher and technical education in Kerala has to be capable of taking advantage of the increasing opportunities generated by globalization, for which the State has to introduce various industry based courses on PPP mode, Autonomous Colleges, Deemed Universities and Off Campus Centres. There are plans to involve foreign universities through off-campus centres, in addition to using the assistance of local autonomous colleges and other deemed universities. Opening up the sector in this direction will enhance the possibilities of healthy competition among the universities which will automatically increase the quality levels. This way of expanding higher education is expected to generate more placement opportunities.
4.56 However, while such plans are being contemplated, the consistent fall in the quality of higher education in the State continues to be a major concern. The situation continues to remain dismal, if not becoming worse, even as education experts every year send out warning signals. The situation compels the government to immediately address the issues and take urgent action. In this context it would be useful to revisit some of the measures adopted in the past when similar concerns were voiced. Starting vocational courses at the higher secondary level was one such attempt which could not deliver expected results. Although courses were started with a focus on skills oriented towards specific occupations with the intention of achieving self/wages/direct employment as well as vertical mobility, it remained unsuccessful for various reasons. The curriculum developed for the courses thus planned proved to be a failure in equipping students with traditional or modern skills.
4.57 Kerala faces a paradoxical situation where the number of job seekers rises alongside a “scarcity of labour”. In other words the education that is being imparted at schools result in a “de-skilling” – where the students are no longer capable of performing the traditional occupations. This is often coupled with the despised opinion developed at schools for manual jobs. Attempts have to be made in order to revise the syllabi at schools in order to rectify this situation and change students’ attitude towards traditional occupations. Another major issue confronting the educational system of Kerala is the mismatch between the courses available and the courses required. This mismatch between demand and supply is more pronounced in the area of higher and technical education. There exists lack of interaction between educational institutions and industry. Collaboration of our leading technical institutions with leading industrial concerns may change the situation.
Section 2
Medical & Public Health
4.58 The foundation for a medical care system accessible to all citizens was laid before independence in the state. Some of the hospitals in Kerala are more than 50 years old. Democratic decentralization since 1994 in Kerala improved the infrastructure facilities and equipment in primary and secondary healthcare institutions and widened healthcare delivery. Easy accessibility and coverage of medical care facilities has played a leading role in influencing the health status of Kerala. In Kerala, both Allopathy and AYUSH systems play a crucial role in providing, universal accessibility and availability even to the poorer sections of society.
4.59 Kerala has made significant gains in health indices like Infant Mortality Rate, Birth Rate, Death Rate, expectancy of life at birth etc.The State is facing difficulty to further improve upon these achievements andto sustain the gains made. Further, the State is facing problems of life style diseases like diabetes, coronary heart disease, renal disease, cancer and geriatric problems. Communicable diseases like chikungunya, dengue, leptospirosis, swine flu etc. are also major concerns. Other than these, there are new threats to the health scenario of the State, like mental health problems, suicide, substance abuse and alcoholism, adolescent health issues and rising number of road traffic accidents which have emerged as major problems. To tackle these, concerted and committed efforts with proper inter sectoral co-ordination is essential.
Health Indicators of Kerala
4.60 Comparative figures of major health and demographic indicators at State and National level given in Table 4.8.
Table 4.8
Demographic, Socio-economic and Health profile of Kerala as compared to India
Sl. No. |
Indicator |
Kerala |
India |
1 |
Total population (In crore) (Census 2011) |
3.34 |
121.06 |
2 |
Decadal Growth (%) (Census 2011) |
4.90 |
17.7 |
3 |
Sex Ratio (Census 2011) |
1084 |
943 |
4 |
Child Sex Ratio (Census 2011) |
964 |
919 |
Sl. No. |
Indicator |
Kerala |
India |
|
1 |
Birth Rate # |
|
14.70 |
21.40 |
2 |
Death Rate # |
|
6.90 |
7.00 |
|
Male |
7.90 |
7.50 |
|
Female |
6.00 |
6.40 |
||
3 |
Natural Growth Rate # |
7.80 |
14.40 |
|
4 |
Infant Mortality Rate # |
12.00 |
40.00 |
|
Male |
10.00 |
39.00 |
||
Female |
13.00 |
42.00 |
||
5 |
Neo Natal Mortality Rate* |
7.00 |
35.00 |
|
6 |
Perinatal Mortality Rate* |
13.00 |
35.00 |
|
7 |
Child Mortality Rate* |
2.00 |
15.00 |
|
8 |
Under 5 mortality Rate* |
14.00 |
69.00 |
|
9 |
Early Neo-natal Mortality Rate* |
5.00 |
27.00 |
|
10 |
Late Neo-natal Mortality Rate* |
2.00 |
8.00 |
|
11 |
Post Neo-natal Mortality Rate* |
4.00 |
18.00 |
|
12 |
Death Rate* |
|||
(a) Children (0-4) |
3.10 |
20.70 |
||
(b) Children (5-14) |
0.20 |
1.00 |
||
(c) Children (15-49) |
2.50 |
3.70 |
||
(d) persons (60 and above) |
42.10 |
46.60 |
||
(e)Percentage of death receiving medical attention* |
||||
Government |
38.00 |
17.40 |
||
Private |
33.40 |
12.10 |
||
Qualified professional |
12.20 |
37.90 |
||
Untrained/others |
16.40 |
32.60 |
||
13 |
Still Birth Rate* |
7.00 |
8.00 |
|
14 |
Total Fertility Rate* |
1.70 |
2.60 |
|
15 |
General Fertility Rate* |
52.00 |
88.00 |
|
16 |
Total Marital Fertility Rate* |
3.50 |
4.30 |
|
17 |
Gross Reproduction Rate* |
0.80 |
1.20 |
|
18 |
Female age at effective marriage* |
|||
(a) Below 18 |
16.70 |
16.30 |
||
(b) 18-20 |
19.20 |
19.00 |
||
(c) Above 21 |
24.40 |
23.90 |
||
(d) All age |
24.40 |
20.70 |
||
19 |
Couple Protection Rate |
|
62.30 |
52.00 |
20 |
Maternal Mortality Ratio** |
|
66.00 |
178.00 |
21 |
Expectancy of Life at Birth* |
Male |
71.40 |
62.60 |
Female |
76.30 |
64.20 |
||
Source: Directorate of Health Services
# SRS 2014
* SRS 2009
**Special Bulletin on MMR 2010-12
Expert Committee Report on Health for 12th Five Year Plan
4.61 The State Planning Board had constituted an Expert Committee on Health under the Chairmanship of Dr.K.Mohandas, Former Vice Chancellor, Kerala University of Health and Allied Sciences to prepare an action plan for the Twelfth Plan. The Committee deliberated on the various challenges faced by the State’s Health System and the strategies to be adopted during the Twelfth Five Year Plan. Expert committee identified six priority areas in Health Sector for the 12th Five Year Plan.The report gave primary importance to prevention of disease & promotion of health and subsequently prioritized health management for speedy and complete recovery. The priority areas identified are as follows.
1. Ensuring Financial Risk protection to the population
2. Prevention of communicable and non-communicable diseases
3. Human Resource Planning in Health
4. Improving the Quality of Health Services
5. Improving services for the Elderly, Mental Health and Disability
6. Generating Evidence for Policy
4.62 The recommendations of the Committee have been incorporated in the schemes of the health sector viz Arogyakiranam, E-health programme, Mental Health Programmes, Public Health Protection Agency, Prevention of communicable & non-communicable diseases, etc
Major Initiatives of the Twelfth Five Year Plan of Government of India-
relevant to Kerala
4.63 The Major Initiatives of the Twelfth Five Year Plan of Government of India relevant to Kerala are the following;
1. Access to Medicines, Vaccines and Technology
2. Human Resources for Health
3. Health Service Norms
4. Management and Institutional Reforms
5. Gender and Health
Draft National Health Policy 2015
4.64 India has drafted The National Health Policy twice, once in 1983 and in 2002, which has guided the approach towards the health sector in five-year plans.Thirteen years after the previous health policy, the draft National Health Policy 2015, has addressed the issues of universal health coverage, reducing maternal mortality and infant mortality, access to free drugs and diagnosis and changes in laws to make them more relevant.Salient features of the draft National Health Policy 2015 are;
1. Improve the care delivery system
2. A National Health Rights Act to make health a Fundamental Right
3. Denial of health care will be justiciable
4. Raise public health expenditure to 2.5% of GDP (₹..3800 per capita) from current spending of 1.04 % of GDP (₹..957 per capita)
5. Creation of health cess on the lines of educational cess
6. Ensure universal access to free drugs and diagnosis in government hospitals
7. States may voluntarily opt to adopt the Act through a resolution in the Legislative Assembly
Draft State Health Policy 2013
4.65 The draft health policy of Kerala Government lays emphasis on improving the health of women and adolescent girls. It recognises that government should engage the private sector healthcare providers within a regulatory framework. The other major proposals in the draft policy include a unified Kerala Public Health Act, combining the existing Travancore-Cochin Public Health Act and the Madras Public Health Act and current needs; the setting up of a Public Health Cadre and Public Health Protection Agency; strategies to reduce maternal and infant mortality through a framework developed with the support of the Kerala Federation of Obstetrics and Gynaecology and the National Institute of Clinical Excellence, United Kingdom; strengthening of cancer care and prevention systems; systems for better trauma care management with dedicated trauma care teams at district and taluk levels apart from extension of the 108 Ambulance services across the State; a Medical Establishment Bill 2013 covering registration and regulation of all healthcare institutions; a data management system leading to an Electronic Health Record; quality in the medical education sector; research and documentation and quality assurance systems for promotion of Ayurveda and Homoeopathy systems; and proposals for continued engagement with the private sector for purchasing services.
Perspective Plan 2030
4.66 The vision of the Perspective Plan 2030 is health for all by 2030. It envisages to provide health security to each and every one by 2030, to have a highly innovative, affordable, and accessible health system that all Keralites can trust and to have a health system that is accessible when people need it, regardless of their ability to pay.The main goals of the Perspective Plan 2030 are;
• Increase the health expenditure to GSDP ratio from 0.6 % in 2012 to 4−5 % by 2027−31.
• Reduce MMR from 66 to 12 per 1 lakh live births.
• Reduce IMR from 12 to 6 per 1,000 live births.
• Eradicate communicable diseases.
• Prioritise health areas to include mental diseases, alcoholism, and suicides.
• Increase the number of hospital beds from 34.6 per 10,000 in 2004 to 70 by 2030.
• Increase the number of nurses from 12.4 per 10000 in 2004 to 65 by 2030.
• Increase the number of doctors from 9.9 per 10,000 population to 17.2 in 2030.
• Provide Health insurance cover to all.
For achieving the above goals the following measures are suggested to be undertaken.
1. Systematic upgradation of Government Hospitals for quality accreditation.
2. Private health care providers under a regulatory framework
3. Financial risk protection.
4. Local Government at the centre of health planning.
5. Public health prioritization
6. Health care of vulnerable population
7. Behavioral change to reduce alcohol consumption
Public Health Protection Agency
4.67 All developed countries have health protection agencies and they have given importance to public health as separate entity. This has helped them to control the communicable diseases and manage other public health issues. There is no such agency in India or Kerala. Kerala with its good health indicators which is on par with the developed countries has the challenge of dual burden of communicable and non communicable diseases. Hence there is an urgent need for developing a well-functioning agency which will coordinate and regulate the ongoing activities and also strengthen the public health system in the State.A proposal for registering it as a society along with bye-laws of the society is in the draft stage.
Health Sector Financing during Twelfth Plan
4.68 Health has been a major area of allocation in the budget in the State in the past years. Government healthcare expenditure has been showing a steady increase in recent years. During the first year of Twelfth Plan (2012-13) an amount of ₹.47000 lakh had been allotted for Health Sector. Of which 82 % was expended. During the second year of the Twelfth Plan (2013-14) an amount of ₹. 54100 lakh wasallocated for Health Sector, it was 15 % increase over 2012-13 outlay and 94.72% was expended. In the third year (2014-15), an amount of ₹.62940 lakhs has been allocated and 87.76% expended. Department wise plan outlay and Expenditure during the Twelfth Plan and total outlay and expenditure upto November 2015 (2015-16) is given in Table 4.9.
Table 4.9
Department wise Outlay and Expenditure for the XIIth Plan ( Annual plan 2012-16 )
( ₹. in lakh )
Depart ment
|
Annual plan 2012-13 |
Annual plan 2013-14 |
Annual Plan 2014-15 |
Annual Plan 2015-16 (upto October) |
|||||
Outlay |
% Exp. |
Outlay |
% Exp. |
Outlay |
% Exp. |
Outlay |
Exp. |
% Exp. |
|
Directorate of Health Services |
20564 |
90.15 |
24530 |
97.67 |
29693 |
78.90 |
32216 |
15882.09 |
49.30 |
Directorate of Medical Education |
20220 |
81.15 |
22665 |
93.85 |
25750 |
97.40 |
26699 |
9586.82 |
35.91 |
Indian Systems of Medicine |
1665 |
101.38 |
2330 |
95.11 |
2545 |
78.15 |
2670 |
721.12 |
27.01 |
Directorate of Ayurveda Medical Education |
1760 |
59.16 |
2300 |
94.04 |
2567 |
84.10 |
2567 |
1011.3 |
39.40 |
Directorate of Homoeopathy |
1721 |
40.66 |
1475 |
61.80 |
1440 |
88.76 |
1440 |
526.05 |
36.53 |
Homoeo Medical Education |
1070 |
32.01 |
800 |
90.50 |
945 |
97.60 |
945 |
690.42 |
73.06 |
Total |
47000 |
82.38 |
54100 |
94.72 |
62940 |
87.76 |
66537 |
28417.80 |
42.59 |
Source : Plan Space
Financial Protection against Catastrophic Health Care Expenditure
4.69 Rashtriya Swasthya BimaYojana (RSBY) is a Health Insurance Scheme, sponsored by the Government of India, for providing free and quality inpatient care to the families falling below poverty line (BPL) in the society. The scheme promises inpatient treatment facility upto ₹..30,000/- on paperless, cashless and floater basis to a maximum of five members in a family, for a period of one year through selected public and private hospitals with a prefixed medical and surgical rates for treatment in general ward. RSBY does not cover outpatient treatment cases. Minimum period of 24 hour inpatient treatment is required for getting the benefit under the scheme. More than 1100 surgical procedures with prefixed rates are included in the benefit package.
4.70 The Government of Kerala while adopting RSBY in 2008 decided to implement it in all the districts of the state simultaneously whereas the Government of India had proposed a staggered implementation. It decided to empanel all the government hospitals in the scheme by updating the facilities and providing incentives to the medical personnel so that responsive treatment could be obtained by the enrolees to the scheme. It was also decided to involve the local governments to raise the enrolment rate. Thus, the State rolled out the RSBY with over 80 per cent of the eligible families enrolled and over 50 per cent of all empanelled hospitals hailing from the government sector.
4.71 RSBY is a cashless scheme operated through a smart card with a chip embedded in it. The readable zone of the card carries the photo and name in English and vernacular language of the head of the family. The non-readable zone has the name and address of all the other members in the family with a group photo of all the members in the family and impressions of their left and right thumbs.
4.72 The scheme is implemented through an insurance company selected through a tender process for a period of one year. Government of India pays 75 per cent of the premium and the State pays the rest. Three important features of RSBY are (i) there is no age limit for joining the scheme; (ii) it covers existing diseases; and (iii) a transport allowance of ₹.100 is being paid in cash to the patient at the time of discharge from the hospital. Maximum transportation allowance payable in a year is restricted to ₹..1,000. It has a component to pay the wages foregone as well.
4.73 The Planning Commission norms for categorising a family as BPL was too restrictive and it covered only around 11.79 lakh out of the total 75 lakh families in the State. RSBY coverage was restricted to these families. The restrictive definition of poor was not acceptable to the State as protection of the families against catastrophic expenditure needs necessarily to cover a larger population above the poverty line and in due course the entire population. The Scheme implemented in the State was thus broadened to include other categories of households to make it a universal health insurance scheme. Kerala is the only State with such a facility. As the BPL population according to the definition adopted by the State is over and above the Planning Commission estimate by more than 10 lakhs, the State Government formulated its own Scheme for catering to the needs of the additional 10 lakh population. These two schemes are being jointly run under the banner COMPREHENSIVE HEALTH INSURANCE SCHEME (CHIS). A special purpose vehicle by name CHIAK (Comprehensive Health Insurance Agency, Kerala) has been formed and entrusted with the task of running the schemes.
4.74 The scheme began with the coverage of the BPL population (as per Planning Commission norms). In Kerala, it covered 11.79 lakh families. Gradually, Government of India extended the scheme to cover families of the participants of Mahatma Gandhi National Rural Employment Guarantee Scheme who have worked for more than 15 days in the previous year, street vendors, and domestic workers etc. Overall, workers in the unorganised sector are being covered by the scheme in increasing numbers. The State has been trying to bring other categories of population into the CHIS net. In 2014-15, the Government sought to bring the members of the various welfare fund boards and its pensioners, all Scheduled Caste and Scheduled Tribe population, and families engaged in fishing and workers of various unorganized sectors. Collection of data of these families has been made through Akshaya Kendras, the Government of Kerala Undertaking set up for spreading e-literacy and e-governance, numbering around 2000 spread all over the State. The two schemes together cover a sizeable proportion of the population in the State.
4.75 The progress of the scheme is presented in Table 4.12. The number of families covered has steadily increased to reach 32 lakh by 2014-15. The total claims as a proportion of the premium has crossed 100 per cent from the very first year. The premium too rose as the insurance company was incurring losses from the first year. The premium has increased from ₹. 435 in the first year to ₹. 745 in the third year to over ₹. 1000 in the fourth year. The premium came down in 2013-14 because a different insurance company entered the scene.
Table 4.10
Progress of the Scheme
Year |
Number of Families Enrolled (Lakh) |
Premium Paid (₹.. crore)
|
Number of Claims (Lakh) |
Claims Paid (Rs.. crore)
|
2008-10 |
11.78 |
51.27 |
1.64 |
56.00 |
2010-11 |
18.75 |
82.14 |
3.65 |
125.00 |
2011-12 |
28.12 |
210.00 |
6.99 |
211.00 |
2012-13 |
28.28 |
311.00 |
7.00 |
198.00 |
2013-14 |
29.68 |
218.00 |
5.57 |
172.15 |
2014-15 |
31.92 |
235.77 |
5.87 |
191.18 |
Source: CHIAK
4.76 One of the issues highlighted in the context of the increasing use of the private facilities by the lower income classes is the poor quality and poor response of the institutions in the Government sector. Financial protection in the form of RSBY offered the option of using the private sector by all those enrolled in the scheme. Interestingly, instead of the proportion of users of the private institutions increasing over the years, the share of the government hospitals in the total has steadily increased (Table 4.11). The proportion which stood at 60:40 between private and government initially has changed to 30:70 by the fifth year. The large investments and the incentives to the medical personnel in the government institutions have brought about a change increasing their utilisation.
Table 4.11
Utilisation of CHIS by Sector
Year |
Claim Settlement by Sector ( Count in lakh & amount in ₹. crore) |
|||||||
Govt. Hospitals |
Pvt. Hospitals |
Total |
||||||
Count |
Amount |
% |
Count |
Amount |
% |
Count |
Amount |
|
2008-10 |
0.48 |
18 |
40 |
0.95 |
27 |
60 |
1.43 |
45 |
2010-11 |
1.44 |
52 |
46 |
2.16 |
61 |
54 |
3.60 |
113 |
2011-12 |
3.78 |
119 |
56 |
3.20 |
93 |
44 |
7.00 |
212 |
2012-13 |
4.82 |
125 |
70 |
2.18 |
56 |
30 |
7.00 |
181 |
2013-14 |
4.02 |
143.13 |
72 |
1.56 |
55.9 |
28 |
5.58 |
199.03 |
2014-15 |
4.16 |
158.7 |
70 |
1.7 |
69.36 |
30 |
5.86 |
228.06 |
4.77 The nodal agency for implementing the Scheme in Kerala is the Comprehensive Health Insurance Agency, Kerala that operates with a nucleus of six personnel in Thiruvananthapuram and a district coordinator in each of the 14 districts of the State. The implementation of RSBY/CHIS in the State has brought various awards and appreciations to the State from the Central Government from the first to the fifth year. The 1st year award was for the best scheme Implementation. The second to 5thyears were for maximum utilization percentage.
4.78 A new scheme for providing tertiary care treatment with a benefit package of maximum ₹.70,000 for critical illness like cancer, cardiac and renal failure to all the RSBY and CHIS card holder families was designed during 2010-2011. The scheme, named as CHISPLUS, was launched by the middle of February 2011.The Coverage of CHISPLUS has been extended by including diseases relating to Liver, Brain and treatment of Accident Trauma care during 2012.
4.79 The scheme is implemented through all the five Government Medical Colleges in the State, Regional Cancer Centre, Thiruvananthapuram, Malabar Cancer Centre and all Government District Hospitals, General Hospitals, and Taluk Hospitals. The scheme is monitored by CHIAK with the help of software developed by Keltron. The scheme, implemented through a non-insurance route, has benefited 204,799 patients till end September 2015 and the claims have totalled ₹.238.40 crore (see Table 4.12).
Table 4.12
Utilisation of CHIS PLUS
Year |
Number of Patients |
Amount (₹.. crore) |
2010-11 |
158 |
0.29 |
2011-12 |
14453 |
26.08 |
2012-13 |
42228 |
56.94 |
2013-14 |
50945 |
53.08 |
2014-15 |
66737 |
68.02 |
2015-16* |
30278 |
34.00 |
Source: CHIAK; *till end September 2015
4.80 The ageing society of Kerala with a heavy burden of terminal diseases would need tertiary care treatment. The RSBY benefit package does not cover tertiary care. The CHIS Plus covers limited tertiary care for the population groups registered under the scheme. This leaves out the other groups for whom tertiary care treatment becomes unaffordable. Many among them would appeal for assistance. Perceiving such a felt need the Finance Minister of the state designed a scheme called Karunya Benevolent Fund (KDF) to meet the tertiary care expenditure of deserving individuals. Unlike the CHIS, which is a cashless scheme, the KBF requires a prior authorisation in the form of an estimate of expenditure to be obtained from the consulting doctor and countersigned by the authorised person of the hospital concerned where the treatment to be obtained. The estimate of expenditure form duly signed by the consulting doctor and the authorised person has to be submitted along with the prior sanction form indicating the family characteristic (BPL/APL), annual income etc. the committee headed by the district collector authorises treatment and the amount as per the details furnished in the Pre-sanction form. The amount is paid to the hospital which has to submit the utilisation certificate. In addition, there is also provision to provide a one-time assistance of ₹ 3000 per family. Treatment can be availed at all government hospitals and empanelled private hospitals.
4.81 KBF is funded by earmarking the revenue from the weekly Karunya lotteries. The KBF has provided assistance to over 110,000 households and the disbursements have crossed ₹ 800 crore by September 2015. The beneficiaries hail from all the districts. But interestingly, most of the beneficiaries have availed treatment in Government Medical College hospitals, Regional Cancer Centre, Malabar Cancer Centre and Sri Chitra Thirunal Institute of Medical Sciences.
Major Health Problems in Kerala
Communicable Diseases
4.82 Kerala is witnessing an increasing burden of communicable and non communicable diseases. Although the State has been successful in controlling a number of communicable diseases earlier, the emergence of Dengue, AIDS, Malaria, Leptospyrosis, Hepatitis, Chikungunya, H5N1, in recent years has led to considerable morbidity and mortality.
Bird Flu
4.83 The bird flu, highly infectious H5N1 virus strain has affected largely the southern districts of Kerala viz. Pathanamthitta, Kottayam and Alappuzha the most. There have been no reports of the virus affecting humans. Avian influenza, commonly called bird flu, is an infectious viral disease of birds. Influenza viruses circulating in animals pose threats to human health. Humans can become ill when infected with viruses from animal sources. Controlling the disease in animals is the first step in decreasing risks to humans.According to the World Health Organisation, while millions of fowls have died due to the Avian Influenza, only 393 human deaths (zero in India) have been recorded globally between 2003-14.
Leptospirosis
4.84 Leptospirosis has been causing a large number of deaths for the last few years in the State. Out of the 510 Leptospirosis cases reported in 2012, 11 deaths were reported. The numberof cases increased to 613 with 15 deaths during 2013. During 2014, a total of 717 cases were confirmed resulting in 19 deaths. During 2015 (upto September) 666 casesand 15 deaths have been reported. The details of district wise patients treated for leptospirosis and death reported during 2015 is given in the Appendix 4.52
HIV/AIDS
4.85 It is estimated that around 2.4 million people in India are currently living with HIV. Kerala State Aids Control Society is the pioneer organization in the State working with the objective of controlling the spread of HIV as well as strengthening the State’s capacity to respond to HIV/AIDS. It was formed to implement the National Aids Control Programme in the State.
4.86 In Kerala, the prevalence of HIV / AIDS is 4.95% among injecting drug users (IDU), 0.36 % among men having sex with men (MSM) and 0.73% among Female Sex Workers (FSW). The HIV prevalence among FSWs and MSM is nearly 1%, but the prevalence among IDUs is 4.95% (though it shows downward trend from 9.57% in 2007 and 5.3% in 2008). Current data suggest that the HIV epidemic in the State is largely confined to individuals with high risk behavior and their sexual partners.
Chikungunya
4.87 During 2006, Chikungunya emerged as a major epidemic in India affecting 151 districts in 8 States including Kerala. During 2011, while 58 chikungunya cases were reported in Kerala, it increased to 169 cases during 2013. Among the districts, highest number of cases (149) were reported in Thiruvananthapuram and 11 cases were reported in Idukki. During 2014, out of the 139 cases of chikungunyareported 106 were from Thiruvananthapuram. During 2015 (upto September), 104 cases were reported and 99 were from Thiruvananthapuram district alone. A total of 2046455 viral fever cases were reported in Kerala during 2014 and in 2015 it was 1925690 cases.The details of district wise patients treated for Chikungunya and viral fever during 2015 (upto september) is given in the Appendix 4.53.
Leprosy
4.88 The National Leprosy Eradication Program (NLEP) of the Government of India is implemented throughout the State for the control and eradication of leprosy. Drugs are supplied free of cost by WHO. From the 12th Five Year Plan onwards it has become 75% centrally sponsored program.
4.89 Kerala is a low endemic state for leprosy. The Annual New Case Detection Rate (ANCDR) is 1.966 per lakh population and Prevalence rate (PR) of 0.21/10,000 (as on March 31st 2015). Kerala contributes 0.79% of the total annual case detection in India. Total number of leprosy cases under treatment in Kerala as on 31st October 2015 is 751.
4.90 There are three leprosy sanatoriums in Kerala with bed strength of 1153 and the details of leprosy cases during 2015 are given in Table 4.13
Table 4.13
District wise distribution of Leprosy unit in Kerala- 2014
Sl No. |
District |
Institutions |
Sanctioned Bed Strength |
IP as on 31st Oct. -2015 |
1 |
Alappuzha |
Leprosy Sanatorium, Nooranadu |
267 |
237 |
2 |
Thrissur |
Koratty Gandhi Gram Govt. Dermatology Hospital |
660 |
199 |
3 |
Kozhikode |
Govt. Leprosy Hospital, Chevayoor |
226 |
110 |
Total |
1153 |
546 |
||
Source:Directorate of Health Services
Box 4.7
Anti-rabies programme
An Anti-rabies programme has been initiated in Kerala by the State Planning Board with the support of Animal Welfare Board of India and NGOs during the12th Plan Period. Control of stray dogs,Animal Birth Control (ABC), Anti-rabies Vaccination and immunoglobulin’s are the main objectives.It is an integrated programme of the Departments viz Health, Animal Husbandry, Tourism and Urban Affairs.Control over growing population of stray dogs is particularly necessary for a tourism dominated economy like that of Kerala and the initiative has been handed over to the concerned departments for effective implementation.
.
Non Communicable Diseases
4.91 Common non–communicable diseases causing great threat to life are cancer, diabetes, cardio vascular diseases and lung diseases. Unless interventions are made to prevent and control non-communicable diseases, their burden is likely to increase substantially in future, due to ageing population and changes in life style .Considering the high cost of medicines and longer duration of treatment, this constitutes a greater financial burden to low income groups.
Cancer
4.92 Cancer is a major disease that affects all sections of human population. Every year, 35000 new cases of cancer are getting detected in Kerala .Nearly 1 lakh people are under treatment for this disease annually. Apart from Medical Colleges, Regional Cancer Centre, and Malabar Cancer Centre are the hospitals in Government sector which offer treatment for cancer patients. Delay in early detection, huge treatment cost, minimal treatment centres and lack of awareness contribute to high mortality of the disease.
Malabar Cancer Centre
4.93 Malabar Cancer Centre, Kannur an autonomous centre under the Government of Kerala, that has been established with the aim of providing oncological care to the people of north Kerala. The Centre has bed strength of 200 and many latest facilities for the treatment of cancer patients. During 2014-15, a total of 59045 patients were treated in Malabar Cancer Centre including 8249 in Patients and 4277 new cases.
Indian Institute of Diabetes
4.94 The Indian Institute of Diabetes (IID), at Thiruvananthapuram is an autonomous institution under the Government of Kerala. It has been functioning for the last two decades and is the only institution under the Government offering services exclusively for Diabetes Mellitus and its complications. IID made operational in the year 2001, functions with main centre at Pulayanarkotta near Akkulam in Thiruvananthapuram city and one sub centre at Public Health Laboratory Campus, in Pattoor, Thiruvananthapuram. The major activities of this institute are to investigate the genetic basis of diabetes, to provide adequate training for physicians and paramedical staff, provide research support to develop novel methods of treatment, endow academic chairs in diabetes, and organize state-of-the-art conferences in India on various aspects of the disease.
Prevalence of other public health diseases during 2014 and 2015
4.95 A comparative analysis of the prevalence of public health diseases during 2014 and 2015 is given in Table 4.14.
Table 4.14
Prevalence of Public Health Diseases during 2014 & 2015
Sl.No. |
Diseases |
2014 |
2015 up to September |
||
Attack |
Death |
Attack |
Death |
||
1 |
Diarrheal Diseases |
442104 |
5 |
352886 |
3 |
2 |
Enteric fever |
1956 |
0 |
1332 |
0 |
3 |
Measles |
920 |
0 |
1253 |
1 |
4 |
Chickenpox |
17028 |
18 |
15162 |
11 |
Source:Directorate of Health Services
Mental Health
4.96 As per Census of India 2011, 0.20% of the population of Kerala suffers from mental illness and 0.20% suffers from mental retardation compared to a national average of 0.06% and 0.12% respectively. Although Kerala reports higher levels of mental illness compared to all India, less importance is given to the field of mental health in Kerala.
4.97 A mental health policy was approved by the State government in May 2013.The policy suggests that the treatment for mental illness should start from the primary health centres making the mental hospitals and the Department of Psychiatric Medicines as referral centres by upgrading them.Research should be encouraged for prevention and cure of mental illness.An awareness programme among the general public about the mental illness has also been suggested in the policy. Proper training should be imparted to the doctors free of cost whether they come from public or private sector if they show their willingness to undergo the training.
4.98 In Kerala three mental health centres are functioning with bed strength of 1342. District Mental Health Programme is functioning in all the districts. Rehabilitation facilities are offered through these centres. Lack of awareness, attitude of general public, neglect of family members, lack of proper follow up etc are the major problems noticed. State Government has started care homes for mentally ill persons for whom there is no family support.The centre for males is at Nallanadu, near Venjaramoodu, Thiruvananthapuram. It is a joint venture of District Panchayat, Thiruvananthapuram, Social Welfare Department, Health Department and the NGO, Saigram. The centre for females is at, ThachottuKavu, Thiruvananthapuram which is a joint venture of the Social Welfare Department and the NGO Abhaya.
Kerala State Mental Health Policy 2013
4.99 The specific context of Kerala needs to be taken into account in the discussion of mental health. Kerala reports relatively higher suicide rates compared to the other States. Alcohol use, breakdown of marriage and family, problems of ageing, strain due to unmatched parental aspirations and children’s achievements in studies, high rates of migration and single parent families are some other factors. The mental health policy for Kerala 2013 came into existence effecting amendments to the Kerala State Mental Health Policy 2000.The new State mental health policy envisages convergence of various departments for the care and rehabilitation of the mentally ill. It covers health care delivery systems, health care services (public& private sector), voluntary sector and administrative aspects.
Delivery, Maternal Death and Maternal Mortality Ratio
4.100 On the basis of the reports of DHS, the number of deliveries during 2013-14 is 493534 and maternal death reported is 182 and MMR 37 which is high compared to the maternal death 165 and MMR 33 of 495613 deliveries during 2012-13.Total number of deliveries during 2014-15 is 494479 and maternal death is 158 and MMR 32. Maternal death and MMR has reduced during 2014-15 compared to previous years.Graphical representation of District wise Maternal Death in 2013-14 and 2014-15 is given in Figure 4.7.
Fig 4.7
Maternal Mortality Ratio 2013-14 and 2014-15
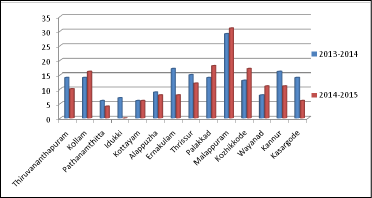
Source : DHS
Modern Medicine –Allopathy
4.101 Out of the total 1281 health care institutions under DHS, 852 are Primary Health Centres (PHCs), 230 Community Health Centres (CHCs), 79Taluk Head Quarter Hospitals, 16 District hospitals,18 General hospitals, 3 mental health hospitals, 8 W& C Hospitals, 3 leprosy hospitals, 17 TB clinics, 2 TB hospitals, 4other specialty hospitals and 49 other hospitals.Category wise major medical institutions and beds in Kerala, details of IP, OP cases, major & minor operations conducted and Medical & Para medical personnel under DHS during 2015 are given in Appendix 4.54, 4.55& 4.56.
Health Care Institutions under DHS
4.102 At present there are 1281 health institutions with 38400 beds and 5061 doctors under Health Services Department consisting of 852 Primary Health Centres, 230 Community Health Centres, 79 Taluk Head Quarters hospitals, 16 District hospitals, 18 General hospitals and specialty hospitals for Mental illness, Leprosy and Tuberculosis.Primary health centres are institutions providing comprehensive primary care services including preventive cure and curative care. CHCs and Taluk level institutions form the basic secondary care institutions. District hospitals, General Hospitals and Maternity Hospitals provide specialty services and some super specialty services. In the 12th Five Year Plan focus will be for the implementation of the specialty cadre in all health care institutions up tothe level of community health centres andmodernisation of the functioning of the institution.The bed population ratio in Kerala is 873 & the average Doctorbed ratio is 7.56.
National Health Mission
4.103 The Government of India has launched the National Health Mission (NHM) which includes two sub missions NUHM & NRHM. NHM would have six financing components, namely (i) NRHM/RCH Flexi-pool, (ii) NUHM Flexi-pool(iii) Flexible pool for Communicable Diseases, (iv)Flexible pool for Non Communicable Diseases including injury and trauma, (v) Infrastructure Maintenance and (vi) Family Welfare Central SectorComponent.Under the component of ‘infrastructure maintenance’,support has been given overseveral Plan periods, to States to meet salary requirement of Schemes viz. Direction & Administration (Family Welfare Bureaus at State & district level), Sub Centres,Urban Family Welfare Centres, Urban Revamping Scheme (Health Posts), ANM/LHV Training Schools, Health & Family Welfare Training Centres, and Training of Multi-Purpose Workers (Male).
4.104 NHM is functioning in the State for the development of health institutions with Central Government funding. 40 % of the total Central Government fund has to be given to the NHM by the State Government as State share. NHM is supporting the Health &Family Welfare Department, Directorate of Medical Education and AYUSH. National Rural Health Mission aims to provide accessible, affordable and accountable quality health services to the poorest households in the remote rural regions. Under NRHM, the focus is on a functional health system at all levels, from the village to the district.
PradhanManthriSwasthyaSurakshaYojana (PMSSY)
4.105 Pradhan ManthriSwasthyaSurakshaYojana is a Government of India supported scheme to improve infrastructure facilities and technology in Government Medical College, Thiruvananthapuram (Phase I) and Kozhikode (Phase III). Medical College Alapuzha is included in the PMSSY Phase III with a total outlay of ₹.150 crore of which Rs.30 crore is the State share. The project for Government Medical College, Thiruvananthapuram (Phase I) has already been completed.
State Institute of Medical Education and Technology (SI-MET)
4.106 State Institute of Medical Education and Technology (SI-MET) was established in the State in 2008 to promote medical education and research. There are six nursing colleges functioning under SI-MET with an annual intake of 280 students.
Child Development Centre (CDC)
4.107 Child Development Centre (CDC) is an autonomous centre established by the Government of Kerala as an autonomous centre of excellence in Early Child Care & Education, Adolescent Care & Education, Pre-marital Counseling, Women’s Welfare and other related fields to reduce childhood disability through novel scientific initiatives.It aims to create a generation of prospective and responsive parenthood through healthy children and adolescents.
Drugs Control Department
4.108 The responsibility of the Drugs Control Department is to ensure the availability of quality drugs to the public and see that the market is free from counterfeit, spurious and substandard drugs and no drugs are sold at a price higher than the retail price marked on the container. The Department has 6 Regional Offices, 11 District Offices, 4 Ayurveda Wing Offices and 2 Drugs Testing Laboratories. Drug testing laboratories are functioning at Thiruvananthapuram and Ernakulam. The works of the new Drug testing laboratories at Thrissur, Kozhikode and Pathanamthitta are under progress.
Medical Education
4.109 In Kerala, Medical Education is imparted through 11 Medical Colleges at Thiruvananthapuram (2), Alappuzha, Kozhikode, Kottayam, Manjeri, Idukki, Ernakulum, Konni, Kollam and Thrissur districts and Nursing Education through 6 Nursing Colleges in Thiruvananthapuram, Kozhikode, Kottayam, Alappuzha, Ernakulam and Thrissur districts. Five Dental Colleges are functioning at Thiruvananthapuram, Kozhikode, Alappuzha, Thrissur and Kottayam districts. Besides, four colleges of Pharmacy and one Paramedical Institute is functioning under the Department.
4.110 Medical and Para medical courses conducted in Government Medical Colleges with annual intake of students, details of clinical and non clinical personnel in Medical Colleges under DME, during 2015-16are given in Appendix 4.56, 4.57 & 4.58. A comparative analysis of the status of medical college hospitals and attached institutions during 2014 and 2015 is given in Table -4.15.
Table 4.15
Status of Medical College Hospitals and Attached Institutions during 2014 & 15
Medical College Hospitals |
Beds |
Inpatients |
Outpatients |
Major Operations conducted |
||||
2014 |
2015 |
2014 |
2015 |
2014 |
2015 |
2014 |
2015 |
|
Medical college Thiruvananthapuram |
2625 |
2637 |
90394 |
89826 |
1047261 |
1043789 |
15980 |
16716 |
SAT Hospital Thiruvananthapuram |
1100 |
1100 |
39432 |
39841 |
297318 |
296823 |
7236 |
7427 |
Medical college Alappuzha |
1125 |
1125 |
61247 |
62398 |
903517 |
912092 |
1672 |
1743 |
Medical college Kottayam |
1463 |
1463 |
72030 |
73126 |
774356 |
769027 |
5342 |
5623 |
ICH Kottayam |
203 |
203 |
9872 |
9614 |
161080 |
162454 |
1407 |
1289 |
Medical college Thrissur |
800 |
800 |
34319 |
35427 |
191847 |
193124 |
14922 |
15450 |
ICD Thrissur |
475 |
475 |
28333 |
29146 |
314718 |
325039 |
Nil |
Nil |
Medical college Kozhikkode |
2200 |
2200 |
80435 |
81324 |
483439 |
484651 |
8451 |
8671 |
IMCH Kozhikkode |
1200 |
1200 |
42926 |
41290 |
91147 |
92456 |
2039 |
2198 |
ICD Kozhikkode |
140 |
140 |
4137 |
4218 |
57843 |
58901 |
Nil |
Nil |
Medical College Idukki |
130 |
192 |
1500 |
7830 |
21185 |
139185 |
237 |
928 |
Medical College Ernakulam |
500 |
500 |
12302 |
4057 |
189606 |
66818 |
2429 |
1244 |
Total |
11961 |
12035 |
476927 |
478097 |
4533317 |
4544359 |
59715 |
61289 |
Source : Directorate of Medical Education
4.111 An increase of 74 numbers of beds in bed strengthhas been effectedduring 2015 in Medical College institutions compared to previous year.The number of inpatients & outpatients and major operations conducted has increased during 2015. Major achievements of Medical Education Department during 2015 include;
1. Started New Medical Colleges at Thiruvananthapuram and Konni (Pathanamthitta).
2. Drug Testing Laboratory started functioning at Thiruvananthapuram&Alappuzha.
3. Dental College started functioning atAlappuzha.
Kerala University of Health and Allied Sciences
4.112 Kerala University of Health Sciences was established as per the Kerala University of Health Science Act 2010 with the aim of ensuring proper and systematic instructions, teaching, training and research in Modern medicine, Homoeopathy and Indian System of Medicine and allied health sciences in Kerala. Academic activities of the University has commenced in academic year 2010-11. The number of institutions affiliated to University is (upto September 2015) 272 with 36 Government colleges, 5 Government Aided Colleges & 241 Self-financing Colleges. The colleges fall under all systems of medicine such as Allopathy, Ayurveda, Homoeopathy, Sidha, Unani, Yoga, Naturopathy, Nursing, Pharmaceutical Science and Paramedical courses. The annual intake of students in Government Colleges is 3528, 276 in Government aided colleges and 15654 in self-financing colleges with a total of 19458 students. More than 60% of the students of affiliated colleges are girls.
Indian System of Medicine
4.113 Ayurveda is a science dealing not only with treatment of some diseases but also a complete way of life. The Department of Indian System of Medicine renders medical aid to the people through the network of Ayurveda hospitals and dispensaries, grant-in-aid Ayurveda institutions, Sidha- Vaidya, Unani, Visha ,Netra and Naturopathy. Specialty hospitals such as Mental Hospital, Panchakarma, Nature cure and Marma are functioning under this Department. At present there are 127 hospitals and 815 dispensaries under the department. The State Medicinal Plants Board co-ordinates matters relating to the cultivation, conservation, research & development and promotion of medicinal plants in the State. List of major institutions and district wise distribution of institutions, beds and patients under ISM department during 2014 & 2015 is given in Appendix 4.59.
AYUSH (Ayurveda, Yoga & Naturopathy, Siddha, Unani and Homoeopathy)
4.114 Government of India has set up two regulatory bodies to set standards of medical education. The Central Council of Indian Medicine (CCIM) under Indian Medicine Central Council (IMCC) Act 1970 regulates educational institutions and practitioners in respect of Ayurveda, Unani and Sidha systems of medicines. The Central Council of Homoeopathy (CCH) under Homoeopathy Central Council Act, 1973 regulates educational institutions and practitioners in respect of Homoeopathy system of medicines. At present Yoga & Naturopathy, being drugless systems, are not regulated.
National AYUSH Mission
4.115 Department of AYUSH (Ayurveda, Yoga & Naturopathy, Siddha, Unani and Homoeopathy), Ministry of Health and Family Welfare, Government of India has launched National AYUSH Mission (NAM). The basic objective of NAM is to promote AYUSH medical systems through cost effective AYUSH services, strengthening of educational systems, facilitate the enforcement of quality control of Ayurveda, Siddha, Unani and Homoeopathy drugs and medicinal plants. The funding pattern will be 60:40 by Centre and State.
Ayurveda Medicine Manufacturing- OUSHADHI
4.116 OUSHADHI is the largest manufacturer of Ayurvedic medicines functioning in India in the public sector. It is one among the few profit making public sector undertakings. Oushadhi is the exclusive supplier of Ayurvedic medicines to Government Hospitals and dispensaries of AyurvedaDepartment. In Kerala, Oushadhi supplies medicines each year to State ISM department at 30% less than market price and ISM Department supplies this medicine to the poor patients in the State free of cost. The company also caters to the demand of the public through a network of 492 exclusive agencies spread all over the State.
Ayurveda Medical Colleges
4.117 There are 3 Government Ayurveda Medical Colleges situated at Thiruvananthapuram, Thrippunithura and Kannur having bed strength of 1355with total number of inpatients treated as10564 and outpatients 460756(upto October 2015). Panchakarma hospital and Women &Children hospital are also functioning under the Government Ayurveda Medical College Thiruvananthapuram. There are two aided colleges,11 self financing colleges and a self-financing Siddha college for imparting Ayurveda medical education. Annual intake of students for UG Degree is 800 and PG Degree is 131.
HOMOEOPATHY
4.118 There are 660 homeopathic dispensaries and 33 hospitals with total bed strength of 975 under Homoeopathy Department in the State. In addition, Kerala State Homoeopathic Co-operative pharmacy (HOMCO) Alappuzha, a medicine manufacturing unit is also functioning under the Directorate of Homeopathy. District wise distribution of institutions, beds and patients treated under Homoeopathic Department during 2014 & 2015 is given in Appendix 4.60.
Box 4.8
Major Achievements of Homoeopathy Department during 2015
• Pain and cancer palliative care services
• Epidemic control & prevention by Rapid Action Epidemic Control Cell in Homoeopathy
• AYUSH Holistic Health Care for prevention & management of life style diseases.
• Adolescent health care & behavioral management (SADGAMAYA)
• Solace for suffering womenfolk through ‘Seethalayam’
• Healthy mother and happy child campaign activities
• Geriatric care services
• Special clinics for infertility & de-addiction centres to correct substance abuse
• Specialty clinics for endocrine disorders
• Mobile / floating homoeopathic health care services
• Comprehensive quality health care service
.
Source : Directorate of Homoeopathy
Homoeo Medical Education
4.119 Homoeo Medical Education is imparted through two Government Homoeopathic Medical Colleges, at Thiruvananthapuram and Kozhikode. In addition to this 3 aided colleges & one unaided college are functioning under this Department. Annual intake of students and courses in Homoeo Medical Colleges are given in Appendix 4.61.
Immunization Coverage
4.120 Immunization is one of the most successful and cost effective health interventions and prevents debilitating illness, disability and death from vaccine preventable diseases such as diphtheria, hepatitis A and B, measles, mumps, pneumococcal disease, polio, rotavirusdiarrhoea, tetanus etc. The coverage of immunisation programmes in Kerala during six years from 2010-11 is given in Appendix 4.62.
Section 3
Social Security and Welfare
4.121 Kerala has several achievements to its credit in introducing social security measures to address economic and social distress. Successive Five Year Plans of the State as well as the Plans of the LSGIs have evolved social security strategies. The Social Justice Department (SJD) is the nodal agency implementing policies of social security and welfare. The Departments and Agencies implementing social security measures and their major activities are given in Appendix 4.63.
The social security programmes in Kerala can be grouped into two:
A. Institutional Care.
B. Social Assistance Programme.
A. Institutional Care
4.122 In the State, Government as well as NGOs/VOs provides institutional care and protection to the weaker sections. There are 78 welfare institutions under the aegis of SJD. Out of this, 32 institutions are for children, 17 for women, 11 for aged people and 18 for disabled. About 2932 persons benefited in 2014 through the network of these 78 institutions. Apart from this, 2207 registered welfare institutions run by NGOs and VOs provided benefits to 88603 persons. Of which, 17315were old people, 918 women, 15727disabled, 472 abandoned children, 52300 orphaned children, 703 beggars and 1168 others. The district wise coverage of beneficiaries in major welfare institutions run by SJD is given in Appendix 4.64 and that of registered welfare institutions in Appendix 4.65.
B. Social Assistance Programmes
4.123 Social assistance programmes comprise of a series of social security pension schemes and welfare schemes. Review of various social assistance programmes are listed below.
Pension Schemes
4.124 The major pension schemes implemented in the State are: Agriculture labour pension, Indira Gandhi National Old Age Pension, and pension for disabled, pension for unmarried women above 50 years and widow pension. During 2014-15, the total number of pensioners except agriculture labour pensioners was about 24.98 lakh. The largest categories are of old age pensioners followed by widow pensioners. Among the districts, Malappuram is at the top with most number of beneficiaries and Wayanad the least. The district wise coverage of major pension schemes is presented in Appendix 4.66.
Social Security and Welfare of Unorganized Sector Workers
4.125 Social security coverage to workers in the unorganized sectors is given through the Welfare Fund Boards (WFBs). As on 2014, there are 33 Welfare Fund Boards, out of which16 are under the direct control of the Department of Labour. The total number of members enrolled in these Boards was about 47.25 lakh, of which 65 percent were from the agriculture sector including fisheries and dairy. The Boards are functioning under different departments and the rate of assistance varies. Bringing all these Boards into one umbrella helps to improve their delivery mechanism and improve cost effectiveness and better monitoring of programmes. Details of workers enrolled in the WFBs are shown in Appendix 4.67.
Welfare of Senior Citizens
4.126 The evolution of Kerala’s ageing population is a complex phenomenon. Among the Indian states, Kerala has the largest proportion of Senior Citizens (people aged 60 years and above) in its population. Currently it is assessed as 12.6 percent (11.3 percent among males and 13.3 percent among females) compared to National average of about 8 percent. According to the projections of the National Commission on Population, the proportion of elderly population in the State is likely to increase to 18.3 percent by the end of 2026.
4.127 Also, Kerala has the highest Old Age Dependency Ratio, while Dadra and Nagar Haveli has the lowest. Addressing the challenges associated with these demographic shifts has become a major challenge to the State and society. The old age dependency ratio of top 5 and bottom 5 States/UTs in the country as per Census 2011 is shown below.
Table 4.16
Old Age Dependency Ratio as per Census 2011
Top 5 |
Bottom 5 |
||
Name of State/UTs |
Population in % |
Name of State/UTs |
Population in % |
Kerala |
196 |
Dadra & Nagar Haveli |
63 |
Goa |
168 |
Daman & Diu |
64 |
Himachal Pradesh |
161 |
Arunachal Pradesh |
77 |
Punjab |
161 |
Meghalaya |
84 |
Tamil Nadu |
158 |
Nagaland |
86 |
Source: Annual Report 2014-15, Ministry of Women and Child Development, GOI
4.128 The policies and programmes for senior citizens aim at their welfare and maintenance, especially for indigent senior citizens, by supporting old age homes, day care centres, mobile medicare units, etc. These programmes are implemented through the SJD in close collaboration with non-governmental organizations and civil society.
Institutional Services to Senior Citizens
4.129 During 2014, there were 15 Government Old Age homes with 602 inmates against the sanctioned strength of 1000. Also there were 17315 inmates in 558 registered Old Age homes run by NGOs under the board of control of orphanages and other charitable homes. In addition, a number of private Old Age homes (free and pay-and-stay) are functioning in the State. Many of these homes are running with poor infrastructure and health care facilities. Revamping the homes on par with the State Old Age Policy is obligatory for creating a healthy, physical, social and family environment.
National Old Age Pension Scheme
4.130 It is a monthly pension scheme shared by both State and Centre for BPL persons aged 60 years or above. During the reporting period the scheme benefited 10.64 lakh aged persons. The percentage increase of pensioners compared to 2013-14 is 180. The maximum coverage is from Thiruvananthapuram district and the least is from Pathanamthitta.
Integrated Programme for Older Persons (IPOP)
4.131 As per the scheme, financial assistance up to 90 per cent of the project cost is provided by Government of India to State Government / NGOs/PRIs etc. for establishing and maintaining old age homes, day care centres and mobile medicare units. In 2014-15, only one project in Kerala received the financial assistance whereas 43 projects in Andhra Pradesh, 8 in Karnataka and 26 in Tamil Nadu received financial assistance from Central Government. Identification of more eligible NGOs and other supporting agencies in the State are necessary for getting more financial support from Centre.
Box 4.9
Arogyakeralam Palliative Care Project: A unique model of palliative care
The Arogyakeralam project was launched by the State Government in 2008 with the aim of providingmedical care and support to every citizen in need of palliative care. Arogyakeralam emphasises a community-based approach to healthcare and considers home-based medical care to be the cornerstone of palliative care services. As of March 2014, theproject had provided primary-level palliative care to an average of 48,339 and secondary-level care to an average of 2,419beneficiaries each month since 2008.
The primary objective of the Arogyakeralam project isto provide palliative care to all the patients who are inneed of this service. Its larger objective under National Rural Health Mission is to ensure that palliative care becomes entirely self-subsistentand community-based.The other major objective of the project is to ensure thatpalliative care becomes an integral part of the state’s public health system.
TheArogyakeralam palliative care project has been formulated in consonance with thePain and Palliative Care Policy launched by the State Government in 2008. As per this policy, palliative care has been declared as part ofprimary healthcare and developmentof community-based homecare initiatives under theleadership of local self governments has been facilitated.This project saw an active involvement of Gram Panchayats and atleast 5% of the Panchayat Plan Fund had to be allocated to this project. The LSGIs also took additional stepsto procure external contributions to the projectand elicit greater community participation.
Source:Social Sector Service Delivery: Good Practices Resource Book 2015, NITI Aayog
Vayomithram Programme
4.132 Kerala Social Security Mission (KSSM) is implementing this programme in 5 Corporations and 29 Municipalities of the State providing welfare services to persons above 65 years. Free medicine, palliative home care, medical camps and help desk facilities are the services made available under this programme. During 2014-15, the programme assisted nearly1.28 lakh aged persons.
Age - friendly Panchayats
4.133 As a bottom up approach to eliminate abuse and neglect of the elderly, the State Old Age Policy, 2013 has been visualized introducing old age-friendly panchayats for ensuring good health, participation and assuring quality life to the elders. As a beginning, the Manickal panchayat in Thiruvananthapuram district has been selected as the first integrated age-friendly panchayat in the State. The activities to make the panchayat age friendly are being carried out by the Vridha Jana Sabha headed by the panchayat president.
Welfare of Women
4.134 According to 2011 census, 52 percent of Kerala’s population is women. There has been an endeavour made on the part of the Government to specially focus on this target group in the existing plan schemes. The present status of women in Kerala is given in the chapter on gender development. However, the activities of the statutory bodies for women empowerment and major schemes promoting social and economic rehabilitation of women are as follows.
Indira Gandhi Matritva Sahyog Yojana
4.135 This centrally sponsored scheme provides financial assistance to pregnant women of 19 years and above for the first two live births. This scheme was implemented in Palakkad district. The scheme assisted 13116 beneficiaries in 2014-15.
Snehasparsham
4.136 This scheme implemented by Kerala Social Security Mission aims to address the problem of unwed mothers. Monthly assistance of ₹..1000/- is given to all unwed mothers which has benefited 1817 women in 2014-15.
Kerala Women’s Commission
4.137 The Commission has taken steps to enhance the status of women and to enquire into unfair practices affecting women by conducting seminars and adalaths. In the reporting period the Commission had conducted 97 legal workshops/seminars, 63 counseling programmes to panchayat Jagrathasamethis, 131 adalaths, 13 DNA tests and 4 research/evaluation studies. Under gender awareness programme, the Commission undertook 30 pre-marital counseling and awareness creation in 406 schools/colleges.
4.138 In 2014, the Commission received 6621 complaints and 4042 cases were disposed. The district wise data shows that Thiruvananthapuram filed the most number of complaints while Kasaragod the least. The district wise details of complaints received as on March, 2015 are given inAppendix 4.69.
Kerala State Women’s Development Corporation
4.139 Self-employment schemes for women, flagship programme on gender awareness and construction of She- toilets are the major programmes of the Corporation. During 2014-15, the Corporation assisted 4904 women and 20000 students through various schemes. The “Suraksha @ school” project implemented in Thiruvananthapuram district ensuring safety, security and continuous monitoring of girl students while they are in school and in transit was a novel one.
Welfare of Persons with Disabilities
4.140 Disability has been recognized as one of the major causes of social exclusion. According to Census 2011, over 26.81 million people in the country equivalent to 2.21 percent of the total population are suffering from one or the other kind of disability. In Kerala this is 2.28 percent of the total population. Among the rural population, 2.37 percent are disabled and in urban it is 2.18 percent. Further, the disability rate (the prevalence of disability per one lakh population) of India is 2215. It is 2281 in Kerala and is higher among males (2463) compared to females (2113). Also it varies among the districts of the State showing highest in Alappuzha and lowest in Malappuram.
4.141 As regards types of disability, movement is highest at 22.53 per cent for both sexes and disability in speech is lowest at 5.43 per cent.
Fig 4.8
District wise Disability Prevalence Rate (per lakh population) in Kerala
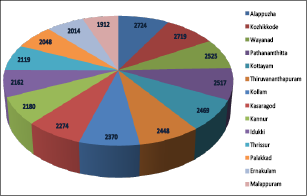
Source: Census2011
4.142 Kerala has transitioned from the earlier welfare based approach to a rights-based approach in the comprehensive rehabilitation of the disabled. Major policies and programmes in the disability sector are listed in Box 4.10.
Box 4.10
Kerala State Policy for Persons with Disabilities (PwDs)-2015
The policy envisages the following key strategic focal dimensions:
• Development dimension in the participation of PwDs in developmental processes.
• Liberation dimension for the rights of PwDs to respect their capacities.
• Protection dimension rights from abuse and participation.
• Accessibility dimension for making a positive and dynamic inter-actionable environment and attitude for inclusive development and empowerment of PwDs.
Inclusive development, enhanced individual competence and increased personal autonomy of PwDs are the broad objectives of the policy. Strategies identified for achieving these objectives are:
• Facilitation of the inclusion of disability rights, values and practices into Government developmental strategies and programming.
• Integrated management system for the coordination of planning, implementation and monitoring.
• Capacity building strategies at all levels to implement recommendations contained in the policy frame work.
• Comprehensive plan of action for strong public education and awareness aimed at changing the fundamental prejudices in Kerala society.
• Formation of state level structures such as Department of Disability Affairs, Kerala State Disability Council etc. for link strategy and policy development.
Self-representation, comprehensive approach and sustainability are the three guiding principles upon which the strategy is based.
Disability Survey
4.143 This new initiative was started based on the recommendation of the stakeholders meeting on social welfare conducted by State Planning Board during 2013-14. The primary and secondary enumeration of the survey has been completed. It is expected to publish the report by mid-2016.
Issuing Disability Certificate to Differently Abled
4.144 According to the Persons with Disability Act, 1995 it is mandatory to provide disability certificate to the disabled. From 2009 to March 2015, Kerala Social Security Mission conducted 1495 disability certification camps and distributed 283,277 identity cards.
Ashwasakiranam
4.145 The scheme implemented by KSSM provides monthly assistance to the caregivers of severe mentally challenged persons and bed ridden persons with severe physical disability. During the current year up to August 2015, assistance was given to 68,315 caregivers.
Box 4.11
State Initiatives on Disabilities (SID)
This is a special initiative of the Govt. for prevention, detection, early intervention, education, employment & rehabilitation of the persons with disabilities. This initiative is implemented by Social Justice Department in collaboration with the Department of Education and Health. The major achievements of the programme are
• MMR vaccination programme started free of cost to new-born from January, 2014 in Govt. Maternity Hospitals.
• District Early Intervention centres in 14 districts.
• Training to Anganwadi teachers in early detection of disability.
• 40 Oto Acoustic Emission Screeners were provided to Govt. Maternity Hospitals to conduct hearing screening of new- born. An average of 10,000 neonatal babies is screened every month through this programme.
• Rubella vaccination were provided to around 5 lakh adolescent girls in Govt./ Govt. aided schools
National Institute of Speech and Hearing (NISH)
4.146 The NISH set up with the objective of rehabilitating the hearing impaired persons in the State was declared as National University in the Union Budget, 2015-16. The early intervention programmes and extension services of NISH benefited 232 students. From April 2014 to March 2015, 11632 cases were attended under the hearing and speech language disorders programme and 2660 cases under medical, psychology and allied services.
State Commissionerate for Persons with Disabilities
4.147 The State Commissionerate was set up under the Act of Persons with Disabilities Act, 1995 to monitor the implementation of the Act and to redress the complaints of differently abled. The other functions of the Commissionerate are conducting awareness camps, redressal of the complaints of disabled persons through adalaths, inspection of institutions for disabled etc.
Kerala State Handicapped Persons Welfare Corporation
4.148 The Corporation is established for promoting and implementing the welfare schemes for differently abled persons. Supplying aids and appliances to disabled, self- employment scheme, financial assistance to self- help groups, vocational training to SC/ST disabled persons, etc. are the major activities of the Corporation. In 2014-15, the Corporation supplied aids and appliances to 1553 differentially abled persons and distributed 35 motorized scooters.
Ex-Servicemen & War Widows Welfare
4.149 The Department of Sainik Welfare is looking after the welfare and rehabilitation of ex-servicemen and their dependents. As on 30th March 2014, there are 167,077 Ex-service men, 53,426 widows and 295 war widows holding identity cards issued by the department. Financial assistance to Second World War veterans and their widows, construction of houses for disabled ex-servicemen, computer training to ex-servicemen/widows/dependents for re-employment and self-employment are the major activities. In 2014-15, the computer training centres at Thiruvananthapuram, Kozhikode and Thrissur rendered rehabilitation training to 157 persons.
Prisoners Welfare
4.150 In Kerala, the jail infrastructure consists of 52 jails. As on March 2015, there were 7508 prisoners, of whom 187 were women. The proportion of women prisoners in Kerala (2.49%) is lower than that in other southern states where the proportion ranged from 4 to 6 percent. Overcrowding in jails of Kerala is the major problem as it is very difficult to accommodate more prisoners. The occupancy rate (ratio of inmate population to available capacity) in prisons in Kerala is higher than that of the southern states
Fig 4.9
Occupancy Rate of Inmates in Prisons in 2014
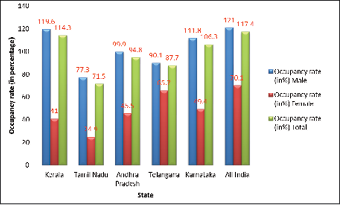
Source: Prison Statistics India-2014
4.151 Modernization of prisons and welfare of prisoners are the two major plan schemes implemented by the Department of Prison. Installation of EPABX system, CCTV in prisons, recycling of waste water units for agro use in central prisons, vocational training to prisoners on various trades like high-tech farming, plumbing &wiring, driving and jewel making were the major achievements.
4.152 Apart from this, the 13th Finance Commission awarded an amount of ₹..154crore for the development of prisons and welfare of the prisoners. Out of the 177 projects undertaken, 146 projects were completed. Establishment of high security prison, Viyyur, installation of solar energy system and energy saving measures in prisons, measures to reduce overcrowding in jails, and providing water supply arrangements in jails were the major projects. Details of prisoners in jails are given in Appendix 4.68.
Welfare of Children
4.153 Kerala’s child population (0-6years) is on the decrease. As per 2011 census, the children between the ages 0-6 years constitute only 10 percent of the total population of Kerala. Compared to 2001 census, the fall in growth rate of child population is (-16.46) percent. This decrease in child population is seen in all districts. Since children are the future human resource of the country, much remains to be done for them to enjoy their rights fully.
4.154 The 1989 UN Convention on the Rights of the Child (UNCRC) clearly specified that survival, development, protection and participation are the four parameters which constitute the rights of children.
Child Protection and Welfare
4.155 Child protection means to create a safety environment to all children from neglect, violence, abuse and exploitation. Compared to other states, Kerala is much better in protecting children from all kinds of ill-treatment and violence. Major programmes in the area of child protection are detailed below.
Crimes against Children
4.156 In Kerala, the crimes against children continue to show an upward trend with rising figures for kidnapping, sexual abuse, trafficking, etc. As per the report published by the State Crime Records Bureau, crimes against children in the State have increased by 288 percent from 2009 to 2014. Also the rate of total cognizable crimes (the incidence of crimes per one lakh of children) in the State is increased to 25.6 percent during 2014 (NCRB’s report). Whereas this rate for Andhra Pradesh is 13.1, Karnataka 17.4, Tamil Nadu 11.7 and Telangana 17.3 respectively.
Fig 4.10
Trend in Crimes against Children in Kerala (in numbers)
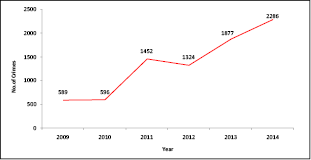
Source:Kerala State Crime Records Bureau
Kerala State Commission for Protection of Child Rights
4.157 The Commission started functioning in the State on 3rd June, 2013 as a statutory body under the Protection of Child Rights Act, 2005 and the Kerala State Commission for Protection of Child Rights Rules, 2012. It has the mandate to examine and review the existing laws for the protection of child rights and suggest remedial measures. In 2014-15, the Commission has conducted enquiry into 833 complaints involving violation or denial of Child Rights and disposed 403 cases.
Integrated Child Protection Scheme (ICPS)
4.158 ICPS provides preventive, statutory care and rehabilitation services to children who are in need of care and protection and children in conflict with law as defined in Juvenile Justice Act 2000 and its amendments in 2006. In the State, Child Protection Units, Child Welfare Committees, Special Juvenile Police Units and Juvenile Justice Boards have already been established in the entire district to speed up implementation of the provisions contained in the Juvenile Justice Act.
Adoption Services
4.159 As regards adoption services, 18 specialized adoption agencies, 5 recognized adoption placement agencies for inter-country adoption and 20 licensed adoption placement agencies are functioning in the State. From 2011-12, 627 in–country and 66 inter-country adoption took place. Under in-country category 315 were female and inter-country 34. Details of adopted children are given in Appendix 4.70.
Childline Services
4.160 Child line system is a 24-hour toll free telephone service (1098) for children in distress. The service is now available in 278 cities in India and 15 in Kerala (3 in rural and 12 in urban).
Institutional Services to Children
4.161 There are 32 Government welfare institutions in the State for the care and protection of children consisting of 14 observation homes, 8 children’s homes, 3 special homes, 5 special children’s homes attached to observation home and 2 after care homes. Apart from this, there are 1228 registered welfare institutions run by N.G.Os and Voluntary Organizations for children which has benefited nearly 0.50 lakh children. Special courts have already been notified in the State to expedite the trial of cases registered under POCSO Act, 2012.
Kerala Social Security Mission (KSSM)
4.162 The Mission was established in 2008 under the Department of Social Justice, the first organization in the country for providing social security to the weaker sections. During 2014-15, the Mission has carried out the following welfare programmes for children.
a. Cancer Suraksha for Child Patients
This flagship programme of KSSM offers free treatment to the child patients below the age of 18 through Government approved hospitals. During 2014-15, the scheme assisted 258 child patients.
b. Cochlear Implantation
The project provides cochlear implantation to the children in the age group of 0-5 years. During 2014-15, the project assisted 70 children.
c. Snehapoorvam
The scheme provides financial support to children who lost both parents or the one who is alive is not in a position to look after the child due to financial crisis. The programme implemented by KSSM
has benefited 37140 children till September, 2015.
Child Development
4.163 Kerala has always been in the forefront for promoting physical, mental, emotional and social development of children. However, mental health problems of adolescents, nutritional security issues, learning and educational problems, development delays and disabilities etc. faced by them are huge challenges. The review of major programmes and schemes implemented under child development are given below.
Integrated Child Development Services (ICDS)
4.164 ICDS is one of the flagship programmes of Government of India for early childhood development. As on March, 2015, 258 ICDS projects and 33,114 Anganwadi centres are operational across the State, covering 10.14 lakh beneficiaries under supplementary nutrition and 4.44 lakh children in the age group 3-6 years under pre-school education. The district wise beneficiaries of ICDS in Kerala are given in Appendix 4.71.
4.165 Though nutrition is provided generally through Anganwadi centres, most of these centres are operating with lack of infrastructural facilities. As per the information available, about 46 percent AWCs are functioning in rented buildings and temporary sheds. 43 percent AWCs are having drinking water facilities and 17 percent AWCs have child friendly toilet facilities. Basic infrastructure facilities and availability of play materials need to be improved in these centres for better contribution to the physical and mental development of children.
Rajiv Gandhi Scheme for Empowerment of Adolescent Girls
4.166 As a centrally sponsored scheme, launched in Kollam, Idukki, Malappuram and Palakkad districts, it aims at empowering the nutritional and health status of adolescent girls in the age group of 11-18 years through 84 ICDS projects of the districts. Extending the scheme to the districts covering coastal and tribal areas of the State was the latest development. During 2014-5, the scheme assisted 2.17lakh beneficiaries.
Psycho Social Services for Adolescent Girls
4.167 The scheme provides counseling and guidance support to adolescent girls. So far the adolescent health clinics had been covered in 807 schools across the State with the support of concerned Parent Teachers Associations and Local Self Governments.
Child Survival and Nutrition
4.168 According to District Level Health Survey-4(DLHS-4), the current rate of IMR in Kerala is 12 per thousand live births. Although, Kerala ranks first in reduction of IMR, the report of National Institute of Nutrition in 2013 reveals the IMR in Attappadi was 66 per thousand live births. Further, the target of the State Plan of Action for Children-2004 to reach IMR of 7 by 2012 has not been realized.
4.169 The problem of low birth weight babies and the prevalence of anaemia among children are other areas of concern, especially among tribal and coastal communities. In the State, 21 percent (DLHS-4) of the children between 0-5 years are underweight and 48.5 percent of children between 6-59 months have anaemia. The prevalence of malnutrition among children of all the vulnerable communities in districts likes Palakkad, Wayanad, Kozhikkode and Kasaragod is yet another matter of concern that require focused intervention in these areas.
4.170 In full immunization coverage, the State’s position is third (NHFS -3) among all states. However, the coverage has significantly dropped in recent years. As per DLHS-4, 17.5 percent of the children between 12-23 months have not received all the recommended vaccinations. The children less than 3 years, who were exclusively breastfed in the first 6 months, remain at 70 percent, and children (6-9 months) who receive breast milk and semi-solid and solid food have dropped from 85 percent to 57 percent. Appropriate intervention, close monitoring and publicity in certain segments of society are needed to address all these issues.
Box 4.12
Nutrition Policy of Kerala-2015
Government has released the Nutrition policy of the State with a view to eradicate malnutrition and achieve nutrition for all. The vision is to build a healthy State by intervention for holistic development of nutritional status of the people in a life cycle approach.
Goals
• Ensure food security and adequate nutrition for all the people.
• Reduce health inequalities.
• Eliminate undernutrition among adolescents and women.
• Provide effective therapeutic feeding for sick and malnourished children.
• Develop good nutrition status for adults and control nutrition related non communicable diseases.
• Curb the incidence of overweight by communication strategies to facilitate behavioral change for better nutrition practices.
• Adopt multi-sectorial, gender–sensitive and community based systems to promote the nutritional status of the people.
Targets
• Reduce by one-half - the prevalence of underweight and anaemia among children and women.
• Reduce by one-half - the low birth weight cases and prevalence of post-partum obesity and adult obesity.
• Eliminate iodine deficiency and vitamin–A deficiency.
• Universal access to treatment for malnourished women and sick children.
• Increase the per capita consumption of fruits and vegetables by 25 percent and halt the increase in prevalence of diabetes and cardiovascular diseases.
• Reduce by two-third - the prevalence of underweight and anaemia in SCs and STs.
Child Participation
4.171 Right to participate in decision making provides children with an environment to express their views freely. Organizing Bal Panchayats is considered one of the most effective and unique means of promoting child participation with maximum outreach.
Child Participation Programmes in Kerala
4.172 Kerala is one of the states in the country that has made substantial progress in child participation in local planning. In the State, the Bala Sabha, Bala Samathis and Bala Panchayats ensured the participation of children in the planning process at the local level. 946 Bala Panchayats and 66743 Bala Sabhas involving 10.59 lakh children were constituted in the State up to September, 2015.
Section 4
Drinking Water
4.173 There is a wrong notion that Kerala has abundant water resources. Low consciousness about the scarcity of water and its life sustaining nature, and inadequate comprehension of its economic value has resulted in its mismanagement, wastage, and inefficient use. Due to rapid urbanization, increased economic activity, changes in land use pattern and higher standard of living, the gap between the demand for and supply of water has been widening. To meet this demand, augmentation of existing water resources by development of additional sources of water or conservation of the existing resources through impounding more water in the existing water bodies and its conjunctive use is required. An integrated water management system is essential to ensure sufficient water in the entire system. Rain water harvesting and ground water recharge programme must be effectively implemented to reduce the consumption of potable water and sustainability of ground water resources.
4.174 Primary responsibility of providing drinking water facilities in the country rests with the respective state governments. However, central government formulates policies to supplement the state government initiatives through Ministry of Drinking Water and Sanitation. Accelerated Rural Water Supply Programme (ARWSP), now renamed as National Rural Drinking Water Programme (NRDWP) is the major programme of Government of India, which formulates guiding policy, sets standards, and provides funds and technical assistance to the states for rural water supply and sanitation. The 73rd and 74th amendment to the constitution has been a landmark policy shift from a supply-based approach to demand-driven strategy by providing greater role for community participation.
Status of Sources
4.175 While the State receives rainfall during both South West monsoon and North East monsoon seasons, there is a large spatial and temporal variation in the rainfall. Normal rainfall in the state is around 300 cm per year. About 85 per cent of the annual rainfall is received during the monsoon period, of which 70 per cent is received during the South West monsoon (June to September) and 15 per cent during the North East monsoon (October to December). The remaining 15 per cent rainfall is received during the non-monsoon period between January and May. However, large spatial and temporal variation in the rainfall system often leads to the paradox of abundance of water resources in one season and shortage in the next season. Moreover, due to the undulating topography with steep terrain, rainwater is quickly discharged into the sea.
4.176 As regards sources of water for drinking, Kerala depends on both surface water and ground water. Surface water sources include rivers, canals, streams, ponds, lakes, reservoirs etc. Kerala has 41 west-flowing and 3 east-flowing rivers originating in the Western Ghats. As per the national classification, none of these are major rivers. Four of them are medium rivers, whose combined discharge is less than half of that of river Krishna. The remaining 40 are minor rivers, and their combined discharge is only about one third of that of Godavari. The total annual yield of all these rivers together is 78041 Million Cubic Meters (MCM) of which 70323 MCM is in Kerala. The total storage in reservoirs of completed projects is 1133.76 Mm3. It is estimated that Kerala has approximately 995 tanks and ponds having summer storage of more than 15000 Mm³. It needs to be noted that, 67.29% of the surface water area of 3.61 lakh hectares is constituted by brackish water lakes, backwaters and estuaries.
4.177 Groundwater has been the main source for meeting the domestic needs of majority of the population besides, fulfilling a large portion of the irrigation needs of agriculture. In contrast to our neighbouring states, the availability of annual replenishable ground water and extraction of potential ground water are low in Kerala. The availability of annual replenishable ground water in Kerala is 6840 MCM and the net ground water availability is 6229.03 MCM, of which 59.25 per cent is utilized for irrigation. Present drinking water demand is at 645 million litres / day. The projected water requirement by 2021 in the industrial sector is 4270 Mm3 and for domestic requirement it at 3230 Mm3. The potential utilization of available ground water resource in Kerala is 43.24 per cent. Open well density in Kerala is perhaps the highest in the country with 200 wells per sq.km in the coastal region, 150 in the midland and 70 in the high land. Natural springs occurring in the highland regions of the state have the potential to be developed as good sources for drinking water supply and also for limited small scale irrigation, especially in remote and under developed areas.
Access to safe drinking water in Kerala
4.178 Kerala has been a model of both growth and improved income distribution through human development. Unfortunately, Kerala has not done well in the drinking water segment. Only 29.3 per cent of the houses in the State are serviced by the water supply network and just 33.5 per cent gets safe water supply which is 52 per cent less than the national average and 57 and 59 per cent less than our neighbouring states of Andhra Pradesh and Tamil Nadu.
Fig 4.11
Access to Safe Drinking Water
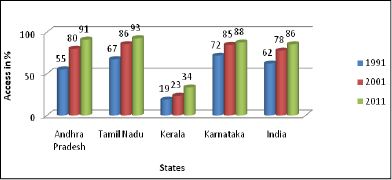
Source: MOSPI, Government of India
4.179 In Kerala 62 per cent of the households depend on wells for drinking water, 1.4 per cent of houses rely on springs, 0.2 per cent on rivers and canals and 0.7 per cent on tanks, ponds and lakes, exposing themselves to bacterial and chemical contamination. While 0.7 per cent apply hand pumps to draw water, 3.7 per cent are serviced by tube wells.
4.180 Based on the distance of water source available, Census of India 2011 classified water availability into three categories such as Within the premise, Near the premise and Away from premise*. In Kerala 78 percent of the people availed drinking water from their own premises, 14 percent of the people depending upon Near the premises and 8 percent Away from the premises (Appendix 4.72 & 4.73). However, in Idukki district, the situation is worse as 27 % avail drinking water away from the premise which is worse than the all India scenario of 18 %. The source wise drinking water availability for all district is shown in Figure 4.12.
* within the premises assigned if sources are located where household lives. Near the premise is within a range 100 mtrs. from the premises in urban areas and within a distance of 500 mtrs. in rural areas. Away from the premises is located beyond 100 mtrs. from the premises in urban areas and beyond 500 mtrs in rural areas.
Fig 4.12
Source wise drinking water availability in Kerala
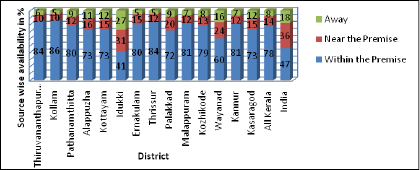
Source: Census of India 2011
4.181 In rural Kerala, 72 percent of people are having drinking water within the premises. District wise analysis shows that Kollam has the highest access of 85 percent and Idukki has the lowest access of 39 percent. Among urban regions, Thiruvananthapuram, Kollam and Pathanamthitta have the highest levels of more than 86 per cent of households having drinking water within premises and Wayanad has the lowest level of 74 percent.In Alappuzha nearly 11 percent of urban people do not have drinking water access within or nearby premises.
4.182 Rural drinking water is one of the six components of Bharat Nirman, the rural infrastructure programme of the country. Even if the existing schemes have greatly increased the coverage of safe drinking water in the rural areas of the country, the provision of drinking water to rural areas is fraught with problems. Many habitations which once came under the “covered” status have been found to slip down to the “partially covered” or even “uncovered” status. As per the Ministry of Drinking Water and Sanitation, Government of India, there are 11883 habitations in Kerala, of which 934 habitations have slipped back in 2011-12.The highest incidence is reported in Thiruvananthapuram at 19 percent, followed by Palakkad at 18 percent and Kasaragod by nearly 14 percent among the total slipped back habitations of the State.
Quality of Drinking Water in Kerala
4.183 Kerala is one of the most vulnerable states in the country, in terms of water quality. Quality of water varies from source to source and even place to place. In general, ground water is held to be of better quality than surface water. However, it cannot be generalised. Data available from the results of Field Test Kit under the National Rural Drinking Water Programme, Ministry of Drinking Water and Sanitation indicate 40.2% of the sources tested under the scheme NRDWP in rural Kerala have been contaminated with chemical contaminants like iron, fluoride, salinity, nitrate, arsenic, and biological contaminants like faecal coliform. About 3.6 % of the contaminated sources had multiple contaminations. Unscientific waste disposal, unplanned construction of toilets in high population density areas, discharge of industrial waste etc. are the major reasons. Most of the states which had chemical and bacterial contaminations have been successful in reducing the contamination level over the years. However, Kerala’s performance in the regard has been poor. The quality profile of drinking water in Kerala and other southern states is shown in Figure 4.13.
Fig 4.13
Quality Profile of Drinking Water in Kerala
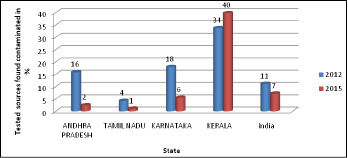
Source: Ministry of Drinking Water and Sanitation,GoI,(FTK Test)
4.184 Among the districts, Alappuzha and Palakkad are fluoride affected regions; and Thiruvananthapuram dominated in bacteriological contamination of faecal e-coli. Many cases with multiple contaminations were seen in Palakkad, Thiruvananthapuram, Kollam and Alappuzha.
4.185 ‘Environmental Monitoring Programme on Water Quality’ is a project initiated by Kerala State Council for Science, Technology and Environment in 2008, and implemented by Centre for Water Resources Development and Management. Water quality monitoring is done on a river basin scale. Both surface and ground water sources are tested and detailed analysis is done. It aims to create a database on water quality and to use the derived information for practical applications in the management of water resources and their effective utilisation. The objective is to cover all 44 river basins in Kerala. Five reports have been brought out so far.
Table 4.17
Reports of Environmental Monitoring Programme on Water Quality
Report Number |
Year |
Basin covered |
One |
2009 |
Kabani, Periyar, Neyyar |
Two |
2010 |
Karamana, Meenachil, Kadalundy |
Three |
2011 |
Pamba, Chalakudy, Bharatapuzha, Anjarakandy, Thalasseri, Mahi |
Four |
2012 |
Kuttiyadi, Chaliyar, Kallai, Achencoil |
Five |
2013 |
Valapattanam,Kallada, Keecher-Puzhakkal, Chandragiri |
Source: Kerala State Council for Science, Technology and Environment
4.186 The reports highlight physical, chemical and microbiological contamination in water which could pose concerns for the population dependent on them. Many of the parameters in water analysed, were found to be beyond the BIS limits.
Water Quality Standards
4.187 Depending on the impact of concentration of various ions in water on human health various standards have been laid down by different agencies. These standards are useful for deciding the suitability of water for drinking purpose. The drinking water standards laid down by Bureau of Indian Standards (BIS) and Indian Council of Medical Research (ICMR) are presented in Table 4.18.
Table 4.18
Drinking water standards
Sl. No. |
Parameters |
Prescribed by |
|||
BIS (IS 10500-91) |
ICMR |
||||
Desirable Limit |
Max. permissible Limits in the absence of alternate source |
Desirable Limit |
Max. permissible limits |
||
1 |
2 |
3 |
4 |
5 |
6 |
1 |
PH |
6.5 to8.5 |
No relaxation |
7.0 – 8.5 |
6.5 – 9.2 |
2 |
Total dissolved solids mg/L |
500 |
2000 |
500 |
1500-3000 |
3 |
Total hardness as CaCO3 mg/L |
300 |
600 |
300 |
600 |
4 |
Calcium as Ca mg/L |
75 |
200 |
75 |
200 |
5 |
Magnesium as Mg mg/L |
30 |
100 |
50 |
- |
6 |
Chloride as Cl mg/L |
250 |
1000 |
200 |
1000 |
7 |
Sulphate as SO4 mg/L |
200 |
400 |
200 |
400 |
8 |
Nitrate as NO3 mg/L |
45 |
100 |
20 |
100 |
9 |
Iron as Fe mg/L |
0.3 |
1 |
0.1 |
1 |
10 |
Fluoride as F mg/L |
1 |
1.5 |
1 |
1.5 |
11 |
Arsenic as As mg/L |
0.05 |
0.05 |
- |
0.05 |
12 |
Manganese as Mn mg/L |
0.1 |
0.3 |
0.1 |
0.5 |
13 |
Zinc as Zn mg/L |
5 |
15 |
0.1 |
5 |
14 |
Copper as Cu mg/L |
0.05 |
1.5 |
0.05 |
1.5 |
15 |
Chromium as Cr mg/L |
0.05 |
0.05 |
- |
- |
16 |
Lead as Pb mg/L |
0.05 |
0.05 |
- |
0.5 |
17 |
Mercury as Hg mg/L |
0.001 |
0.001 |
- |
0.001 |
18 |
Cadmium as Cd mg/L |
0.01 |
0.01 |
- |
0.01 |
19 |
Cyanide as CN mg/L |
0.05 |
0.05 |
- |
0.05 |
20 |
Minerals Oil mg/L |
0.01 |
0.03 |
- |
- |
21 |
Phenolic compounds mg/L |
0.001 |
0.002 |
- |
- |
22 |
Total Coliform MPN/100 ml |
1 |
10 |
- |
- |
23 |
Residual free chlorine mg/L |
0.2 |
- |
- |
- |
24 |
Aluminium as A1 mg/L |
0.03 |
0.2 |
|
|
25 |
Boron as B mg/L |
1 |
5 |
|
|
26 |
Selenium as Se mg/L |
0.01 |
- |
|
|
27 |
Pesticides |
Absent |
0.001 |
|
|
Source:Central Ground Water Board
Note – Indian Standard, Drinking Water Specification (Second Revision) BIS (IS 10500:2012)
has also been recently published by the Bureau of Indian Standards
Water Supply System in Kerala
4.188 The drinking water system in Kerala can be classified broadly into three categories:-
1. Water supply through the schemes owned and operated by the government via Kerala Water Authority (KWA) and Local Self Government Institutions.
Kerala Water Authority (KWA) is the primary drinking water supplier in the State. KWA operates throughout the State and is involved in both urban and rural water supply. Apart from state schemes, schemes receiving funds from Govt of India, NABARD and LSGs are also implemented by KWA.
Box 4.13
Accelerated Rural Water Supply Programme
Accelerated Rural Water Supply Programme (ARWSP) was introduced in 1972 to assist states and union territories to implement drinking water supply schemes in villages. The programme was changed to a Mission approach when the Technology Mission Scheme on Drinking Water Management, called the NDWM was introduced in 1986.NDWP was renamed as Rajeev Gandhi Rural Drinking Water Programme. Objective of the scheme is to meet the emerging challenges in the rural drinking water sector related to availability, sustainability and quality of water. Components pertaining to the State under this programme are coverage, sustainability, quality, natural calamities, operation and management (O&M) and support activities. The funding pattern will be 47 per cent for coverage, 20 per cent for water quality, 15 per cent for O&M, 10 per cent for sustainability, 5 per cent for support activities and 3 per cent for water quality monitoring and surveillance (WQM&S). For coverage, O&M and quality the cost sharing is 50:50 between the Centre and the State. In the case of sustainability, support activities and WQM&S funds are received as 100 per cent grant in aid from central government. As per the guidelines of National Rural Drinking Water Programme (NRDWP), Government of India has instructed the state governments to share the total project cost of the ongoing/ new schemes under ARWSP approved by the State Level Sanctioning Committee (SLSC) in the ratio 50:50 between the centre and the state governments. There are 178 ongoing schemes in Kerala that use ARWSP funds.
Source:Ministry of Drinking and Water Sanitation, Government of India.
4.189 As on 31.03.2015, the number of water supply schemes run by Kerala Water Authority is 1263. Out of which 49 are urban water supply schemes and 1214 rural water supply schemes. Among the rural schemes, 137 are multi-panchayat schemes and 1077 are single panchayat schemes Appendix 4.74 to 4.82 gives the details of water supply schemes run by Kerala Water Authority in the State.
JICA Project
4.190 JICA (Japan International Cooperation Agency) assited Kerala Water Project envisages the implementation of five water supply projects in Thiruvananthapuram, Cherthala, Meenadu, Kozhikode and Pattuvam at a total estimated cost of ₹.2987.40 crores. Physical progress as on March 2015 is 94% and the full distribution is expected during the year 2016-17.
Jalanidhi
4.191 Jalanidhi is a World Bank aided rural water supply and sanitation project. It is based on the cardinal concept of sector reform like demand responsiveness, community ownership and sustainability of investment through cost recovery. Kerala Rural Water and Sanitation Agency (KRWSA) is the implementing agency functioning under the Department of Water Resources, Govt. of Kerala. District wise population covered by water supply schemes implementeed by KRWSA is given in Appendix 4.83 Activities under Jalanidhi are Small Water supply schemes, comprehensive water supply scheme,construction of latrine, ground water recharge and drainage works.Jalanidhi – II is targeted to complete the entire project within 5 ½ years from 01-01-2012 to 30-06-2017.Physical target of the scheme is to cover about 18 lakh rural people for water supply and sanitation services. The project will cover 200 Grama Panchayats of Kerala. Grama Panchayats are selected from among the neediest eight districts of Kerala.Physical achievements of Jalanidhi are given in Appendix 4.84 and Appendix 4.85.
Box 4.14
Mazhapolima: An innovative approach to water security
Mazhapolima is a participatory climate change adaptation initiative launched by the State Governmentin Thrissur district in 2008 to address the problem of water scarcity. The project helps in water conservation by harvesting rainwater from rooftops and feeding it into open dug wells, which traditionally form the water security mechanisms of the State. A notable feature of this initiative was the active participation of Gram Panchayats, private agencies and beneficiaries which led to installation of over 10,300 Mazhapolima units with governmentsubsidy.
Mazhapolima was started in May 2008 under the leadership of the then District Collector with the objective to enhance the water table andincrease water availability in open dug wells throughout the year; improve the quality of water in open dug wells; reduce public spending on water tankers, and reduce saline intrusion into open dug wells along the coastalline.
Under this model, rainwater from rooftops is collected and filtered before being routed down to recharge open dug wells. This also leads to the formation of a fresh water zone atthe source of the dug wells. Mazhapolima units adopted two types of techniques. One technique is roof-top harvesting with sand filter,where PVC gutters are fixed to collect roof-top water, which is then diverted to the filter using a PVC pipe.The filter consists of sand, metal and charcoal. Thistechnique costs ₹.. 2,500-3,750 per unit. The secondtechnique is roof-top harvesting with ordinary nylonfilter, through which the roof-top water is harvestedand diverted to the well through a nylon or clothfilter using a PVC pipe. This option reduces the costto ₹.. 1,250-2,500 per unit.
There are many stakeholders involved in the project –households and institutions facing water scarcity, the DistrictCollectorate, the District Rainwater Harvesting Mission, the Revenue Department, Arghyam, Panchayati RajInstitutions (PRIs), the Department of Education, the State Planning Board, the Department of Rural Development,the State Bank of Travancore, the Thrissur Pooram City Chamber, and the Malayalam Manorama Group.
The concept of rain harvesting is not new. But Mazhapolima clearly demonstrated the ability to respond to a common need with a simple but effective solution that covers four key components – innovation, awareness generation, grievance redressal and trainings. It represents a low cost and an effective climate adaptation strategy which is suited for adoption in other parts of the State.
Source:Social Sector Service Delivery: Good Practices Resource Book 2015, NITI Aayog
Issues and Concerns in the sector
4.192 The primary concern regarding drinking water is whether there is enough water to address the consumer demand, both at present and in future. Kerala Water Policy 2008 recognises the fact, and has accorded the highest priority to the domestic use of water. Kerala is perceived to be abundant in water, but due to multiple factors, it is also occasionally faced with the problem of scarcity, especially in the case of drinking water.
4.193 Rivers form a major source of our drinking water supply schemes. Large scale pollution & contamination, changes in the flow patterns, fall in the level of water etc are issues posing challenges. Water bodies like ponds and lakes are also under threat. Changes in land use pattern have lead to the abandoning of water bodies leading for less water storage facility. Many such water bodies are encroached, filled and the land used for other purposes. Some others have been turned into sites for dumping waste. It is observed that the rate at which ground water is being replenished is falling in Kerala. Fall in the cultivable land particularly paddy field is one of the major reasons for the low level of ground water recharge in the State. This has had an adverse impact on the water levels of wells in the State. Water levels in wells have been declining over the years. Recharge of potential resources through the conservation of wetland is a pre-requisite for meeting the long term need of the State.
4.194 Urbanisation poses a major challenge to the provision of safe drinking water. These challenges emerge for two reasons: one from the ever increasing demand both from domestic as well as industrial needs and second, the dependence on water sources which are located at faraway places. The pace of urbanization in Kerala is high as compared to other states in India. Percentage of Urban Population is 31 in India, while it is 47 in Kerala. Major problems associated with rapid urbanization are lack of universal accessibility of drinking water, ineffective distribution of water supply, high level of pollution, water shortage, wastage due to old leaking pipes etc. Primary source of pollution in the urban region is the untreated industrial and domestic wastewater. Even if technical solutions have brought significant changes, wastewater treatment is still a problem in Kerala. Industries discharge hazardous pollutants like phosphates, sulphides, ammonia, fluorides, heavy metals and insecticides into the rivers. Kerala State Council for Science, Technology and Environment estimated that nearly 260 million litres of industrial effluents reach the Periyar estuary daily from the Kochi industrial belt. It is noticed that rivers such as Chalakudy, Muvattupuzha, Meenachil, Pamba and Achenkovil are highly polluted with bacteriological contamination.
4.195 It is generally observed that, Water Supply Schemes for Drinking water which can address the concerns of the State involve huge costs and often have long gestation period. Funding and financing such projects is a major issue. Acquisition of land for projects is also a major hurdle. Timely maintenance and upgradation of the existing infrastructure is another area calling for greater attention. Many of the schemes in Kerala supplying water for only part of the day. It means that water supply is available for only part of the day. Enhancing the capacities, to provide 24 X 7 water supply is challenge. Issues in specific regions like hill areas, coastal areas, and quality affected areas cannot be addressed with the traditional methods. They need to be solved through unconventional yet modern technological interventions which are not forthcoming.
Box 4.15
National Workshop on Issus and Challenges of Drinking Water Management in Kerala
In order to identify methods and measures for integrated and sustainable drinking water management in different hydro -climatic areas of the state and to see certain pockets of interventions through the pilot projects, a national workshop was organised by Kerala State Planning Board, in association with Kerala State Council for Science, Technology and Environment (KSCSTE).The workshop was designed under three key themes viz. i) Water Quality Management and Conservation, ii) Integrated Water Resource and Management and iii) Water Governance and Institutional Mechanism. Some of the recommendations emerged in the workshop are given below.
• Water Safety Plan of World Health Organisation has to be adopted. Foreseeable harm is to
be identified, prevented and reasonable measures are to be taken to protect the consumer.
• For long term water security, water management and land management should go together.
• Paradigm shift needed from supply augmentation to demand management and water
conservation.
• Scientifically verified database. Every person who is paying tax should be able to verify
the data base.
• Pricing system must be more realistic.
• Existing reservoirs are to be integrated and first priority should be given for drinking water.
• Co-existence of traditional & modern technology should be adopted.
• Location specific approach for water security and management is essential
• Inclusive aspect is necessary. Still nearly 22 % of population is not having any kind of
water source. These people must be covered with adequate service level. There is also
an inter-district and intra district variations in the state which calls for an active intervention
to reduce the gap.
• Shift needed from asset creation to asset management. It is essential to maintain
minimum fund for asset management for life cycle of the water supply projects.
• Quality hit areas should be identified first for intervention
• Certification of well water is vital.Some people can be trained to study or certify as per
Bureau of Indian Standard,WHO etc.
• Post construction support for community management schemes is crucial. Technical
handholding is essential for community management schemes. Proper capacity building
for beneficiary groups is essential.
• A holistic knowledge management strategy is needed to inform the decision making
process which needs to be institutionalized in the government structure.
As an initial intervention, two schemes pertaining to inclusion aspect and the asset management for life cycle water supply projects have been incorporated in the Annual Plan 2016-17.
Source: Social Services Division, State Planning Board
Effective Water Management
4.196 Sustainable management should be the strategy for Kerala’s endeavours in the sector in the future. It is now being recognised that management of water in the State needs a holistic and integrated approach. This is visible in Kerala Water Policy 2008. However, the State needs to work more in some areas of water management.
4.197 Of foremost importance is a co-ordinated action plan for the state involving specific and measureable steps in terms of targets for the wide spectrum of stakeholders. The fact that water, waste management and sanitation go hand-in–hand needs to be accepted. Rather than providing water, the emphasis must shift to conserving water and promoting the 3 R’s – Recover, Reuse and Recycle. Greater emphasis on demand management is also the need of the hour. Many of the developed nations have introduced steps to reduce their overall water consumption across sectors by 2050 through better water management measures and reduction in per capita water consumption. Kerala has to device mechanisms to promote efficiency in the use of water. The best practices in management have to be introduced for utilisation of water. Greater social awareness about the rights and responsibilities in the use of water and enhanced people’s participation in water management can bring about a sea change in Kerala. Social Audit is a good tool. Pricing of water is an issue which need greater attention. Rain water harvesting, an effective process to utilize water, has to be implemented with more vigour in the state. The ‘polluter pays’ principle can be enforced to curb the menace of pollution. The state can also accord greater priority for promoting & supporting the development, adaptation and dissemination of new and appropriate technologies for water management.
4.198 Water, which was till recently considered a free good, has become scarce and unless carefully managed, can become a highly priced economic good in future. All efforts should be made to ensure that the basic human entitlement of safe and adequate drinking water is available to all. Priority should be given to sound water management through active participation of all users and effective regulation by government.
Section 5
Gender Development
4.199 Questions involving the status of women and gender disparities prevailing in societies have become subjects of debate and action in recent years. Governments and policy makers have begun to recognise the demands for basic rights of a segment that constitutes half of the total population. All over the world, women are being accepted as active and potential agents in all public realms. Since 1995, UNDP has been publishing gender disaggregated Human Development Indices such as Gender Development Index (GDI) and Gender Empowerment Index (GEM). The indices capture gender specific status of health, education, economic participation, control over economic resources, political participation etc. and UNDP ranks the countries according to the values of these indices.
4.200 The Gender Inequality Index (GII) is the latest index for measurement of gender disparity which was introduced by UNDP in Human Development Report, 2010. Gender inequalities in three important aspects of human development are measured by this index. The three aspects are 1) reproductive health (which is measured by maternal mortality ratio and adolescent birth rates), 2) empowerment (measured by proportion of parliamentary seats occupied by females and proportion of adult females and males with secondary education) and 3) economic status expressed as labour market participation. The GII of 155 countries has been calculated and according to the value of GII, these 155 countries have been ranked. India’s rank in Gender Inequality Index is 130 and the GII value of India is 0.563 while that of top ten countries is below 0.05. The indicators “highlight areas in need of critical policy intervention and it stimulates proactive thinking and public policy to overcome systematic disadvantages of women” (Human Development Report, 2015).
4.201 Among the Indian states, Kerala is known for its impressive human development achievements. With regard to the GII components, the indicators of maternal mortality rate, adolescent birth rates and proportion of adult females with secondary education are impressive in Kerala. But the indicators of labour market participation and proportion of parliamentary seats occupied by females show that, Kerala’s performance is poor and is below all India average. Hence, a paradoxical situation of high achievements and equality in health and education dimensions with poor performance and inequality in terms of economic and political participation exists in the State.
4.202 Women constitute 52% of the state’s population. The overall sex ratio of Kerala is 1084 females per 1000 males. A comparison of Sex Ratio across States are given in the following figure.
Fig 4.14
Sex Ratio in Kerala in comparison to neighbouring States

Source: Census of India, 2011
Literacy and Education
4.203 The Female Literacy Rate in Kerala (92%) is the highest among Indian states. However, the Male Literacy Rate in Kerala is still higher at 96%. Hence a small gender gap exists.
Table 4.19
Literacy rate- Kerala 1951-2015
Year |
Persons |
Male |
Female |
1 |
2 |
3 |
4 |
1951 |
47.18 |
58.35 |
36.43 |
1981 |
78.85 |
84.56 |
73.36 |
1991 |
89.81 |
93.62 |
86.17 |
2001 |
90.92 |
94.20 |
87.86 |
2011 |
93.91 |
96.02 |
91.61 |
2012 |
93.95 |
96.21 |
91.99 |
2013 |
94.01 |
96.41 |
92.09 |
2014 |
94.36 |
96.67 |
92.65 |
Source: Kerala State Literacy Mission Authority
4.204 In the case of education, enrolment is universal at the primary level and gender parity has been achieved. Girl students constitute 49.4 % of total student enrolment in schools, showing more or less uniformity. Girls outnumbered boys in terms of enrolment in higher secondary education at 52.73%. Dropout rates are low for both boys and girls. At the tertiary level also, the enrolment of girls is higher than boys. For example, girls constitute 68.66 percent of total enrolment for degree courses in various Arts & Science colleges under the four general universities in Kerala during 2014-15. When Post Graduation is considered, the girls’ position is highest with 75.54%. Hence, girls are well off in terms of education in Kerala. But when the intake of girls in engineering colleges and polytechnics is considered, the situation is different. Out of the total enrolled students, girls constitute only 40.23% in engineering colleges and 32.76% in polytechnics.
Table 4.20
Girls’ in Enrolment- at Different levels-2015-16
|
Boys |
Girls |
Total |
% of Girls |
School Education |
1907811 |
1864910 |
3772721 |
49.43 |
Higher Secondary |
168191 |
187606 |
355797 |
52.73 |
Graduation |
226500 |
155520 |
70980 |
68.66 |
Post Graduation |
14029 |
22883 |
30294 |
75.54 |
B Tech |
4022 |
2348 |
6370 |
36.86 |
M Tech |
607 |
768 |
1375 |
55.85 |
Total Engineering |
4629 |
3116 |
7745 |
40.23 |
Polytechnic |
10518 |
21587 |
32105 |
32.76 |
Source: DPI, DCE and DTE, 2015
Health Status of Women in Kerala
4.205 Most of the health indicators in Kerala are highly favourable to women. Life Expectancy at birth of women in Kerala at 76.9 years is the best in India. It is much higher than than the national average at 67.7 years. As per the figures released by Registrar General of India in Dec 2013, the Maternal Mortality Rate for India in the period 2010-12 was 178 per 1,00,000 live births. Corresponding figure for Kerala is much lower at 66 per 1,00,000 live births.
Table 4.21
Health Status of Women
Sl. No |
Indicator |
Kerala |
India |
|
1 |
Death Rate |
|
6.9 |
7 |
|
|
Male |
7.9 |
7.5 |
|
|
Female |
6 |
6.4 |
2 |
Infant Mortality Rate |
|
12 |
40 |
|
|
Male |
10 |
39 |
Female |
13 |
42 |
||
3 |
Female age at effective marriage |
|||
(a) Below 18 |
16.7 |
16.3 |
||
(b) 18-20 |
19.2 |
19 |
||
(c) Above 21 |
24.4 |
23.9 |
||
(d) All age |
24.4 |
20.7 |
||
4 |
Maternal Mortality Ratio |
66 |
178 |
|
5 |
Expectancy of Life at Birth |
Male |
71.4 |
62.6 |
Female |
76.9 |
67.7 |
||
Source: Directorate of Health Services
Women’s Participation in Employment
4.206 Women of Kerala outperform their counterparts in many developmental indicators. But in the case of economically active persons, the indicator is not favourable to women. In countries with high human development, the share of economically active women seems to be high. Labour Participation Rate (LPR) of women in 10 countries having highest Human Development Index is around 60 and that of men is around 70 (Human Development Report, 2015). But as per the 68th Round of NSSO, a wide gap between male and female LPRs. is seen in the State. The female LPR in Kerala is 35.4 and that of male is 82.4. Consequently the difference between Male and Female LPR in Kerala is very high.
4.207 As per Census 2011, the FWPR of the state has increased by 2.8 points in the last decade. Four districts of the State namely: Kannur, Kozhikode, Malappuram and Pathanamthitta have FWPR which is lower than that of the State as a whole. Moreover, the performance of Kozhikode and Malappuram is too poor. Two districts, namely Wayanad and Idukki have FWPR which is higher than the all-India rate. Idukki has the highest FWPR in the State as the women in the rural sector of the agrarian district are more economically active. The district-wise comparison is provided inAppendix 4.87.
4.208 It is surprising to note that Female LPR is much higher in some of our neighbouring countries, whose HDI rank is lower than that of India. For example Female LPR in Bhutan is 66.4, in Cambodia is 78.9, in Bangladesh is 57.3, in Nepal is 54.3, and in Myanmar is 85.7 (Source: Human Development Report 2014). It is often argued that, it may not be possible to increase the LPR of a country beyond a particular level due to various educational and family commitments of persons. So a very high FLPR of this kind may not be feasible. However, it cannot be ignored that less women in labour force means under-utilization of human resources that holds back productivity and economic growth.
4.209 Likewise, when we consider the Work Participation Rate (WPR) of women in Kerala, it is lower than that of many states in India as well as all India average. According to Census 2011, the average WPR is 25.21 in India and that of Kerala is only 18.23. A comparison of FWPR in Kerala and India as well as WPR of males and females in Kerala is shown in Figure 4.15. The FWPR of Kerala is one of the lowest in the country, and far below the national level.
Fig 4.15
Female Work Participation Rates in India and Kerala
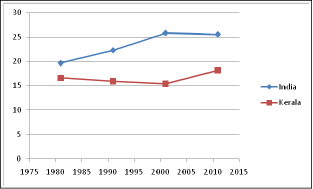
Source: Census 2011
4.210 Moreover, WPR of females in Kerala is much lower than that of males. FWPR has been increasing in India and Kerala, but the growth of FWPR in Kerala is very slow. Kerala stands first in human development among the Indian states. But the wide gender gap in the WPR pulls down our gender equality in human development.
Fig 4.16
Work Participation Rates of Males and Females in Kerala
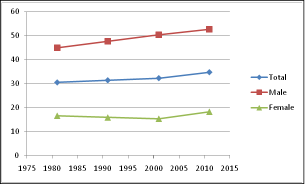
Source: Census 2011
4.211 Himachal Pradesh with a female workforce participation rate of 44.82 is the best performer. It is surprising that the North-eastern states like Nagaland, Sikkim, Manipur, Mizoram, Arunachal Pradesh and Meghalaya have higher FWPR than Kerala (NSSO Report, 68th Round). Hence it is high time to have a relook at our strategies in this direction and perhaps learn from experiences elsewhere.
4.212 Role of self employment in enhancing the share of economically active women is very important in a state like Kerala where the educational level of women is very high. Surprisingly, even with a large number of opportunities for self employment, the share of female self employed workers seems to be significantly lower in Kerala than many other states in India. The percentage of female self employed workers (FSEW) in Kerala is 36.4 in rural area and that in urban area is 36.3. But in rural areas, percentage of FSEW is 89.5 in Arunachal Pradesh, 87.9 in Himachal Pradesh, 94.9 in Nagaland and 90.2 in Sikkim. In all these North Eastern states, FWPR is above 35% (NSSO Report, 68th Round).
4.213 Gender disaggregated data on employment can capture a clearer picture of women’s economic empowerment. The sectoral distribution of employment of women in Kerala presents in Table 4.22 shows that women are more engaged in agriculture but more males are engaged in service and industry.
Table 4.22
Sectoral Distribution of Employment in Kerala
Persons |
Agriculture |
Industry |
Service |
Male |
22.8 |
32.4 |
44.8 |
Female |
31.9 |
30.4 |
37.7 |
Total |
25.5 |
31.8 |
42.7 |
Source: NSSO Report, 68th Round
4.214 Membership of females in different Welfare Fund Boards in Kerala shows the participation of women in some specific industries (Appendix 4.86). It is clear that women’s participation in traditional industries is very high in which wage/ remuneration is comparatively low. For eg., among cashew workers and beedi workers, women constitute 95% and 99% respectively.
Inequality in Wage Rates
4.215 Women are engaged in agricultural work as well as in traditional industries ( which are mainly coming under informal and unorganized sector) in India as well as in the State (Census, 2011). But in terms of wages and remuneration, significant gender inequality exists in the unorganized sector. Table 4.23 shows average daily wage rates in agricultural occupations in the State in comparison to all India.
Table 4.23
Average Daily Wage Rates in Agricultural Occupations in Rural India during March, 2015
State |
Sowing (including Planting/ Transplanting/ weeding workers) |
Gender Attainment* Index |
Harvesting/Winnowing/ Threshing workers |
Gender Attainment Index |
||
Male |
Female |
Male |
Female |
|||
AP |
233.87 |
163.46 |
0.70 |
235.32 |
192.42 |
81.77 |
Kerala |
638.29 |
446.88 |
0.70 |
582.14 |
439.1 |
75.43 |
Bihar |
225.5 |
185.51 |
0.82 |
218.13 |
196.3 |
89.99 |
Tamil Nadu |
317.72 |
233.51 |
0.73 |
393.55 |
201.72 |
51.26 |
All India |
238.67 |
194.32 |
0.81 |
238.43 |
203.16 |
85.21 |
Source: Wage Rates in Rural India, Ministry of Labour & Employment, Govt of India
• Gender attainment index of wage rate is calculated by female wage rate /male wage rate.
Fig 4.17
Male –Female Wage Rates for Sowing in Kerala
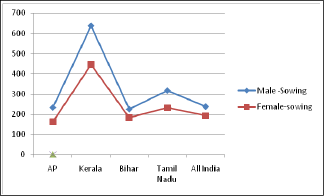
Source: Wage Rates in Rural India, Ministry of Labour & Employment, Govt of India
4.216 Though, the wage rates of women in Kerala is higher than that in other states and all India average, it is much lower than that of males. (see Figure 4.18)
4.217 For Gender Development to be effective, the women of Kerala should be empowered economically and socially. Economic empowerment and social empowerment are complementary to each other. The economic empowerment of the women is attained only when they become an integral part of labour force and ultimately be gainfully employed.
Women in Political Leadership
4.218 Political representation is taken as an important dimension to measure Gender position in many of the Indices currently being used. For example, Gender Inequality Index developed by UNDP measures empowerment, by the proportion of parliamentary seats occupied by females. The Global Gender Gap Report brought out by World Economic Forum measures political empowerment in terms of percent of women in parliament, percent of women holding ministerial positions, and years of women in executive office.
4.219 Achievements in health and education have empowered the women of Kerala and enabled them to take part in the practices of democracy. It is an essential condition for Equal Democratic Citizenship but not a sufficient one. Equal Democratic Citizenship will be complete only when the women get equal participation in direct decision making too. It is in this regard that the representation of women in legislative bodies becomes important. Political participation must not be restricted to casting votes during elections to decision making bodies. Rather women must occupy leadership positions in decision making bodies. Women of the state can be empowered through their direct participation in policy making. A fitting example is the local governments in Kerala, where 50% of the seats are reserved for women.
4.220 Gender empowerment is meaningful only if women have decision making powers in high bodies like Parliaments. The developed nations with high HDI levels have a much higher representation of women in their legislative bodies. When the top 8 countries of Norway (39.6%), Sweden (44.7%), Iceland (39.1%), Denmark (39.1%), Belgium (38.9%), Finland (42.5%), Netherlands (37.8%) and Cuba (48.9%) are considered, it can be seen that the percentage of women in legislative bodies is above 37% (The figure in parenthesis is the percentage of women in national parliament in the respective country).
4.221 However the accomplishment of the State with respect to women’s representation in the Central and State Legislative bodies is poor. The same is the case when we take women in India as a whole. It is quite surprising that the women’s status in the State in this regard is lower than that of many states in India and all India average.
Table 4.24
Elected Women in Lok Sabha- India and Kerala
Year |
All India |
Kerala |
||||
Total No. of Seats |
Women |
% of Women |
Total No. of Seats |
Women |
% of Women |
|
2009 |
543 |
58 |
10.7 |
20 |
0 |
0 |
2014 |
543 |
62 |
11.5 |
20 |
1 |
5 |
Female Representation in Legislature – Kerala
Sl No. |
Name of Legislature |
Number of Women |
Total no of seats |
% |
Kerala Legislative Assembly |
|
|
|
|
|
2006 |
7 |
140 |
5 |
|
2011 |
7 |
140 |
5 |
Source: Worked out from data available at the Website of the Lok Sabha,
Rajya Sabha & Chief Electoral Officer, Kerala
Crimes against Women
4.222 As per the figures brought out by the State Crime Records Bureau, the total reported cases of crime against women for the year 2015(upto September) is 9344 which registers a decline from 10690 in 2014 (For details see Appendix 4.89). It is surprising that ‘cruelty by husband/relatives’ still constitutes a major component in crime against women. As per data from National Crime Records Bureau, Kerala is a state where ‘Rate of total cognizable Crimes’ (incidence of crime per one lakh female population) is much higher than the national level. Even when we want women to come out of their homes and take up employment, the insecurities within the family remains. Greater efforts are required in this direction, to enable women to take up meaningful economic activities outside the purview of their families.
Fig 4.18
Crime against Women in Kerala
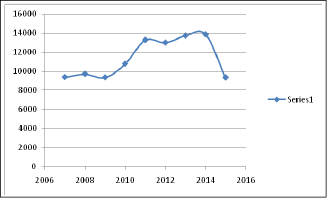
Source: State Crime Records Bureau
Gender Budgeting
4.223 As policies and programmes have a differential impact on women and men, it is necessary to strengthen Gender Responsive Budgeting. The Gender Budget Statement is an important tool for bringing together all information regarding allocations for women. It is now considered as an instrument to address gender inequality and reallocate the resources in favour of women. It serves as a reporting mechanism and provides an indication of funds flowing to women. It is a major step in strengthening inclusive growth.
4.224 To institutionalize the process of Gender Budgeting, the Gender Budget Statement had been introduced in the Union Budget 2005-06. In Kerala Budget, conscious efforts have been taken to make the budget Gender Responsive and Gender Sensitive. With the inclusion of Women Component Plan (WCP) in local bodies’ annual plan and by making it mandatory, a gender-responsive budget was introduced in the state of Kerala at the time of 9th Plan itself. . With the devolution of 35-40% of funds from the state to the Local Self-Government Institutions (LSGIs), the first form of Gender budgeting was seen in the state in 1996 where each Panchayat was directed to prepare a chapter on the status of women in their development plan document. WCP was introduced during 9th plan wherein 10% of the plan outlay of the local bodies had to be set apart for needs of women or women specific projects. Plan allocation and expenditure of total plan and WCP of local bodies during 11th and 12th (first three years) are given in the following Table. (For sub sector wise details see Appendix 4.90)
Table 4.25
Percentage of Allocation and Expenditure of WCP Projects to the
Total Allocation and Expenditure
Five Year Plan |
% of WCP allocation |
% of WCP Expenditure |
11th Plan |
13.22 |
12.35 |
12th Plan- first three years |
10.63 |
10.7 |
Source: IKM
4.225 Compared to 11th plan, percentage of WCP allocation and expenditure have fallen during 12th plan. Allocation fell from 13.22% to 10.63 and expenditure from 12.35 to 10.70. While sector wise allocation of fund is taken, it is seen that more fund is allocated to service sector under WCP during both the plans. But share of production sector has come down from 36.74% during 11th plan to 25.1 % during 12th plan.
Fig 4.19
Sector-wise allocation of Funds under WCP in Kerala (11th Plan)
Sector-wise allocation of Funds under WCP in Kerala (12th Plan)
4.226 The Women Components identified in Annual Plan 2014-15 and 2015-16 are provided in Appendix 4.88. Agriculture & allied activities, Industries, Labour & Labour Welfare, Social Security & Social Welfare etc are some sectors with major allocations under the Women Component.
4.227 Gender continues to be an important component in Kerala’s development. After all the measures that the State has taken in these years status of women in the society still remains a problematic area requiring urgent attention and serious interventions. The buzzword in Gender and Development in the contemporary times is “empowerment” and Kerala is definitely lagging behind in this area. Women’s status is directly related to questions of power that women actually possess in social and economic situations. It is high time that serious measures are adopted in this direction so that women in the state have a prominent role in all walks of life.
Section 6
Welfare of Scheduled Castes, Scheduled Tribes,
Other Backward Classes and Minorities
4.228 One of the major concerns in post Independent India has been the welfare and development of weaker sections of the society, especially that of the Scheduled Castes and Scheduled Tribes. These groups have, for historical reasons, remained socially and economically backward, and hence concerted efforts have been made under the Plan to raise their social and economic status, as required by the Directive Principles of Article 46 of the Constitution. Other disadvantaged groups needing special support are Other Backward Classes (OBCs), Minorities and other marginalized and vulnerable groups.
4.229 Unlike Scheduled Castes who are dispersed throughout the state, Scheduled Tribes have traditionally been concentrated in limited geographical areas, mainly forests, hills, undulating inaccessible areas. The fact that most of them live in isolated groups in relatively remote areas has made it more difficult to deliver essential services to them and has also made it much more difficult for them to benefit from the acceleration of overall growth than the Scheduled Castes.
4.230 Comparatively the Scheduled Castes in Kerala are leading a better social life than the Scheduled Castes in other parts of India. Deprivation is also much less here. This is due to the commendable achievements made by Kerala in the field of social, cultural, educational activities as well as in the areas of health and land reforms. .
4.231 Article (46) of the Constitution states that the State shall promote with special care for the educational and economic interest of the weaker section of the people and, in particular, of the Scheduled Castes and Scheduled Tribes and shall protect them from social injustice and all forms of exploitation.
4.232 Despite Constitutional directives and a number of legislative and executive measures taken by the Government since independence, there are large gaps between the living conditions of the general population and those of Scheduled Castes and Scheduled Tribes. Successive Five Year Plans have attempted to reduce these gaps. The persistence of socio-economic backwardness of Scheduled Castes and Scheduled Tribes, in spite of the development efforts warranted a special and focused strategy, interalia, to enable them to share the benefits of overall economic growth in a more equitable manner.
4.233 Other Backward Classes (OBC) is a collective term used by the Government of India to classify castes and communities who are socially and educationally disadvantaged. Kerala state has high concentration of OBC population. The Central and State Governments had undertaken many welfare schemes and programmes for the upliftment of OBC and as a result, the backwardness has been minimized to a great extent. In order to improve the economic and social status of OBC to the desired level, Government felt the need for more focused state spending and effective intervention and thus a separate department named Backward Communities Development Department (BCDD) was constituted in the year 2011 with the basic objective to formulate policies, laws, regulations and programmes for the welfare and alround development of OBC. The Directorate of Backward Communities Development Department has started functioning at Thiruvananthapuram on 21-11-2011. There are two regional offices functioning at Ernakulam and Kozhikode.
4.234 The Government of India has taken several steps for the overall development of minority communities in India. National Commission for Minorities (NCM) was set up by the Union Government of India in 1992 to protect the Minorities all over India. Government of India has notified six minority communities viz., Muslims, Christians, Sikhs, Buddhists, Zoroastrians (Parsis)and Jains. In spite of considerable efforts made towards raising the socio –economic status of Minorities, many challenges remain which need to be addressed. The Minority Welfare Department was constituted in 2011 for addressing the social, economic and educational backwardness of Minority Communities in the State. The Minority Welfare Department is the nodal agency for the schemes implemented by Ministry of Minority Affairs, Government of India and Department of Minority Welfare in the State.
Approach of 12th Five Year Plan for Weaker Sections
4.235 The Twelfth Plan strives hard to achieve the overall improvement in socio-economic conditions of the marginalised sections like SC, ST, OBC, minorities and other weaker sections by extending a well balanced prioritization of efforts made for social development and economic empowerment based on actual needs and problems of these communities. This calls for an inclusive growth process which provides opportunities for all to participate in this process combined with schemes that would either deliver benefits directly or more importantly help these groups to benefit from the opportunities thrown up by the general development process.
Population
4.236 According to 2011 Population Census, Scheduled Castes and Scheduled Tribes constitute 25.24 percent of the total population of India. Scheduled Castes constitutes 16.63 per cent and Scheduled Tribes 8.61 per cent of population. Decadal growth rate (2001-2011) of Scheduled Castes is 20.85 per cent and Scheduled Tribes 23.66 per cent. Highest proportion of Scheduled Caste with total is in Punjab, that is, 31.9 per cent of the total population. Lakshadweep has the highest proportion of Scheduled Tribe population, that is, 94.8 per cent.
4.237 The Scheduled Caste population of Kerala is 30,39,573 persons as per 2011 Population Census constituting 9.10 per cent of the total population of the State. There has been a decrease in the proportion of Scheduled Caste by 0.7 per cent point between 2001 and 2011. One of the reasons for the decline is that some communities in Scheduled Caste have been included in the Scheduled Tribe classification during the period. Sex ratio of Scheduled Caste population in Kerala is 1057.
4.238 The Scheduled Tribe population of Kerala is 484839 persons as per 2011 Population Census constituting 1.45 per cent of the total population of the State. There has been an increase of 0.63 per cent point as compared to 2001 population census. Sex ratio of Scheduled Tribe population in Kerala is 1035. A comparative picture regarding literacy and sex ratio of Scheduled Castes and Scheduled Tribes population in Kerala with national level is furnished in Appendix 4.91.
4.239 In Kerala there are 53 communities which belong to Scheduled Caste as per the Amendment Act of 2006 to the Constitution of India. The settlement pattern in Kerala is entirely different from that of other States and a major portion of the Schedule Caste population lives in scattered households and only a small proportion lives in concentrated colonies, in which a few are isolated. According to 2011 Population Census, the highest presence of Scheduled Caste population is in Palakkad District (13.29 per cent) followed by Thiruvananthapuram (12.27 per cent), Kollam (10 .80 per cent), Thrissur (10.67 per cent) and Malappuram (10.14 per cent). More than half of SC population (57.17 per cent) of the State is distributed in the above five districts. The Scheduled Tribes in Kerala are not only geographically concentrated, but are overwhelmingly rural. Highest concentration of Scheduled Tribes is seen in Wayanad district (31.24 per cent) followed by Idukki (11.51 per cent), Palakkad (10.10 per cent) and Kasaragod (10.08 per cent).These four districts together account for 62.93 per cent of Scheduled Tribes in the State. The coastal district of Alappuzha has the lowest percentage (1.36 per cent). District wise Scheduled Caste/Scheduled Tribe population details are given in Appendix 4.92 and 4.93. District wise SC/ST population with respect to district population is given in Figures 4.20 and 4.21 respectively.
Fig 4.20
Percentage of SC Population to total Population in
the Districts as per 2011 Population Census
Source: Census of India 2011
Fig 4.21
Percentage of ST Population to total Population in
the Districts as per 2011 Population Census
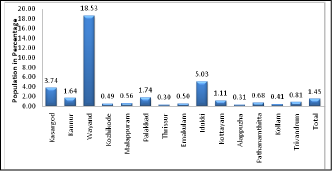
Source: Census of India 2011
4.240 As per Census of India 2011 (Appendix 4.94) Scheduled Caste households in Kerala have much greater access to banking services, landline phones, computers with internet and car than an average Scheduled Caste household in India. Compared to other southern states like Tamil Nadu, Karnataka, and Andhra Pradesh, only SC households in Tamil Nadu have greater access to televisions than those in Kerala. SC households in Kerala do not seem to have as much access to two wheelers as other SC households in India. While more than 22 per cent of SC households in India did not have access to any of these assets, Kerala performed better with only around 11 per cent of SC households being deprived of these assets.
4.241 Similarly in the case of Scheduled Tribes, households in Kerala have much greater access to banking services, television, computer with internet, land line and car than an average Scheduled Tribe household in India (Appendix 4.95). Compared to other southern states, only Scheduled Tribe households in Tamil Nadu have greater access to televisions, computer with internet, landline phones and car than Kerala. Scheduled Tribe households in Kerala do not seem to have as much access to two wheelers as other Scheduled Tribe households in India. While more than 37 per cent of Scheduled Tribe households in India did not have access to any of these assets, Kerala performed better with only around 24 per cent of Scheduled Tribe household being deprived of these assets.
4.242 Scheduled Caste and Scheduled Tribe households in Kerala have a better standard of living than their counterparts in the rest of the country in general. However, Tamil Nadu has shown an even better standard of living for Scheduled Tribe households than Kerala.
Occupational Pattern
4.243 Decadal growth rate of Kerala’s population as per Census 2011 was all time low of 4.9 per cent. The work participation rate shows an increasing trend during the decade (2001-11). The proportion of main workers is more than that of marginal workers in all cases. Especially the female main workers have considerably increased from 19.90 per cent in 2001 to 22.71 per cent in 2011 in the case of ST population. In respect of SCs same has increased from 18.51 per cent to 19.59 per cent during this period. The percentage of main workers engaged in household industry shows a decreasing trend. The category of main workers shows that 29.90 per cent of SCs and 59.49 per cent of STs are doing agricultural labour where as in the case of general population it is only 14.18 per cent. Details of occupational pattern is shown in Appendix 4.96.
4.244 In Kerala, as per Rule 14(a) of the Kerala State and Subordinate Service Rules 1958, 10% representation (8% for SCs/STs, 2% for STs only) is reserved to Scheduled Castes/Scheduled Tribes in Gazatted, Non-Gazatted and Last Grade Categories in Government Departments. The Scheduled Castes have already got a benefit of more than 8% reservation in all the three categories. But in the case of Scheduled Tribes candidates it can be said that they are nearing the required 2% reservation in State service on a faster pace than previous years. As per the Annual review in 50 out of 83 depatments as on 1.1.2014, the total representation of Scheduled Castes and Scheduled Tribes in public service is 13.84%. Details of representation of SC/ST employees in Government service is given in Appendix 4.97.
Development Programmes for Scheduled Caste and Scheduled Tribes
4.245 Kerala Government earmarks fund for SCP from State Plan outlay in proportion to the percentage population of Scheduled Caste and allocate fund for TSP more than that of ST population percentage. A two pronged strategy is followed for the development of SC/ST in the State. One is through the assistance provided through the LSGs and the other through SC/ST Development Department. Out of the total SCP/TSP Plan outlay, a certain percentage of funds are allocated to Local Self Government Institutions for implementation of schemes under Decentralized Planning and the remaining to the SC/ST Development Department. A portion of the fund was considered as Notional Flow to other departments till 2008-09. This was meant for implementing schemes exclusively for SC/ST population in the respective sectors. As this experiment was not found successful, the concept of Notional Flow was dispensed with from the Annual Plan 2009-10. A system of earmarking certain amount of SCP/TSP as pooled fund under SCP and TSP for taking up schemes adopting a project approach was introduced. This gives scope to get wide range of schemes with varied objectives and physical targets, which put together, will help the all round development of the targeted groups. The total plan provision set apart for the development of Scheduled Caste and Scheduled Tribes during 2015-16 is ₹.1968.50 crore and ₹.604.50 crore respectively. Year-wise details from 2011-12 onwards are given in Appendix 4.98 and in Figure 4.22.
Fig 4.22
SCP/TSP-Yearwise Outlay
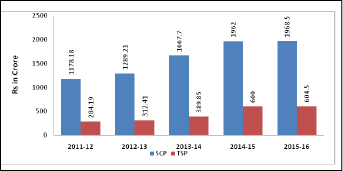
Source: Budget Documents
Programmes of Scheduled Caste Development Department
4.246 Centrally Sponsored Schemes and schemes/projects included in the state plan for the development of the Scheduled Caste population are implemented by the Scheduled Caste Development Department. During 2015-16 total State Plan provision set apart for the development of Scheduled Castes was ₹.1968.50 crore. Out of this, ₹.1040.92 crore was earmarked to Scheduled Caste Development Department and ₹.927.58 crore was provided as development fund to Local Bodies. Besides, ₹.273.59 crore as 100 per cent CSS and ₹.21.30 crore as 50 per cent CSS were also included under SCP during 2015-16. In addition to this, ₹.24 crore was included in the budget as Special Central Assistance to SCSP.
4.247 The programmes under SCP cover a wide area comprising education, economic and social welfare activities for the development of Scheduled Caste. Some of these programmes are given below. Scheme-wise outlay and expenditure of welfare of Scheduled Caste for 2014-15 & 2015-16 (as on 30-09-2015) and the physical targets and achievement are given in Appendix 4.99 & 4.100 respectively.
Box 4.16 Major Schemes of SC Development |
||
| Name of Schemes | Objectives | Achievements |
| Educational Schemes | Provide educational assistance to • Pre-matric studies • Post-matric studies • Running of Model Residential Schools • Students studying in self financing colleges. • Adhar linked bank account system. |
During 2014-15 post-matric concessions were given to 1.51 lakh students. An amount of ₹.46.10 crore has been spent towards stipend and lump sum grant and an amount of₹.144.47 crore has been spent for providing scholarship for post-matric students. Online distribution of educational assistance through e-Grantz and introduced SBIeZ-pay card (Appendix 4.101). |
| Housing Scheme | Financial assistance for • Construction of new houses for the houseless SC families • Online system of granting financial aid through e-housing
|
During 2014-15, 4000 houses were sanctioned and constructed 736 houses. 5000 houses were sanctioned during 2015-16 (as on 30.09.2015) and construction activities are progressing. (Appendix 4.102) |
| Land to Landless | • Purchase of land to the poor and eligible landless SC families for house construction |
During 2014-15 an amount of₹.100.00 crore was provided benefitting 3569 persons. An amount of ₹.150.00 crore is provided during 2015-16 (Appendix 4.103). |
| Health Scheme- Financial assistance to Seriously ill People | Illness assistance to • Serious diseases like Cancer, Heart/kidney/brain ailments to SC families below poverty line as per the recommendation of the doctor |
During 2014-15, financial assistance was given to 15327 persons and expenditure incurred was ₹.28.30 crore. |
| Development programmes for the vulnerable communities Among Scheduled Castes | • Rehabilitation of landless and homeless SCs belonging to vulnerable communities by providing assistance for purchase of five cents of land and assistance for house construction. •Providing infrastructure, connectivity, communication facilities, education, treatment, drinking water, electricity, road etc. |
An amount of ₹.14.96 crore was expended during 2014-15 benefitting 505 persons and ₹.14.00 crore has been provided during 2015-16 and the expenditure incurred as on 30.09.2015 is ₹.2.03 lakh. |
| Employment scheme | Financial assistance for • promoting new ventures among Scheduled Caste in the ratio 1: 2 as subsidy and loan
|
During 2014-15, ₹.3.61 crore was expended benefiting 560 persons. During 2015-16 ₹.1.36 crore is provided and expenditure incurred as on 30.09.2015 is ₹.0.63 crore. Financial Assistance provided to brilliant SC/ST students those seeking admission to national and international institutions .Students got assistance for courses like M.Sc Nursing and MBA during 2014-15. |
| Assistance for marriage of SC girls | Financial assistance to • Daughters of SC parents to reduce the burden of marriage expenses
|
During 2014-15 an amount of ₹.34.99 crore was expended benefitting 7077 persons. An amount of ₹.30.00 crore has been provided during 2015-16 and expenditure incurred as on 30.09.2015 is ₹.21.81 crore |
Protection of Civil Rights and Enforcement of Prevention of Atrocities Act
4.248 According to the National Crime Records Bureau, during 2014-15, 351 cases were registered and an amount of ₹.150.29 lakh has been disbursed as compensation. During the year 2015-16, 105 cases were reported and an amount of ₹.54.79 lakh was disbursed as compensation to the victims as on 30.09.15. Details are given in Appendix 4.105.
Box 4.17
New Initiatives in SC Development Department during 2014-15
1. One third of the Corpus fund was allocated to Districts
2. Primary Education Aid.
3. Assistance to Rural Development Department
4. Self Help Groups
5. Construction of flats as part of Housing Scheme
6. Cyber Sri
7. Protection of Crematorium
8. Meritorious Scholarship for studying abroad
Critical Gap Filling (Corpus Fund)
4.249 This Scheme intends to provide funds for filling critical gap in the SCP provision made under various schemes on project basis with emphasis on human resource development, basic needs, economic development etc. From 2014-15 onwards one third of the outlay will be allocated to districts on population proportion basis. Schemes /projects up to ₹.25 lakh will be cleared by the District Level Committee for SC/ST. Project above ₹.25 lakh will be cleared by State Level Working Groups/ Special working Groups. Outlay and expenditure under the scheme from 2011-12 to 2015-16 (as on 30.09.2015) is given in Appendix 4.106 and Figure 4.23 and the details of schemes taken during 2014-15 are given in Appendix 4.107 .
Fig 4.23
Corpus Fund (2011-12 to 2015-16)
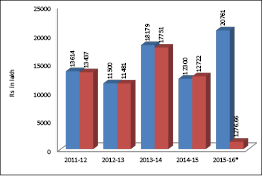
Source: SC Development Department
* Up to 30.09.2015
Pooled Fund
4.250 A system of earmarking certain amount of SCP/TSP as pooled fund under SCP and TSP for taking up schemes adopting a project approach was introduced. This gives scope to integrate a wide range of schemes with varied objectives and physical targets for all round development of the targeted groups.
4.251 Various development departments and agencies submit projects to State Planning Board for consideration. After vetting by State Planning Board, it is forwarded to Scheduled Caste Development Department for placing before State Level/ Special Working Group for consideration. Outlay and Expenditure under the scheme from 2011-12 to 2015-16 (as on 30.09.2015) are given Appendix 4.108 and the details of schemes taken during 2014-15 are given in Appendix 4.109.
Special Central Assistance to Special Component Plan (SCA to SCP)
4.252 The Special Central Assistance to Special Component Plan is provided by Government of India to States for undertaking mainly economic development programmes for Scheduled Castes. It is not on a schematic pattern. It help to fill the gaps which is not met from the Central, State and Local body plans. Out of the total funds received under SCA to SCP, 75 per cent of the fund are distributed to the District Collectors on the basis of Scheduled Caste population in the districts. The balance 25 per cent is kept with the Director, Scheduled Caste Development Department. Activities that can be taken up under SCA are to assist Scheduled Caste families for taking up viable income generating activities, through a mix of institutional finance and subsidy. The families may be provided assistance under SCA in a manner similar to those admissible under NRLM( National Rural Livelihood Mission). The Outlay and Expenditure details of SCA to SCP from 2011-12 to 2015-16 (as on 30.09.2015) are given in Appendix 4.110.
Programmes of Scheduled Tribes Development Department
4.253 Tribal Sub Plan was introduced for the welfare of Scheduled Tribe population from the Fifth Five Year Plan (1974-75) onwards. The objective of the Tribal Sub Plan was to give a special care to Scheduled Tribes through a Sub Plan approach. After 1974-75, this strategy has undergone changes and now has been integrated with the local self government machinery.
4.254 Due to the typical settlement pattern, cultural practices and traditional identities the Scheduled Tribe population are scattered in clusters and are concentrated in interior forest and adjoining areas. By considering this the strategy of TSP was to protect tribal people and there by attaining tribal development. As per the TSP strategy, the State allocates an amount which is more than proportional to the tribal population (1.45%) in the State as TSP provision in the budget is for the exclusive development of Scheduled Tribes in the State. During 2014-15, 3 per cent of the state plan outlay was provided under TSP. For the year 2015-16 the percentage allocation to TSP is 3.02 per cent.
4.255 The major sources of funds for tribal developments are from (i) State Plans,(ii) Funds under TSP components of Centrally Sponsored Schemes (CSS) administered by Central Ministries/Departments, (iii) Special Central Assistance to Tribal Sub Plan (SCA to TSP), Grant under Article 275 (1) of the Constitution and other schemes implemented by Ministry of Tribal Affairs and (iv) Institutional Finance.
4.256 The expenditure of the Scheduled Tribes Development Department during 2014-15 was ₹.387.10 crore. The total State plan provision set apart for the development of Scheduled Tribes during 2015-16 was ₹.604.50 crore. Out of this, an amount of ₹.315.28 crore was earmarked to the ST Development Department and an amount of ₹.139.22 crore was provided as grant-in-aid to local bodies and an amount of ₹.150 crore earmarked as Additional Tribal Sub Plan (ATSP) fund/ Special Package. For the 50 per cent and 100 per cent CSS Schemes Central Share allocation was₹.20.01 crore and ₹.65.85 crore respectively. In addition to this, ₹.10.00 crore included as Special Central Assistance to TSP. Details of financial achievements are given in Appendix 4.111 and Physical achievements of schemes implemented by the Department during 2014-15 and 2015-16 (as on 30.09.2015) are given in Appendix 4.112.
4.257 The major schemes implemented by Scheduled Tribes Development Department can be broadly classified as Educational programmes, Housing, Health, socio economic upliftment and legal protection scheme. Main objectives and achievements of major schemes during 2014-15 and 2015-16 (up to 30.09.2015) are given below.
Box 4.18 Major Schemes of ST Development |
||
| Name of Schemes | Objectives | Achievements |
Educational Programmes
|
Provide educational assistance to • Pre-matric studies • Post-matric studies • Running of Model Residential Schools • Students studying in self financing colleges
|
During 2014-15, an amount of ₹.128.77 crore has been expended benefitting 102588 students and in 2015-16 (up to 30.09.2015) an amount of ₹.19.08 crore has been expended as educational assistance benefiting 89454 students. (Figure 4.24, Appendix 4.113, 4.114 and4.115).
|
| Housing Scheme | Financial assistance for • Construction of new houses for houseless ST families
|
During 2014-15, an amount of ₹.33 crore was provided for housing by Scheduled Tribes Development Department for sanctioning 2907 new houses and ₹.6 crore as 25 % State share of IAY. During 2015-16, under general housing (as on 30.09.2015) department has been given attention for spill over works and under ATSP the department has given sanction for 10000houses (as on 30.09.2015). The rate of assistance has been raised from ₹.2.50 lakh to₹.3.50 lakh (Figure 4.25, Appendix 4.116 and4.117). |
| Health Scheme | Illness assistance to • Serious diseases such as TB, Leprosy, Scabies, Sickle Cell Anaemia, Waterborne diseases, etc.
|
During 2014-15, an amount of ₹.11.20 crore was provided under the plan and the expenditure incurred was 10.75 crore. During 2015-16 an amount of ₹.17.75 crore was provided to health schemes and ₹.5.60 crore has been expended as on 30.09.2015 |
| Assistance for marriage of ST girls | Financial assistance to • Daughters of ST parents to reduce the burden of marriage expenses
|
During 2014-15, the department had given assistance to 302 ST parents. In 2014-15, the scheme was renamed as “Assistance for the welfare of STs” by including the schemes viz., Assistance to Marriage of ST girls, Assistance to Sickle-cell Animeia patients, Janani Janma Raksha & Financial Assisatance to Traditional Tribal Healers and an amount of ₹.9.50 crore was provided. |
| Resettlement of Landless Tribes | • To provide at least one acre of land per family to landless ST people subject to ceiling of 5 acres based on a master plan. • Resettlement will be done on project basis with emphasis on planning and implementation through Oorukottoms.
|
So far 7033 families have been distributed 9161.49 acres of land. Total extent of 165.789 acres of land have been purchased for 469 landless families. District-wise details of land distribution are shown in Appendix 4.119. |
Source: STDD
Fig 4.24
Expenditure by Scheduled Tribes Development Department for Education (Plan)
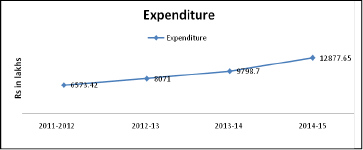
* Upto 30.09.2015
Source: ST Development Department
Fig 4.25
Housing Programmes undertaken by ST Development Department
* Upto 30.09.2015
Source: ST Development Department
Corpus Fund
4.258 An amount of ₹.5000 lakh was provided during 2014-15 for undertaking various development activities under the scheme and the amount expended during the period was ₹.4744 lakh. The components of the Corpus fund includes self employment, skill development, water supply & sanitation, communication facilities, foot bridges, technology transfer, improvement of education, health etc. Statement showing the outlay and expenditure under Corpus fund from 2011-12 to 2015-16 (up to 30.09.2015) is given in Appendix 4.120 and in Figure 4.26 and district wise details during 2014-15 are given in Appendix 4.121.
Fig 4.26
Outlay and Expenditure under Corpus Fund
* Upto 30.09.2015
Source: ST Development Department
Pooled Fund for Special Projects Proposed by Other Departments under TSP
4.259 During 2014-15, an amount of ₹.1300 lakh was provided under the scheme Pooled Fund for special projects proposed by other departments. Out of this an amount of ₹.1288.04 lakh was allocated for different projects and expended the whole amount. The expenditure during the period is ₹.1288.04 lakh. An amount of ₹.1000 lakh is earmarked during 2015-16 and the expenditure incurred as on 30.09.2015 is ₹.576.76 lakh. The details of schemes under Pooled fund taken during 2014-15 are given in Appendix 4.122
Special Central Assistance to Tribal Sub Plan (SCA to TSP)
4.260 The Special Central Assistance to Tribal Sub Plan released by Government of India as an addition to State Plan Funds is meant for undertaking employment cum income generation activities and the infrastructure incidental to activities based on family and Self Help Groups. 70 per cent of the fund has been utilized for implementing primary schemes supporting family/SHG/Community based income generation activities and 30 per cent used for critical infrastructure in the sectors of drinking water, watershed management etc. Under the scheme 30 per cent beneficiaries are women. The outlay and expenditure under SCA to TSP during 2010-11 to 2015-16 (up to 30.09.2015) is shown in Appendix 4.123 and in Figure 4.27.
Fig 4.27
Outlay and Expenditure under SCA to TSP during 2011-12 to 2015-16
* Upto 30.09.2015
Source: ST Development Department
Kerala Institute for Research Training and Development Studies for SC/ST
4.261 The Institute conducts research and intensive study on Scheduled Caste and Scheduled Tribe population of the State.
4.262 Anthropological investigation on doubtful community cases as requested by Scheduled Tribes Development Department, Scheduled Caste Development Department, Revenue Divisional Officers, Tahsildars and District Collectors has also been undertaken by the wing. Details are given in Appendix 4.124.
4.263 The training wing of KIRTADS co-ordinates and conducts a large number of programmes to promote Tribal Development. This wing also conducts many orientation programmes, capacity building programmes, empowerment programmes and educational programmes. The institute also undertakes Adikalagramam programme which include traditional dance and music of the SC and ST communities of the State. The scheme wise outlay and expenditure and the physical achievement of the schemes are given in Appendix 4.125 & 4.126.
4.264 An amount of ₹.70 lakh was provided as 50 per cent State share as Grant in aid to Research, Training and Development Studies during 2015-16 and expenditure incurred up to 30.09.2015 was ₹.41.9 lakh. For Adikala Gramam an amount of ₹.35 lakh was provided and the expenditure incurred up to 30.06.2015 was ₹.4.50 lakh.
Box 4.19
Additional Tribal Sub Plan (ATSP) Fund/Special Package
ATSP Fund is a special package in addition to the normal share of TSP to be utilised for the socio-economic betterment of tribal population living in the tribal settlements in the State. During 2014-15 an amount of ₹.150 crore was set apart as ATSP Fund/Special Package as a new initiative for the Integrated Sustainable Development of Scheduled Tribe Population in the Identified Settlements. Based on the approved DPR of 14 identified settlements an amount of ₹.135.75 crore (90.50%) was expended. This scheme was continued in 2015-16 also and an amount of ₹.150 crore was earmarked as ATSP Fund by giving more emphasis on infrastructure facilities, economic activities, employment generation, health, education, housing, etc. and expenditure as on 31.10.2015 (as per plan space) was ₹.9.18 crore (6.12%).
Source: SPB
Kerala State Development Corporation for Scheduled Caste and Scheduled Tribes
4.265 The Corporation, with its registered office at Thrissur, functions through 14 Regional Offices covering all the districts, is implementing various schemes for the multifaceted development of Scheduled Castes & Scheduled Tribes in the State through its intervention in different spheres of economic activity. The sources of finance for implementing various schemes are Corporation’s own share capital and assistance from other national refinancing agencies like NSFDC, NSTFDC, NSKFDC and HUDCO. The Corporation is now concentrating more on self employment schemes to enable the target people to engage in some innovative and viable income generating activities and earn their livelihood and thereby improve their socio-economic status in the society. The major schemes implemented by the Corporation include agricultural land purchase, micro-credit finance, mini-venture loans, small enterprise loans, housing, educational loan, marriage assistance etc.
4.266 The scheme-wise details of physical and financial achievements of the Corporation are given in Appendix 4.127.
Welfare of Other Backward Classes
4.267 ackward Communities Development Department started functioning as a separate department in November 2011 to look after the welfare of socially and economically backward communities of the society. Though the Directorate of this Department was created at the end of the financial year 2011-12, it implemented two major educational schemes, Pre-Matric and Post-Matric Scholarships with the help of Scheduled Caste Development Department.
4.268 OBC prematric scholarship scheme with 50% CSS is the main achievement of the Department in its 1st year. The Department has implemented various educational schemes such as Pre-Matric and Post-Matric Scholarship for OBC and OEC students. During the period, the department started a handful of schemes such as employability enhancement programme, overseas scholarship scheme, career in automobile industry, construction of hostels and assistance to traditional occupations. A total amount of ₹.90 crores was earmarked by the State government for the sector during 2015-16, of this ₹.36.10 crores is State share for CSS. An amounts of ₹.50.90 crore is anticipated as 100 per cent CSS during 2015-16. The expenditure incurred as on 30.09.2015 is ₹.43.09 crore. The Scheme wise outlay and expenditure and the physical achievements of the department during 2014-15 and 2015-16 (upto 30.09.2015) are given in Appendix 4.128 & Appendix 4.129
Kerala State Backward Classes Development Corporation
4.269 The Corporation aims at the socio-economic upliftment of the backward classes and minorities in the State .The mission of this Corporation is “Freedom from poverty and backwardness” of the targeted communities in the State. Acting as a major State level Channelising Agency (SCA) of National Financing agencies, viz., National Backward Classes Finance & Development Corporation (NBCFDC) and National Minorities Development & Finance Corporation (NMDFC), KSBCDC implements their schemes by providing loan assistance at lower rate of interest to the members of backward and minority communities living below the poverty line for their overall development. KSBCDC also implements various welfare schemes by utilizing State government assistance and its own fund reserves. The Corporation has disbursed loans worth ₹.1891.20 crore to 366036 beneficiaries as on 30/09/2015. 79% of the beneficiaries are from rural areas & 48% of the beneficiaries are women. The source-wise expenditure and the physical achievements of the Corporation during 2014-15 and 2015-16 (up to 30.9.2015) are given in the Appendix 4.130.
Kerala State Development Corporation for Christian Converts from Scheduled Caste and the recommended Communities
4.270 The main objective of this Corporation is to promote social, educational, cultural and economic upliftment and other living conditions of the converted Christians from Scheduled Castes and other recommended communities. The main schemes implemented by the Corporation are agricultural land purchase, foreign employment, housing, cash incentive to students, marriage loan, agriculture and allied sector assistance, small business, educational loan etc. The source of finance of the Corporation is the financial assistance received from State government and the loan assistance from NBCFDC. Details of year wise disbursement of State Government assisted loan schemes from 2011-12 to 2015-16 (as on 30.09.2015) are given in Appendix 4.131.
4.271 The scheme-wise details of physical and financial achievements of the Corporation are given in Appendix 4.132.
Welfare of Minorities
4.272 The Minority Welfare Department was constituted for addressing the social economic and educational backwardness of Minority Communities in the State. An amount of ₹.60 crore was earmarked to Minority Welfare Department during the year 2015-16 for various programmes. The major schemes are Multi Sectoral Development Programme (MSDP) (25 % state share), Housing scheme for divorcees/widows/abandoned women from the Minority Communities, Drinking water supply scheme in Minority concentrated areas etc Expenditure incurred as on 30.09.2015 is ₹. 26.78 crore. The Scheme wise outlay and expenditure and the physical achievements of the Department during 2014-15 and 2015-16 (upto 30.09.2015) are given in Appendix 4.133 & 4.134.
Kerala State Minority Development Finance Corporation
4.273 The State Government constituted the State Minority Development Finance Corporation to provide financial assistance to income generating projects, housing finance, educational loans, vocational training etc to minority communities. An amount of ₹.10 crore has been provided as share capital contribution to the Corporation during 2015-16. The financial and physical achievement of the corporation is given in Appendix 4.135.
Section 7
Art and Culture
4.274 The small state of Kerala is known for diverse art forms. There are many institutions set up for the promotion and encouragement of various art forms of Kerala. Academies, publishing houses, cultural centres, institutions of fine arts and folk arts, research centres and directorates like Museums and Zoos, Archives, Archaeology etc. are some of these institutions (see Economic Review 2014). The outlay for Art and Culture sector increased by 9% during 2015-16 compared to the previous year. Two new schemes- preservation and digitalisation of old malayalam film negatives and medical cum accident insurance scheme for artists- were included in the Annual Plan 2015-16. Often the artists do not get the recognition and reward due to them and both the artists and the art forms suffer .In this regard, a notable step has been taken by the Sangeetha Nataka Academy to revive popular art forms .The three initiatives taken by the Academy are described below.
1. Weekly drama:
Sangeetha Nataka Academy is organizing weekly drama festivals for the promotion and development of popular theatre movement, professional drama and amateur theatre movement. This initiative aims at co-ordinating the activities of the art and cultural institutions including amateur arts associations and providing proper guidance to their activities. Professional, amateur and short dramas performed in the Sangeetha Nataka Academy drama competition are included in the weekly drama festivals. Each drama is performed in all nine centres such as Museum Hall at Thiruvananthapuram, Fine Arts Hall at Ernakulam, KPAC at Kayamkulam,Aluva ,University Campus Malappuram etc. An amount of Rs. 2 lakh is provided as reward for each troupe. An amount of ₹. 1.10 Crore has been spent for weekly drama festivals at 30 centres.
2. Revival of Dying art forms of Kerala:
Kerala Sangeetha Nataka Academy has organized monthly programmes for the promotion and propagation of Kathaprasangam,Magic,Folksong and Mohiniyattom.This scheme is intended for providing better opportunities for the new generation artists . Folk festival is organised in centres like Kalagramam at Karakulam ,Hindusthan Latex at Thiruvananthapuram ,Ahalya and Swaralaya at Palakkad,DTPC Piravam and Keli at Koothattukulam.Mohinityattom is organized in the centres of dance and music school at Kozhikode,Sreekrishna Sangeetha Sabha at Mavelikkara,Sangeetha Sabha at Chalakkudi,Chilanka Dance Music Academy,Gouri Creations at Palakkad,Sivaranjini Sageetha Sabha at Nilambur and Sadguru Sangeetha Sabha at Kozhikode. Artists of this programme are selected under the direction of expert teachers in this field. These competitions are organized in 56 selected centres in Thiruvananthapuram to Kasaragod. In the past,Kathaprasangam was one of the art forms that dominated the cultural milieu in the State .For the promotion and propagation of this artform, Kathaprasangam festival has been organized in Thiruvanathapuram,Kollam,Ernakulam,
Thrissur and Kannur. Academy has also organized a unique programme by selecting notable stories of former Kathaprasangam artists in the month of July.
The Academy has organised Mohiniyattam monthly festival (Mohini Nrityathi) in Chennai, Bengaluru, Mumbai, Dombivilli, Ahmedabad, Surat,Vadodara, Kolkata and Thrissur for the propagation of the Kerala’s own classical dance form .
3. Insurance
Kerala Sangeetha Nataka Academy has started an insurance mediclaim plan during 2011 aiming at helping ailing artists practising various art forms. Total 924 artists in the fields of professional drama (642),instrument art forms (196), Kathaprasangam (52) and Magic (34) are included in this scheme. Duration of this scheme is 3 years and is implemented with the help of cine artists like Sri. Mohanlal, Sri.Mammootty and industrialist Sri.B.R.Shetty.
For the continuance of the scheme Government has allotted an amount of ₹.40 lakh towards the corpus fund. Balance amount will be met by the Academy through sponsorship. 146 Circus artists are also included under this scheme during current year.
As per this scheme, ₹.1 lakh is provided for mediclaim, accidental death, disability etc and ₹.1000 is provided per week (up to maximum 100 week) in such situations of temporary disability due to accident requiring bed rest .
Outlook
Sustaining the high levels of development achieved in the social sector is a challenge for the economy. Though the State has made huge advancement in the field of education and health, vulnerabilities and challenges exist in consolidating the gains made in the field of social sector. The education sector is facing service constraint in terms of quality of education. There is a shortage of skilled manpower. Similarly access to health care is one of the best in the State. But high levels of malnourishment among women and children, re-emergence of communicable and new diseases and lifestyle diseases needs to be tackled.
In terms of empowerment of women, the State needs to focus on gender sensitisation and foster social and economic empowerment. Incidence of crime against women, alarming female health issues and low economic participation are serious causes of concern. The State needs to proactively take steps in enhancing the status of women in the society and foster women empowerment in true spirit.
Although the growth process in the State has been more inclusive than other States in India, development efforts have not fully percolated to all sections of the society. There is a need for sustained efforts to bring in the Scheduled Caste and Scheduled Tribe to the mainstream by providing better infrastructure and opportunities. Focused intervention by extending the reach of social security network to these groups is necessary.
The vision for the State is to improve the quality of life of the people to the level of Nordic countries by 2030. Sustained efforts are therefore required to maintain the developments in the social sector as well as focus on improving the quality and bring in the marginalised sections into the fold of development process. To achieve the expected outcomes of various social security programmes, greater inter-sectoral convergence, stronger interdepartmental coordination and community participation are essential. For efficient delivery of services and benefits, effective monitoring of the programme is very essential. For this special emphasis has to be given for monitoring and evaluation of the programmes being implemented through various agencies.