Chapter 8
LOCAL GOVERNMENTS AND
DECENTRALISED PLANNING
Introduction
Decentralisation has been institutionalised in Kerala in the last two decades. It has been a long process of decentralisation in administration, innovative methods of implementation with a clear vision and purpose. Many milestones have been crossed in the process. Devolution of approximately one fourth the plan funds with clear formulae is the most important among them. But dual control over the functionaries and lack of role clarity for the different tiers remain a major weakness. Despite the weakness Panchayati Raj Institutions have built millions of kilometres of rural roads and provided drinking water, housing etc for the poor and marginalised.
Major thrust in different plan periods
Decentralization initiated following the 73rd and 74th amendments to the Indian Constitution has given greater responsibility and powers to the local governments for local planning, effective implementation and monitoring of various social and economic development programmes. In Kerala, the process of decentralization was launched as ‘People’s Plan Campaign’ with a view to emphasize the concept of participatory planning that was new to the people, people’s representatives and officials in local governments. But conscientisation was found quite essential. Under the 10thPlan, decentralization programme in Kerala was restructured and named ‘Kerala Development Plan’ (KDP) after analysing the experience of Peoples Plan Campaign. A number of innovative steps were taken under KDP to strengthen and institutionalize decentralization in the State. During the 11th Plan, Government revamped the entire process, giving stress to the concept of ‘People’s Planning’ focusing on the completion of the process of institutionalization of decentralization. In order to make the system more efficient and effective the 12th plan approach envisaged some concrete steps to strengthen the institutions as well as the planning process. Kerala has become a role model not only in participatory planning at the local level but also in devolving functions, finance and powers to Local Governments.
Plan Allocation to Local Governments
8.2 Financial devolution is the most important element of Kerala’s decentralization process, which has enabled the Local Governmets to receive resources from the State’s Plan allocation as Development Fund for implementing own schemes as well as transferred schemes. The fund provided from the state plan to Local Governmets is in the form of untied plan grant for planning and implementing projects for local development. Local Governmets have the freedom in formulating and implementing projects after deciding their priority subject to an overall framework.
8.3 At present, there are 1200 local governments in Kerala, 941 Grama Panchayats, 152 Block Panchayats, 14 District Panchayats, 87 Municipalities and 6 Corporations. The allocation of development fund to LGs is being done under three categories - General Sector, Special Component Plan (SCP) and Tribal Sub Plan (TSP). The outlay for each category was fixed on the basis of the recommendations of the IVth State Finance Commission (SFC). The Commission recommended that at least 25% of the likely plan size should be devolved to LGs for development purpose. The fund would be inclusive of the devolution from the 13th Finance Commission and the amount flowing to LGs from the proposed World Bank supported project namely, ‘Kerala Local Government Service Delivery Project’. Even while the yearly step-up is strongly recommended, it would be subject to the free plan outlay available each year. However, under no circumstance should any year’s allocation be less than 25% of plan size assumed by the Commission for that year. The recommended allocation to Local Self Governmets by the IVth State Finance Commission and actual allocation done so far is given in Table 8.1
Table 8.1
Award of Development Fund for LGs (2011-16)
(Rs. in crore)
Year |
Amount proposed by SFC |
Actual allocation |
Percentage to Total Plan Outlay* |
2011-12 |
2750.00 |
2750.00 |
25 |
2012-13 |
3388.00 |
3228.00 |
23 |
2013-14 |
3933.00 |
4000.00 |
24 |
2014-15 |
4559.00 |
4700 .00 |
24 |
2015-16 |
5193.00 |
4800 .00 |
24 |
*Inclusive of KSEB’s contribution
Source: 4th State Finance Commission Report & Appendix IV of the Budget
Special Component Plan and Tribal Sub Plan under Decentralization
8.4 The Special Component Plan and Tribal Sub Plan are based on Article 46 of Constitution of India for providing special protective measures to safeguard the interest of Scheduled Caste(SCs) and Scheduled Tribe(STs).This constitutional mandate on the State requires it ‘to create a regime of equality including social equality through comprehensive measures of social justice.’ Social equality means ensuring equity between Scheduled Castes, Scheduled Tribes and other marginalized sections on the one hand, and socially advanced castes on the other, in all parameters of life- economic, occupational, educational, residential facilities, health, nutrition etc.’ As one of the major objectives of decentralized planning is to improve the socio-economic status of Scheduled Castes and Scheduled Tribes and enhancing their quality of life conscious efforts have to be made at all levels of government for the effective implementation of SCP/TSP.
8.5 The allocation of Plan funds to SCP and TSP from State Plan outlay is done according to the ratio of population of SCs and STs to total population of the State. Out of the total SCP/TSP Plan outlay, a certain percentage of funds are earmarked to LGs for implementation of schemes under decentralized planning. The projects under the SCP/TSP can be categorized into two viz, the beneficiary oriented schemes and infrastructural development schemes. The outlay and expenditure for each category is shown in Table 8.2.
Table: 8.2
SCP & TSP Allocation& Expenditure of the LGs (2010-11 to 2014-15)
(Rs. in Crore)
Year |
SCP |
TSP |
Total |
|||
Allocation |
Expenditure* |
Allocation |
Expenditure* |
Allocation |
Expenditure* |
|
2010-11 |
589.49 |
484.03 |
88.47 |
78.28 |
677.96 |
562.31 |
2011-12 |
660.23 |
697.69 |
99.09 |
93.07 |
759.32 |
790.76 |
2012-13 |
739.46 |
661.58 |
110.98 |
99.65 |
850.44 |
761.23 |
2013-14 |
828.2 |
882.49 |
124.3 |
136.89 |
952.5 |
1019.38 |
2014-15 |
927.58 |
811.56 |
139.21 |
121.61 |
1066.80 |
933.17 |
*includes opening balance
Source: Appendix IV of the Budget & Information Kerala Mission,2015
Unique features of LGs plan during the 12th Five Year Plan
8.6 During the beginning of twelfth plan period some conscious efforts have been made to give more flexibility and freedom to the local governments for plan formulation. Accordingly, some changes have been made in the plan guidelines, mainly in sectoral ceilings and project appraisal. Now there is no mandatory minimum or maximum ceiling in productive or service sector. However, in infrastructure sector the mandatory ceiling fixed is not more than 45 per cent to Grama Panchayats and Block Panchayats, 55 per cent to Municipalities and Corporations and 50 per cent to District Panchayats in general sector plan outlay. In addition to this, 10 per cent of the development fund must be earmarked for women component plan and 5 per cent to children, old age, differently abled, palliative care and other vulnerable groups. The Annual Plan Document of local governments only needs to be approved by the District Planning Committees (DPCs) instead of approving individual projects.
8.7 Technical Advisory Groups (TAG) which are seen to be points of delay in clearances of projects were dispensed with. Instead of vetting the projects by the TAG concerned, it is verified and certified by the implementing officer and then furnished to the officer of the same department at the higher level for getting it appraised and approved. A Project Formulation Committee (PFC) can be constituted, if required, for providing technical expertise to prepare and approve the projects.
8.8 It is also important to note that now under SCP/TSP the construction of roads is allowed within SC/ST habitat. Width of the road in tribal colonies has been enhanced to a maximum of 3 metres. Introduction of financial support for SCs/STs in getting employment abroad, assistance to meritorious students seeking admission in national and international institutions are some of the landmarks in the utilization of SCP/TSP funds. Introduction of online approval of projects through Sulekha software is considered as a major shift from the traditional approach adopted by the TAG system. The application of Sulekha software includes plan formulation, appraisal, approval, monitoring, revision processes and expenditure tracking of the plan projects of local governments.
8.9 Another important change is the introduction of special grama sabhas, ayal sabhas and seva grams- gramakendrams. In order to strengthen grama/ward sabha ayal sabhas are constituted in each ward with 50- 100 families. Special grama sabha are convened for the families of differently abled and mentally challenged persons. Ayal Sabhas and Seva Gram-Gramakendram thus aims at getting people’s participation in planning and implementation.
Financing of LGs plans
8.10 The total plan size of LGs during 2014-15 was Rs.11917.30 crore of which the plan grant from Govt. constituted 49.63%. The own contribution of LGs constituted 7.45% of the total and the rest was from other sources. The expenditure recorded in 2014-15 was 51.49%, which showed a decrease by 5.52 per cent compared to last year’s expenditure of 57.01%. Out of the total expenditure, the plan grant share is 65.75%, own fund share 5.32%, sponsored schemes together with externally aided source 2.62% and the balance is from other sources. Even though there was 16.95 % hike in the plan grant allocated to LGs in 2014-15, proportionate increase was not reflected in the plan grant utilization, which is the major resource of LGs plans.
8.11 Source wise funding details and the respective percentage to total fund for 2013-14 and 2014-15 are given in Figure 8.1, and the percentage of expenditure from various sources for the year 2014-15 is provided in Figure 8.2. Source/Sub-sector wise details of 2013-14 and 2014-15 are given in Appendix 8.1 (a & b).
Fig 8.1
Sources of Financing LGs Plan (in percentage)
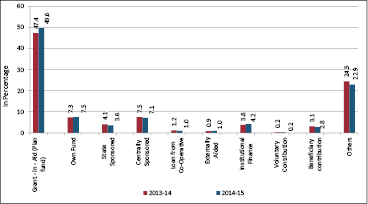
Source: Information Kerala Mission, 2015
Fig 8.2
Expenditure of different sources of funds in 2014 -15 (in percentage)
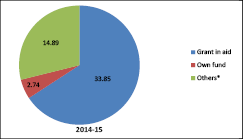
*Others include state sponsored, centrally sponsored, loan from co-operative, externally aided, voluntary contribution, beneficiary contribution and others (items excluding grant in aid and own fund).
Performance of Local Governments
8.12 The local governments allocate their plan funds mainly to productive, service and infrastructure sectors. The productive sector includes agriculture and allied sectors, soil and water conservation, irrigation and industries. The service sector consists of education and allied sectors, health and allied services, women and children development, labour and labour welfare. The infrastructure sector includes energy, transportation and buildings. The total plan fund available including opening balance with LGs for allocating funds to various development sectors during 2014-15 wasRs.5914.80 crore, an increase of 857.20 crores(ie. 16.95%) from the previous year.
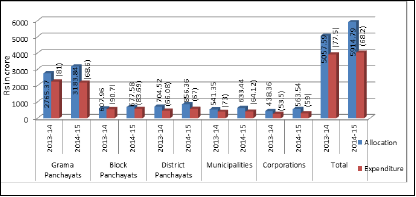
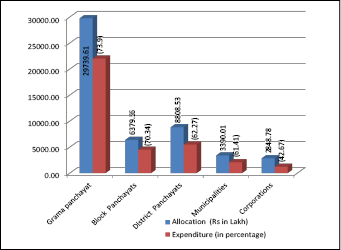
8.13 Out of the total grant-in-aid, only Rs.4033.94 crore was utilized for different sectors. Thus, the overall utilization percentage in 2014-15 was 68.20 per cent which was lower compared to the previous year. In 2013-14, the utilization percentage was 77.47 per cent and in 2012-13 it was 70.84 per cent. The expenditure pattern shows wide variations among local bodies. Among the three tiers the performance of rural local governments was better in Block Panchayat with 83.69 per cent expenditure followed by Grama Panchayats with 68.63 per cent and District Panchayat with 67.04 per cent during 2014-15. The per cent of expenditure among urban two tier local governments was the lowest in the Corporation (53.51 per cent) and Municipalities (64.12 per cent) during 2014-15. The tier wise details of outlay, allocation and expenditure of grant-in-aid during 2013-14 and 2014-15 are given in Figure 8.3 and Appendix 8.2a & Appendix 8.2b.
Fig 8.3
Grant-in-aid to LGs, Allocation and Expenditure
Category - wise performance
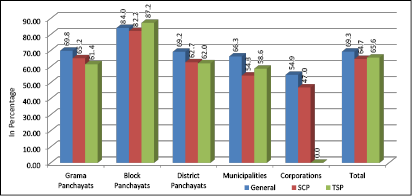
8.14 As mentioned earlier, the allocation of grant-in-aid to Local Governments falls in three categories-General Sector, Special Component Plan and Tribal Sub Plan.The outlay for each category is fixed on the basis of recommendations of the State Finance Commission. During 2014-15, an amount of Rs..5914.80 crore was allocated to different categories of which general category, SCP & TSP constituted 76 %, 21%, and 3 % respectively. There is a slight enhancement by 4% in general sector but allocation in SCP &TSP fund decreased by 3% and 1% respectively compared to 2013-14. An analysis of category wise utilization during 2014-15 shows that the percentage of expenditure under General Sector was 69.28 per cent of the plan outlay and in the case of SCP and TSP it was 64.72% and 65.58 per cent respectively. In the previous year achievment was 79.09 per cent in the general sector, and 73 and 75 per cent respectively in the case of SCP and TSP. Shortfall in expenditure of SCP/TSP is a common phenomenon for all tiers of Local Governments except for Block Panchayats, but the least utilisation of SCP and TSP funds is in urban local bodies. The category wise and local body wise allocation during 2014-15 is given in Table 8.3 and in Figure 8.4.
Table 8.3
Category wise Allocation of Grant-in-aid to LGs during 2014-15 (Rs.in Crore)
Type of LGs |
General |
SCP |
TSP |
Total |
Grama Panchayats |
2443.04 |
628.13 |
112.66 |
3183.84 |
Block Panchayats |
472.33 |
175.80 |
29.46 |
677.59 |
District Panchayats |
575.05 |
240.99 |
40.33 |
856.37 |
Municipalities |
517.88 |
112.60 |
2.97 |
633.45 |
Corporations |
467.08 |
96.45 |
0.01 |
563.55 |
Total |
4475.38 |
1253.97 |
185.44 |
5914.80 |
Source: Information Kerala Mission-2015
Fig 8.4
Category wise expenditure of Grant-in-aid to LGs during 2014-15
Source: Information Kerala Mission 2015
Sector-wise performance
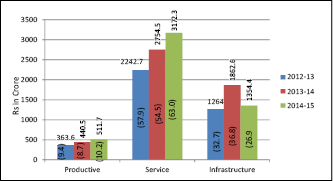
8.15 The LGs allocate their funds mainly in three sectors viz. productive, service and infrastructure. The total fund available for these sectors for the year 2014-15 was Rs.5914.80 crore. Out of this the allocation to productive, service and infrastructure sectors was 9 per cent, 54 per cent and 38 per cent respectively and the corresponding figures in the previous year was 9 per cent, 54 per cent and 37 per cent respectively. The sector wise allocation and expenditure details of 2014-15 are given in Figure 8.5 and the sector wise and local government wise percentage of expenditure to total expenditure is given in Table 8.4. It may be seen that in the productive sector the expenditure is low compared to service and infrastructure sectors in both the years, though there is a slight improvement in 2014-15. The percentage of expenditure is meagre in municipalities and corporations. The sector wise allocation and expenditure details in 2013-14 & 2014-15 are given in Appendix 8.3a & Appendix 8.3b.
Fig 8.5
Sector wise Allocation to Local Governments*
*Figures in parenthesis are respective percentage of expenditure to allocation
Source: Information Kerala Mission 2015
Table 8.4
Local Government wise and sector wise percentage of expenditure
(Rs. in crore)
Type of LGs |
2013-14 |
2014-15 |
||||
Productive |
Service |
Infrastructure |
Productive |
Service |
Infrastructure |
|
Grama Panchayat |
9.16 |
56.48 |
34.36 |
10.07 |
59.05 |
30.88 |
Block Panchayat |
7.93 |
59.58 |
32.48 |
7.91 |
60.07 |
32.02 |
District Panchayat |
9.45 |
60.36 |
30.19 |
9.55 |
57.78 |
32.67 |
Municipalities |
4.96 |
51.45 |
43.58 |
5.13 |
53.84 |
41.03 |
Corporation |
4.33 |
49.84 |
45.83 |
4.03 |
48.21 |
47.76 |
Source: Information Kerala Mission 2015
Productive Sector
8.16 Out of the total plan funds made available to productive sectors by Local Governments, 79 per cent of fund was earmarked for the implementation of various schemes under agriculture and allied sectors in 2014-15 while it was 83 per cent in the previous year. The LGs have given more weightage to agriculture and allied sectors compared to industries, energy, etc. during 2014-15 also. The initiative of rural local bodies in this respect is worth mentioning as a considerable amount of allocation was made under productive sector compared to urban local bodies. The Grama Panchayats have given major attention to the implementation of programmes in productive sectors by allocating 89 per cent of the total to this sector. The performance of Grama Panchayats is better in the productive sectors since they have spent 74 per cent of their allocation to this sector, while during 2013-14 the performance of Block Panchayats were better with 82 per cent of utilisation. The details of allocation and expenditure during 2014-15 are given in Table 8.5 and the percentage of allocation to different tiers is shown in Figure 8.6. The details of achievements during 2013-14 and 2014-15 are given in Appendix 8.4a & Appendix 8.4b
Table 8.5
Productive Sector - Allocation & Expenditure during 2014-15 (Rs. in Crore)
Type of LGs |
2014-15 |
||
Allocation |
Expenditure |
Percentage |
|
Grama Panchayat |
297.40 |
220.03 |
73.99 |
Block Panchayat |
63.80 |
44.87 |
70.34 |
District Panchayat |
88.08 |
54.85 |
62.27 |
Municipality |
33.90 |
20.82 |
61.41 |
Corporation |
28.48 |
12.16 |
42.67 |
Total |
511.66 |
352.73 |
68.94 |
Source: Information Kerala Mission 2015
Fig 8.6
Productive Sector - Percentage allocation to different Tiers of LGs during 2014-15
Figures in parenthesis are respective percentage of expenditure to allocation
Source: Information Kerala Mission 2015
Service Sector
8.17 Under service sector all LGs have given more attention to enhance the quality of basic services provided to the public through welfare oriented programmes with special emphasis on education, housing, health, drinking water, nutrition and social welfare, etc. In utilizing the funds, the service sector has performed better than the productive and infrastructure sectors. Block Panchayat performed well in the service sector by achieving 89 per cent of expenditure, while it was 93% in 2013-14. The sector wise allocation and expenditure are shown in Table 8.6 and percentage share of service sector to different tiers are shown in Figure 8.7 and sub sector wise details for 2013-14 & 2014-15 are shown in Appendix 8.5a & Appendix 8.5b
Table 8.6
Service Sector - Allocation & Expenditure during 2014-15 (Rs. in Crore)
Type of LGs |
2014-15 |
||
Allocation |
Expenditure |
Percentage |
|
Grama Panchayat |
1729.92 |
1290.37 |
74.59 |
Block Panchayat |
383.56 |
340.66 |
88.81 |
District Panchayat |
450.36 |
331.69 |
73.65 |
Municipality |
318.76 |
218.67 |
68.60 |
Corporation |
289.75 |
145.38 |
50.18 |
Total |
3172.35 |
2326.77 |
73.35 |
Source: Information Kerala Mission 2015
Fig 8.7
Service Sector - Percentage share of allocation to different Tiers of LGs during 2014-15
Source: Information Kerala Mission 2015
Figures in parenthesis are respective percentage of expenditure to allocation
Infrastructure Sector
8.18 During the review period, the Local Governments set apart 38 per cent of the total allocation for infrastructure sector while it was 37 per cent in 2013-14. Among the tiers, the Grama Panchayats allocated 52 per cent of their allocation to the sector. The expenditure during 2014-15 decreased to 61% from 74 % in 2013-14. In the utilization of plan fund in this sector, Block Panchayats and Municipalities achieved 79 % and 59 % of expenditure respectively during 2014-15, which is lower than that in 2013-14. Against the total allotment made in the infrastructure sector, 72 per cent of fund was earmarked for transportation facilities and the corresponding expenditure was 66 per cent. Transportation and building sectors together constituted 92 per cent of funds from their total outlay in the infrastructure sector. Tier wise, sub sector wise allocation and expenditure details in 2014-15 are given in Table 8.7 and percentage share of allocation to different tiers is shown in Figure 8.8 and sub-sector wise details of 2013-14 & 2014-15 in Appendix 8.6a & Appendix 8.6b.
Table 8.7
Infrastructure Sector - Allocation & Expenditure during 2014-15
(Rs. in Crore)
Type of LGs |
2014-15 |
||
Allocation |
Expenditure |
Percentage |
|
Grama Panchayt |
1156.53 |
674.65 |
58.33 |
Block Panchayat |
230.23 |
181.57 |
78.87 |
District Panchayat |
317.93 |
187.57 |
59.00 |
Municipality |
280.79 |
166.66 |
59.35 |
Corporation |
245.30 |
144.00 |
58.70 |
Total |
2230.78 |
1354.45 |
60.72 |
Source: Information Kerala Mission 2015
Fig 8.8
Share of Infrastructure Sector Allocation to different Tiers of LGs during 2014-15
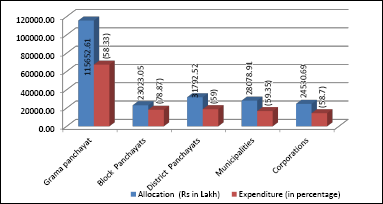
Source: Information Kerala Mission 2015
Figures in parenthesis are respective percentage of expenditure to allocation
Performance under Special Sector Plans
8.19 Women component plan and plan for disadvantaged groups (aged, children, disabled, palliative and other vulnerability) in the plan of local governments is one of the salient features in Kerala’s decentralisation. Out of the total plan size, local governments have to set apart the mandatory provision of 10 per cent for women development and 5 per cent for disadvantaged groups. In the case of special programme for Women Component Plan and children the expenditure decreased from 77 per cent to 72 per cent and 90 per cent to 86 per cent respectively. This year too,Rs.38.06 core and Rs.139.12 crore were set apart for palliative care and other vulnerability groups. The percentage of expenditure in palliative care is 88% during 2014-15, which is slightly higher than that in 2013-14 , which was 87%. Details of allocation and expenditure during 2014-15 are given in Table 8.8 and the figures in 2013-14& 2014-15 are given in Appendix 8.7a & Appendix 8.7b.
Table 8.8
Allocation and expenditure of Special Sector Plan for 2014-15
(Rs. in crore)
Special sectors |
2014-15 |
||
Allocation |
Expenditure |
Percentage |
|
Women Component Plan |
613.16 |
441.32 |
71.97 |
Special Programme for children |
174.36 |
149.56 |
85.77 |
Special Programme for elderly |
32.65 |
22.46 |
68.78 |
Differently abled |
115.33 |
88.36 |
76.61 |
Other Vulnerability |
139.12 |
92.78 |
66.70 |
Palliative Care |
38.06 |
33.43 |
87.81 |
Youth Welfare Programmes |
147.22 |
74.07 |
50.31 |
Source: Information Kerala Mission, 2015
Strengthening of District Planning Machinery
8.20 In order to deepen the Local Government system and reduce government control, the Amendment Acts provide provisions to create constitutional bodies for specific purposes. District Planning Committee, has been created as per article 243ZD of the Constitution of India at the district level for planning at district and below. Accordingly, District Planning Committees were constituted in all the fourteen districts in accordance with the spirit of the 74th amendment of the constitution so that they can play the nodal role in plan preparation by LGs, approval of local plans, providing suggestions to LGs, monitoring of plan implementation etc. and their integration at district level as also their linkages with the state plan. The DPC consists of 15 members headed by the District Panchayat President and District Collector is the Member Secretary. Twelve of the fifteen members are elected representatives from District Panchayat and Urban Local Governments in the ratio of rural -urban population in the District. One member is an expert nominated by the Government. All MPs and MLAs are permanent invitees of DPC and all the district level officers are ex-officio Joint Secretaries. The DPCs are fully functional in the State. The District Planning Officer, Joint Secretary (Co-ordination) assist the Member Secretary in convening meetings, preparation of agenda, minutes and all other secretarial duties. The constitution of DPC has been done every five years without fail in the State along with the election to the Local Self Governments.
8.21 The 1200 Local Governments in Kerala prepare more than two lakh projects every year and the responsibility of vetting these projects is a major responsibility as well as a risk on the part of DPC. At present the DPO Office which is functioning as the Secretariat of DPC is the agency to take up this difficult task within the limitation of lack of staff, space and even a proper building to accommodate all these records. Considering the varied functions and the volume of work involved, Government in 2006 decided to strengthen the District Planning Committee by attaching the Offices of the Deputy Director of Statistics and the District Town Planner to its Secretariat in addition to the District Planning Office. The duty of data analysis and interpretation for economic planning was entrusted to the District Planning Officer, Collection of information and data required for Local Level Planning to the Deputy Director of statistics and providing technical support to the District Town Planner. As there is no building to house the three offices included in the Secretariat under one roof, Government decided to construct DPC secretariat by using the fund from Central and State governments and contribution from LGs.
8.22 The construction of DPC buildings have been completed at Ernakulam, Thrissur, Kasaragod, Wayanad, Kannur, Alappuzha and Palakkad and have started functioning in six districts except Palakkad. In the other districts the work is progressing.
Box 8.1
Award System
In order to make the local bodies more functional in plan formulation, approval , implementation and monitoring in time, the State Planning Board has initiated an award system during 2012-13 onwards to the first three Districts which complete the plan formulation and implementation successfully in all respects. In the year 2012-13, Wayanad, Alappuzha and Ernakulam districts were selected as first, second and third and in the year 2013-14 Malappuram, Kottayam and Thiruvananthapuram bagged first , second and third prizes respectively.
Box 8.2
Study to Assess the Performance of Grama Panchayats under Decentralised Planning
The State Planning Board is now conducting a study in 152 randomly selected grama panchayats for the purpose of assessing the performance under decentralized planning. The study emphasizes grama sabha and peoples participation, functioning of working groups, resource mobilization, including own resources of the panchayats and their utilization, plan formulation and expenditure, monitoring mechanisms and major achievements and constraints.
The Study also gives emphasis to the topography and vulnerability of the panchayats predominated by tribals and fisher folk. It is nearing completion and the report will be published during this financial year
Best Practices
Box 8.3
Residential Flats for SC families in Feroke Grama Panchayat (Kozhikode district)
Residential Flat for SC families is an innovative project implemented by Feroke Grama Panchayat. The project is the first of its kind in the State. Around 24 residential flats comprising (6 clusters x 4 flats) have been constructed in 58 cents of land owned by the Panchayat in Puttekkad area. The plan and design of the buildings are characterised by architectural beauty and beautified surroundings. Each flat has a spacious bed room, dining room, kitchen and a drawing room. The courtyard has been paved with interlock bricks. Rainwater storage facilities, streetlights and quality drainage have been provided in the complex. The Panchayat started this project in the year 2011-12 and completed it in 2014-15. The project was completed at a cost of Rs.72.00 lakhs. The panchayat share was Rs. 48.00 lakhs and Rs. 1.00 lakh was collected as beneficiary contribution. Accommodating more number of families in minimum land holdings with better living standards is the main attraction of the project. Moreover facilities for rainwater harvesting are done effectively. The work was implemented through the accredited agency M/s. HABITAT, Thiruvananthapuram. The project was inaugurated on September 14, 2015
Box 8.4
Snehasparsham (www.snehasparsham.com)
Snehasparsham is an integrated project initiated by District Panchayat, Kozhikode for the rehabilitation of renal patients. The Project was launched in the year 2012 by registering a ‘Kidney Patients Welfare Society’ under the Charitable Societies Act. The jurisdiction of the Society is Kozhikode Revenue District. The District Panchayat President is the Chairperson and District Collector is the Chief Co-ordinator of the Society. The Secretary of the District Panchayat is the Convenor of the Society. The activities of the Society are monitored by an Executive Committee consisting of eminent personalities from various walks of life. Its office is functioning at District Panchayath Office Complex in Civil Station, Kozhikode. It primarily started as an initiative for the welfare of Kidney Patients in Kozhikode District. The source of funds for the project is managed as public contributions from individuals, Kudumbasree members, students, religious institutions, Residents Associations, local bodies etc. Kozhikode District Panchayath had allocated an amount of Rs.5.00 lakh each in 2012-13 and 2013-14and Rs.2.50 lakhs in 2014-15.
Major activities of the project include, supporting the shattered patients and their families both financially and morally and providing dialysis support and medicine for post transplant patients, at the rate of Rs. 2500/- per month (250 x 10 Dialysis)
Outlook
Kerala’s decentralisation experience is unique and encouraging, and it is recognized world over. The state is fortunate to have well established and strong local governments. It may be observed that decentralization has made its impact in local level planning. The systems developed under this process have become part and parcel of the development activities at the grass root level. Moreover the innovative initiatives to organize people’s participation through different organizational set up have been appreciated widely. Kerala Perspective Plan 2030 identifies the lessons from the Kerala’s experience in decentralization. Once the responsibilities are transferred the local governments are compelled to perform as there is pressure on elected representatives / government to assure that decentralization succeeds. But this process requires a continuous effort on the part of elected representatives and officials. While adequate and enhanced budgetary funds are provided to Local Governments, there is inadequate capacity among local governments to conceptualize and prepare detailed project reports, implement and monitor them. As project management skills are yet to be attained, capacity building is the most important gap that needs to be bridged. Conscious and consistent efforts have to be made for the sustainability of the whole process.