Foreword
External Sector
External Trade in Kerala
The external trade in Kerala is mainly operational through the Cochin Port. Kerala plays an important role in the export prospects of the nation by contributing to the export of spices and marine products. Major items of trade are cashew, coir and coir products, tea, coffee, pepper, cardamom, ginger, other spices and spices oil, marine products, machinery, chemicals, coal, fertilizers and raw materials. The total traffic handled by the Cochin Port increased from 215.95 lakh MT in 2014-15 to 220.98 lakh MT in 2015-16, or an increase by 2.33 per cent. Within this traffic, exports accounted for 39.14 lakh MT and imports accounted for 181.84 lakh MT (Table 6.1).
Table 6.1
Cargo Handled at Cochin Port during 2011-12 to 2015-16, in lakh MT
| Traffic | Export | Import | 2011-12 | 2012-13 | 2013-14 | 2014-15 | 2015-16 | 2011-12 | 2012-13 | 2013-14 | 2014-15 | 2015-16 | 1 | 2 | 3 | 4 | 5 | 6 | 7 | 8 | 9 | 10 | 11 | Coastal | 14.86 | 14.05 | 17.18 | 16.48 | 12.86 | 51.74 | 52.12 | 60.63 | 52.15 | 60.40 | Foreign | 28.25 | 24.29 | 25.32 | 24.10 | 26.28 | 106.06 | 107.99 | 105.73 | 123.22 | 121.44 | Total | 43.11 | 38.34 | 42.50 | 40.58 | 39.14 | 157.80 | 160.11 | 166.36 | 175.37 | 181.84 |
Source: Annual Report 2015, Cochin Port Trust.
Tea, cashew, coir and coir products, coffee, pepper, cardamom, ginger, other spices and spices oil and marine products are the major items exported through the Cochin Port. Considered together, coastal and foreign exports through the Cochin Port decreased by 3.55 per cent – from 40.58 lakh MT to 39.14 lakh MT – between 2014-15 and 2015-16. However, in value terms, coastal and foreign exports grew by 14.5 per cent between 2014-15 and 2015-16 (Appendix 6.1). Coastal exports decreased from 16.48 lakh MT in 2014-15 to 12.86 lakh MT in 2015-16. Foreign exports, on the other hand, increased from 24.10 lakh MT in 2014-15 to 26.28 lakh MT in 2015-16.
For specific commodities, there were sharp falls in the exports through the Cochin Port. Between 2014-15 and 2015-16, the export of spices declined by 41 per cent, of tea declined by 25.73 per cent, of cashew kernels declined by 25.60 per cent, of sea foods declined by 24.71 per cent, and of coffee declined by 16.09 per cent. In the export of coir products and miscellaneous products including POL, the decline was marginal to the extent of 0.97 per cent and 0.34 per cent respectively.
Fertilizers and raw materials, iron and steel and machinery, newsprint, raw cashew nut, food grains and POL are the main items of import through the Cochin Port. Imports through the Cochin Port increased from 175.37 lakh MT in 2014-15 to 181.84 lakh MT in 2015-16, which amounted to a growth by 3.6 per cent. Between 2014-15 and 2015-16, coastal imports grew by 15.82 per cent, while foreign imports shrank by 1.44 per cent.
Between 2014-15 and 2015-16, the import of fertilizers and raw materials decreased by 43 per cent and the import of raw cashew nuts decreased by 22.48 per cent. In the case of iron, steel and machinery, imports grew by 44.47 per cent between 2014-15 and 2015-16, which was higher than the preceding years. In 2015-16, about 95,475 MT of food grains were also imported through the Cochin Port. There was no import of newsprint reported in 2015-16. The import of all items, except fertilizers and raw materials, miscellaneous items and raw cashewnut, marked an increasing trend between 2014-15 and 2015-16 (Appendix 6.2).
Exports of Marine Products
The major items of export within marine products are frozen shrimp, frozen fish, frozen cuttle fish, frozen squid, dried items, live items and chilled items. Item-wise details of marine products export from India and Kerala in 2015-16 are given in Appendix 6.3.
In 2015-16, India exported 945,892 MT of marine products, which was valued at 30,420.83 crore. This was lower in quantity and in value compared to 2014-15, when 1,051,243 MT were exported valued at 33,441.61 crore. Marine products exports from Kerala, both in quantity and value, declined between 2014-15 and 2015-16; the quantity decreased from 166,754 MT in 2014-15 to 149,138 MT in 2015-16 and the value decreased from 5,166.08 crore in 2014-15 to 4,644.42 crore in 2015-16. The share of Kerala in Indian exports declined from 15.86 per cent to 15.77 per cent (in quantity) and from 15.45 per cent to 15.27 per cent (in value) during the period under review (Table 6.2).
Table 6.2
Export Trend of Marine Products, India and Kerala, 2010-11 to 2015-16,Quantity in Tonnes and Value in lakh
| Year | India | Kerala | Kerala’s share Per cent | Quantity (Tonnes) | Value ( Lakh) | Quantity (Tonnes) | Value ( Lakh) | Quantity | Value | 2010-11 | 813091 | 1290147 | 124615 | 200210 | 15.33 | 15.52 | 2011-12 | 862021 | 1659723 | 155714 | 298833 | 18.06 | 18.00 | 2012-13 | 928215 | 1885626 | 166399 | 343585 | 17.93 | 18.22 | 2013-14 | 983756 | 3021326 | 165698 | 470636 | 16.84 | 15.58 | 2014-15 | 1051243 | 3344161 | 166754 | 516608 | 15.86 | 15.45 | 2015-16 | 945892 | 3042083 | 149138 | 464442 | 15.77 | 15.27 |
Source: The Marine Products Export Development Agency (MPEDA).
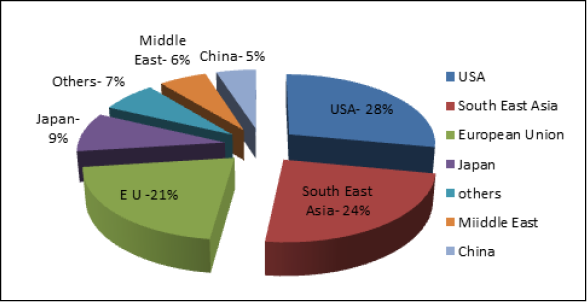
The USA is the largest market for Indian marine products with a share of 28 per cent followed by South East Asia (24 per cent), European Union (21 per cent), Japan (9 per cent), Middle-East (6 per cent) and China (5 per cent). Major importers of marine products from India and their share in 2015-16 are shown in Figure 6.1.
Figure 6.1
Market-wise Exports of Marine Products, 2015-16, in per cent
Source: Cochin Port Trust
Exports of Cashew
In 2015-16, the share of agricultural products in the total export earnings of India was 6.84 per cent; cashew kernels ranked 6th among agricultural products, contributing 4.28 per cent of the total agricultural product exports. The total export of cashew kernels from India in 2015-16 was 96,346 MT valued at 4,952.12 crore as against 118,952 MT valued at 5,432.85 crore in 2014-15. This represented a decline between 2014-15 and 2015-16 of 19 per cent in quantity and 9 per cent in value. The major markets for Indian cashew kernels are USA, UAE, Japan, Saudi Arabia, Netherlands, UK, France, Spain, Germany, Korea, Iran, and Malaysia.
Exports of cashew kernels from Kerala showed a sharp decline in quantity by 25.68 per cent and in value by 16.76 per cent between 2014-15 and 2015-16. The exports of cashew kernels stood at 50,652 MT valued at 2579.49 crore in 2015-16, while the corresponding figures were 68150 MT and 3098.75 crore respectively in 2014-15. Kerala’s share in the total export of cashew kernels from India, in quantity terms, was 57.29 per cent in 2014-15, which declined to 52.57 per cent in 2015-16. In value terms, the share was 57.04 per cent in 2014-15, which fell to 52.09 per cent in 2015-16 (Table 6.3).
Table 6.3
Exports of Cashew Kernels, Kerala and India, 2010-11 to 2015-16, Quantity in MT and Value in crore
| Year | Kerala* | India | Share of Kerala (Per cent) |
Quantity | Value | Quantity | Value | Quantity | Value | 2010-11 | 56578 | 1478.67 | 105755 | 2819.39 | 53.50 | 52.45 | 2011-12 | 68655 | 2295.84 | 130869 | 4383.82 | 52.46 | 52.37 | 2012-13 | 53624 | 2138.47 | 100105 | 4046.23 | 53.57 | 52.85 | 2013-14 | 65679 | 2861.75 | 114791 | 5058.73 | 57.22 | 56.57 | 2014-15 | 68150 | 3098.75 | 118952 | 5432.85 | 57.29 | 57.04 | 2015-16 | 50652 | 2579.49 | 96346 | 4952.12 | 52.57 | 52.09 |
*Export through Cochin Port.
Source: The Cashew Export Promotion Council of India
The export of cashew nut shell liquid/cardanol from India in 2014-15 was 10,938 MT valued at 55.81 crore, which increased to 11,677 MT valued at 57.59 crore in 2015-16. The quantity of exports increased by 6.76 per cent and the value of exports increased by 3.19 per cent. But the export of cardanol through the Cochin Port, which was 818 MT with a value of 2.7 crore in 2014-15, declined to 111 MT valued at 0.27 crore in 2015-16 (Appendix 6.4).
India continued to be the largest producer of raw cashewnuts in the world. Production of raw nuts in India in 2015-16 was 670,300 MT as against the estimated production of 725,420 MT in 2014-15. Vietnam, Brazil, Tanzania, Ivory Coast, Guinea, Mozambique and Indonesia are the other main raw nut producing countries in the world. The total raw cashew nuts imported into India in 2015-16 was 958,339 MT valued at 8561.01 crore; the corresponding figures were 939912 MT and 6570.93 crore in 2014-15. The substantial increase in the value of imported raw cashew nuts was due to the rise in the unit price of raw cashew nuts from 69.91 per kg to 89.33 per kg. Import of raw cashew nuts through the Cochin Port, which was 213,106 MT in 2014-15, declined by 25.9 per cent to reach 157,905 MT in 2015-16.
Exports of Coffee
Export of coffee from India in 2015-16 was reported as 318,100 MT (provisional) valued at 5175.56 crore. This represented an increase of 16.89 per cent in quantity and 7.72 per cent in value over 2014-15, when the quantity exported was 272,139 MT and value of exports was 4804.48 crore.
Export of coffee from Kerala through the Cochin Port in 2015-16 was 62,883 MT valued at 986.18 crore, as against 58,601 MT valued at 1007.33 crore in 2014-15. The decrease in the value was due to the fall in unit price of coffee
Exports of Tea
Export of tea from India in 2015-16 was reported as 232,920 MT valued at 4493.10 crore; this represented an increase over 2014-15 when exports were 199,077 MT in quantity and 3823.64 crore in value.
Export of tea from Kerala ports stood at 69706 MT valued at 1025.34 crore in 2015-16 as against 69343 MT valued at 948.78 crore in 2014-15. The exports slightly increased by 0.52 per cent in volume and 8.07 per cent in terms of value (Table 6.4).
Table 6.4
Exports of Tea from Kerala Ports and India, 2010-11 to 2016-17, Quantity in MT and Value in crore
| Year | Kerala | India | Quantity | Value | Quantity | Value | 2010-11 | 48104 | 552.12 | 222019 | 3058.31 | 2011-12 | 71784 | 742.87 | 214355 | 3304.83 | 2012-13 | 69017 | 904.62 | 216231 | 4005.93 | 2013-14 | 75036 | 1064.67 | 225764 | 4509.09 | 2014-15 | 69343 | 948.79 | 199077 | 3823.64 | 2015-16 | 69706 | 1025.34 | 232920 | 4493.10 | 2016-17* | 32248 | 545.97 | 101042 | 2084.06 |
*April-September.
Source: Tea Board, India
Exports of Coir and Coir Products
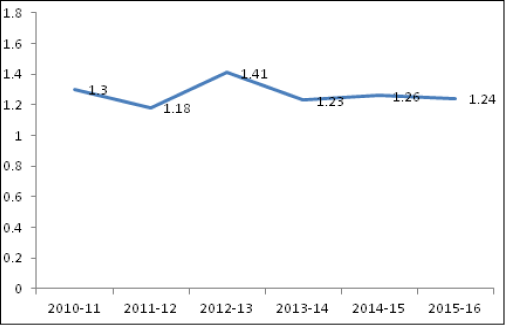
Main coir products exported from India are coir mat, coir yarn and other coir products. The exports of coir and coir products through the Cochin Port recorded a marginal decline by 0.97 per cent between 2014-15 and 2015-16. The quantity of exports, which stood at 125,523 MT with a value of Rs. 389.12 crore in 2014-15, slightly fell to 124,305 MT with a value of Rs. 374.03 crore in 2015-16. The export trend of coir and coir products through the Cochin Port for the period between 2010-11 and 2015-16 is shown in
Figure. 6.2.
Figure 6.2
Export Trends of Coir and Coir Products from Cochin Port, Quantity in Lakh MT
Source: Cochin Port Trust.
Exports of Spices
In 2015-16, Indian spices exports showed an increasing trend in value. A total of 843,255 MT of spices and spice products valued at 16,238.23 crore was exported from India in 2015-16, as against 893,920 MT with a value of 14,899.68 crore in 2014-15. This represented an increase of 9 per cent in value and decline of 5.67 per cent in volume, which was mainly due to a decline in the export of cumin.
Pepper, cardamom, chilli, ginger, turmeric, coriander, cumin, celery, fennel, fenugreek, other seed spices, garlic, tamarind, nutmeg & maize, other miscellaneous spices, curry powder/paste, spice oils and mint products are the main spices exports through Kerala ports. Export of spices from Kerala (through Cochin and Thiruvananthapuram Ports) increased from 81555.27 MT with a value of 3285.34 crore in 2014-15 to 100,076 MT valued at 3905.18 crore in 2015-16. This represented an increase of 18.87 per cent in value and 22.71 per cent in volume.