Foreword
LSG and Decentralised Planning
Category - wise performance
As mentioned earlier, the allocation of grant-in-aid to Local Governments falls in three categories-General Sector, Special Component Plan and Tribal Sub Plan. The outlay for each category is fixed on the basis of recommendations of the State Finance Commission. During 2015-16, an amount of 6069.18 crore was allocated to different categories of which general category, SCSP & TSP constituted 74 per cent, 23 per cent, and 3 per cent respectively. There is a marginal increase in general sector but allocation in SCSP & TSP fund increased by 9.3 percentage and 21 percentage respectively compared to 2014-15. An analysis of category wise utilization during 2015-16 reveals that the percentage of expenditure under General Sector was 77 per cent of the plan outlay and in the case of SCSP and TSP, it was 63 per cent and 67 per cent respectively. Shortfall in expenditure of SCSP/TSP is a common phenomenon for all tiers of Local Governments except for Block Panchayats, but the least utilization of SCSP and TSP funds is in urban local bodies. The category wise and local body wise allocation during 2015-16 is given in Appendix 8.2a and Appendix 8.2b. The caterory wise expenditure is given in Figure 8.4.
Figure 8.4
Category wise expenditure of Grant-in-aid to LGs during 2015-16, in per cent

Source: Information Kerala Mission 2016
The annual budget allocation of plan grants in aid to local self governments during Annual plan 2015-16 & 2016-17 is given in Table 8.2.
Table 8.2
Category wise Budget allocation of Grant-in-aid to LGs during 2015-16 & 2016-17 ( in Crore)
| Type of LGs | 2015-16 | 2016-17 | General | SCP | TSP | Total | General | SCP | TSP | Total | Grama Panchayats | 2124.59 | 478.63 | 82.37 | 2685.59 | 1968.25 | 516.46 | 88.62 | 2573.34 | Block Panchayats | 435.98 | 159.54 | 27.46 | 622.98 | 361.66 | 178.69 | 30.76 | 571.11 | District Panchayats | 435.98 | 159.54 | 27.46 | 622.98 | 361.66 | 178.69 | 30.76 | 571.11 | Municipalities | 418.02 | 71.42 | 1.93 | 491.38 | 642.33 | 95.82 | 5.82 | 743.98 | Corporations | 318.61 | 58.44 | 0.00 | 377.05 | 471.19 | 69.22 | 0.01 | 540.43 | Total | 3733.20 | 927.58 | 139.21 | 4800.00 | 3805.10 | 1038.90 | 156.00 | 5000.00 # |
# excluding 500 Crore which is earmarked as additional plan assistance to local bodies
Source: Appendix IV 2015-16 and 2016-17
The LGs allocate their funds mainly in three sectors viz. productive, service and infrastructure. The total fund including opening balance for these sectors for the year 2015-16 was 6069.18 crore. Out of this, the allocation to productive, service and infrastructure sectors was 8 per cent, 54 per cent and 38 per cent respectively. It may be noted that the total expenditure under productive sector is less than 10 percentage during the last two annual plans. The expenditure by urban local bodies poor in productive and service sector compared to their rural counterparts. The sector wise allocation and expenditure details of 2015-16 are given in Figure 8.5 and the sector wise and local government wise percentage of expenditure to total expenditure is given in Table 8.3. The sector wise allocation and expenditure details in 2014-15 & 2015-16 are given in Appendix 8.3a and Appendix 8.3b.
Figure 8.5
Sub Sector wise Allocation to Local Governments, in crore
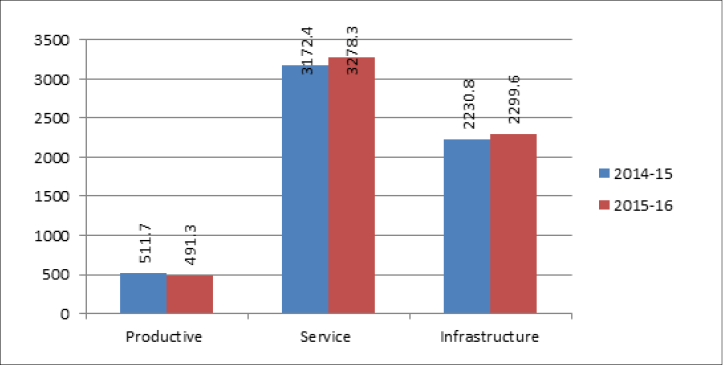
Source: Information Kerala Mission 2016
Table 8.3
Local Government wise and sector wise percentage of expenditure to total expenditure during 2014-15 and 2015-16, in per cent
| Type of LGs | 2014-15 | 2015-16 | Productive | Service | Infrastructure | Productive | Service | Infrastructure | Grama Panchayat | 10.07 | 59.05 | 30.88 | 8.80 | 53.20 | 38.00 | Block Panchayat | 7.91 | 60.07 | 32.02 | 7.90 | 59.5 | 32.60 | District Panchayat | 9.55 | 57.78 | 32.67 | 7.00 | 60.5 | 32.50 | Municipalities | 5.13 | 53.84 | 41.03 | 5.20 | 51.40 | 43.4 | Corporation | 4.03 | 48.21 | 47.76 | 4.30 | 48.70 | 47.0 | Total | 8.7 | 57.7 | 33.6 | 7.7 | 54.4 | 37.9 |
Source: Information Kerala Mission 2016
Productive Sector
Out of the total plan funds earmarked to productive sector by Local Governments, 83 per cent of fund was allocated for the implementation of various schemes under agriculture and allied sectors in 2015-16 while it was 79 per cent in the previous year. The LGs have given more weightage to agriculture and allied sectors compared to industries and other productive sectors. The rural local bodies , especially Grama Panchayats have given major attention to the implementation of agriculture and allied programmes in productive sectors by allocating 84 per cent of the total to this sector. The productive sector includes sub sectors such as agriculture, irrigation, industry, energy conservation, fisharies etc. The details of allocation and expenditure during 2015-16 are given in Table 8.4 and the percentage of allocation to different tiers is shown in Figure 8.6. The details of productive sector achievements during 2014-15 and 2015-16 are given in Appendix 8.4a and Appendix 8.4b.
Table 8.4
Productive Sector - Allocation & Expenditure during 2015-16, in Crore
| Type of LGs | 2015-16 | Allocation | Expenditure | Percentage | Grama Panchayat | 270.2 | 210.1 | 78 | Block Panchayat | 65.6 | 49.5 | 76 | District Panchayat | 79.3 | 41.1 | 52 | Municipality | 42.9 | 27.3 | 64 | Corporation | 33.3 | 14.8 | 45 | Total | 491.3 | 342.9 | 70 |
Source: Information Kerala Mission 2016
Figure 8.6
Productive Sector - allocation and expenditure of different Tiers of LGs during 2015-16, in crore
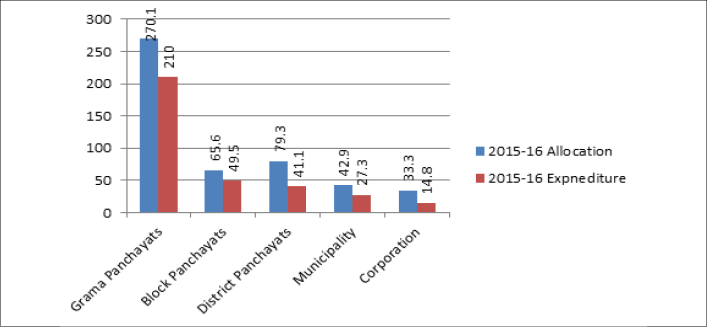
Source: Information Kerala Mission 2016
Service Sector
Local governance makes service delivery decisions more responsive to local needs and to involve local populace in public governance. The service sector priorities of local governments enhance the quality of basic services provided to the public through welfare oriented programmes with special emphasis on education, housing, health, drinking water, nutrition and social welfare, etc. Service sector fund utilization during 2015-16 is comparatively better than the productive and infrastructure sectors. Block Panchayats performed well in the service sector activities by achieving about 89 per cent of expenditure during 2014-15 and 2015-16. The allocation and expenditure under service sector is shown in Table 8.5 and Figure 8.7. The sub sector wise details for 2014-15 & 2015-16 are shown in Appendix 8.5a and Appendix 8.5b
Table 8.5
Service Sector - Allocation & Expenditure during 2015-16, in crore
| Type of LGs | 2015-16 | Allocation | Expenditure | Percentage | Grama Panchayat | 1622.27 | 1269.77 | 78 | Block Panchayat | 415.15 | 371.24 | 89 | District Panchayat | 497.41 | 358.68 | 72 | Municipality | 390.35 | 266.23 | 68 | Corporation | 353.07 | 167.70 | 48 | Total | 3278.25 | 2433.63 | 74 |
Source: Information Kerala Mission 2016
Figure 8.7
Service Sector - allocation and expenditure of different Tiers of LGs during 2015-16, in crore

Source: Information Kerala Mission 2016
Infrastructure Sector
During 2015-16, the Local Governments set apart 38 per cent of the total allocation to infrastructure sector activities such as street lighting, transportation , construction activities etc. Among the three tiers of local governments, the Grama Panchayats effectively utilized the allocation for infrastructure development, ie 82 per cent utilization. The expenditure during 2015-16 shows a considerable improvement, the overall infrastructure expenditure is 74 per cent. In the utilization of plan fund in this sector, Block Panchayats and Municipalities achieved 81 per cent and 70 per cent of expenditure respectively during 2015-16 which is better off compared to 2014-15.. Against the total allotment made in the infrastructure sector, 78 per cent of fund was earmarked for transportation facilities and the corresponding expenditure was 77 per cent. Tier wise, sub sector wise allocation and expenditure details in 2015-16 are given in Table 8.6 and percentage share of allocation to different tiers is shown in Figure 8.8 and sub-sector wise details of 2014-15 & 2015-16 in Appendix 8.6a Appendix 8.6b
Table 8.6
Infrastructure Sector - Allocation & Expenditure during 2015-16, in crore
| Type of LGs | 2015-16 | ||
| Allocation | Expenditure | Percentage | |
| Grama Panchayt | 1107.89 | 906.30 | 82 |
| Block Panchayat | 251.80 | 203.98 | 81 |
| District Panchayat | 329.74 | 193.70 | 59 |
| Municipality | 321.70 | 224.67 | 70 |
| Corporation | 288.47 | 162.56 | 56 |
| Total | 2299.61 | 1691.22 | 74 |
Source: Information Kerala Mission 2016
Figure 8.8
Infrastructure Sector -allocation & expenditure to different Tiers of LGs during 2015-16, in crore

Source: Information Kerala Mission 2016