Chapter 3
INDUSTRY, LABOUR AND EMPLOYMENT

Introduction
IIndustry has been performing sub-optimally in the country in recent times. During April- October, 2013, at the All India level, there was negative growth of 2.7 per cent and 0.3 per cent in Mining and Manufacturing over the same period in the previous year. Only the electricity sector showed a growth of 5.3 per cent in this period. Taken together, Industry (mining, manufacturing and electricity) remained stagnant. Negative growth was observed in Food products, Wood products, Rubber and Plastics Products, Basic metals and various machinery items. Capital goods industry showed a negative growth of 0.2 per cent in April- October 2013. This dismal performance of industry, due to a variety of reasons including low business expectations and high interest rates, has critical implications on Kerala, which is dependent on the supply of industrial inputs, intermediary goods and final consumption goods from the rest of the country. Any supply bottlenecks can push up input as well as output prices. Further, Kerala’s own industry, especially export oriented industry will also be dampened if industry in the rest of the country (and world) is stagnant, as there will be less demand for Kerala’s goods. This chapter brings out critical issues relating to State Public sector Industries, Micro, small and medium industries and traditional industries. Critical issues on labour and employment are brought out to show Kerala’s unique achievements on the labour front and concerns on the employment front.
In Kerala the manufacturing sector registered a growth rate of 12.4 per cent at current prices during 2012-13 compared to the growth rate of 15.4 per cent in the previous year. The contribution of income from manufacturing sector to GSDP at constant and current prices during 2012-13 was 7.7per cent and 7.6 per cent respectively. The income from manufacturing sector to GSDP and its growth rates from 2007-08 to 2012-13 are given in Appendix 3.1. The per centage contribution of Manufacturing sector to GSDP from 2007-08 to 2013-14 did not show a definite trend. A drastic decline can be observed during 2009-10 and after that there was an increase, which again declined during 2011-12 as shown in Fig.3.1
.
Industry
Minerals
Kerala is endowed with minerals such as Heavy Mineral Sands (Ilmenite, Rutile, Zircon, Monazite, Silimanite), Gold, Iron Ore, Bauxite, Graphite, China Clay, Fire Clay, Tile and Brick Clay, Silica Sand, Lignite, Limestone, Limeshell, Dimenstion Stone(Granite), Gemstones, Magnesite, Steatite etc. However, mining activities on large scale are confined mainly to a few minerals – Heavy Mineral Sands, China Clay and to a lesser extent Limestone/Limeshell, Silica Sand and Granite. In fact, Heavy Mineral sand and China Clay contribute more than 90% of the total value of major mineral production in the State. However, 75% of the mineral revenue comes from the minor minerals. Major industries in Kerala based on Major minerals are given in Box 3.1
Box 3.1
Mineral Based Industries in Kerala
• Indian Rare Earths Ltd., Chavara
• Kerala Minerals and Metals Ltd., Chavara
• Malabar Cements, Walayar
• Travancore Cements Ltd., Kottayam
• Kundara Ceramics, Kollam
• English Indian Clays Ltd. (EICL), Thiruvananthapuram
• Excel Glass Industry, Alappuzha
• Kerala Clays and Ceramic Products Ltd., Pazhayangadi, Kannur
.3.2 Unlike other states, due to the unique nature of the State of Kerala (non availability of land for mining, vast expanse of reserve forest and dense population) mineral resources cannot be exploited with ease. Mining, being a destructive activity, invites all kinds of environmental problems (lowering of water table, noise pollution, dust pollution, public safety, threat to flora and fauna, contamination of water, deterioration of river ecosystem etc.). However mining in the State cannot be stopped altogether as minerals (especially those of the category of building materials) are an integral part of infrastructure development of the State.
3.3 There are 83 major mineral mines that are mined in the State. Also there are 3924 licensed minor mineral quarries in the State. Government gets revenue from minerals mainly by way of royalty. Revenue collected during the year 2012-13 is ` 49.7 crore (` 12.33 crore from major minerals and ` 37.37 crore from minor minerals) which is 12 % higher than the previous year collection of ` 44.3 crore. Total area covered by mining leases is 3314.52 ha. The mineral wise details of area covered by mining leases are given in Appendix 3.2.
3.4 The production of various major and minor minerals in the state during 2012-13 and the royalty are given in Appendix 3.3. An analysis of revenue collection shows that Kollam district has the highest collection of ` 8.51 crore (17% of total revenue) followed by Ernakulam (12%). The least revenue collection of ` 1.21 crore is from Idukki (2%). The district wise collection of revenue from major and minor minerals are furnished in Appendix 3.4
Manufacturing
Fig.3.1
Contribution of Manufacturing Sector to GSDP at 2004-05 prices

Table 3.1
Plan Outlay and Expenditure (रin Lakh)
(` in Lakh)
Sl. No. |
Sector |
Annual Plan 2011-12 |
Annual Plan 2012-13 |
Annual Plan 2013-14 |
||
1 |
Village & Small Enterprises |
Outlay |
Expdr. |
Outlay |
Expdr. |
Outlay |
i |
Small-scale Industries |
4060.00 |
2616.50 |
5505.00 |
4604.93 |
5755.00 |
ii |
Commerce |
10.00 |
10.00 |
75.00 |
75.00 |
90.00 |
iii |
Handicrafts |
226.00 |
226.00 |
300.00 |
348.25 |
431.00 |
iv |
Handloom & Power loom |
5767.00 |
6539.22 |
6832.00 |
5645.19 |
7676.00 |
v |
Coir Industry |
8205.00 |
8734.51 |
10070.00 |
9838.38 |
11137.00 |
vi |
Khadi & Village Industries |
928.00 |
928.00 |
1210.00 |
411.00 |
1331.00 |
vii |
Cashew Industry |
5200.00 |
4750.00 |
6500.00 |
6121.95 |
7150.00 |
viii |
Beedi Industry |
40.00 |
32.27 |
Nil |
Nil |
Nil |
|
Subtotal – VSE |
24436.00 |
23836.50 |
30492.00 |
27044.70 |
33570.00 |
2 |
Other Industries |
22030.00 |
15266.12 |
24067.00 |
23606.00 |
23934.00 |
3 |
Minerals |
162.00 |
58.22 |
211.00 |
187.16 |
432.00 |
|
Total : Industry & Minerals |
46628.00 |
39160.84 |
54770.00 |
50837.86 |
57936.00 |
Source: Finance Department, Govt. of Kerala
3.5 There was an increase of 17.5% in outlay provided for Industry and Minerals during 2012-13 over the previous year. The total outlay during 2013-14 is ` 579.36 crore which is 5.8% higher than the outlay in 2012-13. Upto November 2013, only 16.25 per cent of allocation under Village and Small Industry has been spent. Performance on the expenditure front in Other Industries and Minerals has also been low. Expenditure usually does pick up in the last quarter of the financial year
Public Sector Undertakings
3.6 Public Sector Enterprises, both at the Central level and at the State level have played a very important role in the industrialisation and the overall development of the country. State Public Sector Enterprises are one of the largest employers in the organised sector in the state.
3.7 There are 44 PSUs under the Industries Department, of which 37 are in the manufacturing sector and 7 in the non-manufacturing sector. Sector wise number of PSUs is shown in Fig. 3.2.
Fig 3.2
Sector wise number of PSUs as on 31.3.2013

3.8 Public Sector Restructuring and Internal Audit Board (RIAB) constituted in 1993 executes State Owned Enterprise Reform Initiatives. Performance planning and monitoring of PSUs, Enterprise reconstruction, Capacity building / Recruitments in PSUs and Governance advisory support are the major responsibilities.
Box 3.2
Major Initiatives in PSUs during 2012-13
• For ensuring transparency in purchases, e-procurement was introduced from August 2012 in PSUs for all purchases above ` 1 lakh. Purchase worth ` 293.67 crores were made through e-procurement.
• E-payment was introduced as part of the e-procurement system.
• To co-ordinate all the activities of PSUs and Departments, a web based MIS portal was launched by Keltron.
• For speedy and timely completion of audit and for ensuring transparency in accounting, ERP system is being introduced in all PSUs.
• Various social and welfare measures for education, health, basic necessities like drinking water etc are being implemented by Malabar Cements Ltd., Kerala Minerals and Metals Ltd, Transformers and Electricals Kerala Ltd, Kerala State Industrial Development Corporation Ltd, Steel and Industrial Forgings Ltd and Kerala State Industrial Enterprises Ltd, as part of Corporate Social Responsibility initiatives of these PSUs.
• An MOU was signed with SAIL for a project worth ` 3250 crore for increasing the production of the new Titanium Sponge plant of Kerala Minerals and Metals Ltd, to 10000 MT.
• Keltron has set up Solar Power Panels in various jails. Establishment of solar panel by profit making PSUs is under progress.
• Kerala Cashew Development Corporation has started production of Chocolate coated cashew, a value added product. One Time Settlement with banks is under progress for settlement of long pending dues of cashew development and CAPEX.
3.9 During 2012-13, 22 PSUs have registered profit and 22 registered loss. The performance trend of PSUs during the last 5 years is given in Appendix 3.5. During 2013-14 (up to October 2013) PSUs have recorded a turnover of ` 1508.94 crore and a net loss of ` 90.05 crore. During 2012-13, PSUs have recorded a net profit of ` 75.25 crore. Details of PSU-wise turnover and profit/loss during 2012-13 are shown in Appendix 3.6. The number of loss making PSU’s have reduced from 26 to 22 and turned to profit making units. But the net profit has reduced from ` 222.87 crore to ` 75.25 crore, indicating higher cost of inputs.
Joint Stock Companies
3.10 The total number of joint stock companies in Kerala as on March 2013, is 21990 of which 93% are private limited and 7% public limited. During 2012-13, 2729 companies were newly registered (2680 private and 49 public) and 262 companies were wound up. Seven public companies were converted to private companies and 13 companies were converted from private to public. Details of joint stock companies working in Kerala are given in Appendix 3.7.
Box 3.3
Newly Registered Government Companies during 2012-13
1. Kerala State Minorities Development Finance Corporation Limited
2. Vision Varkala Infrastructure Development Corporation Limited
3. Kerala State Welfare Corporation For Forward Communities Limited
4. Kerala Medical Infrastructure Development Limited
5. Kerala Monorail Corporation Limited
Micro Small and Medium Enterprises (MSMEs)
3.11 The Micro, Small and Medium Enterprises (MSME) sector is fast emerging into a major income generating and employment providing sector in Kerala with relatively lower investment. Kerala is one of the main centres of MSMEs in the country. As per the MSME survey & Quick Results of 4th Census 5.62 per cent of all India share of MSME enterprise is in Kerala. MSME sector can lead the State economy by increasing exports through quality production techniques and products. Government provides various schemes in MSME sector, targeting various social groups like SC, ST, Women, Youth, Physically Handicapped etc. In Kerala, Government and banks are providing lot of facilities for MSME Sector.
3.12 Within the MSME Sector there is a significant increase of Micro Enterprises, both in terms of working enterprises and employment. There are over 6000 various MSME products ranging from traditional to high-tech items which are manufactured in this sector.
3.13 MSMEs play a critical role in innovation, and have ability to experiment with new technologies on small scales. However, they often suffer from funds, lack of entrepreneurial spirit, inability to take technology developments risks and face the difficulty of attracting skilled manpower. The industries coming under this sector are handicrafts, Handloom, Khadi, Food processing industries, Garment making and Textile industries, industries related to coir/wood/bamboo/Plastic/rubber/ leather/ clay products etc.
3.14 The Industrial and Commercial Policy 2011 will strive to convert Kerala State into an entrepreneurial society from a wage earning society. (www.kerala.gov.in\docs\policies\ draftic_policies11
Draft Industrial and Commercial Policy in Kerala - 2011
National Manufacturing Policy (NMP)
3.15 National Manufacturing Policy notified in November , 2011, with the objective to enhance the share of manufacturing in GDP to 25% and create 100 million jobs over a decade, gives importance to rationalization and simplification of business regulations, NIMZ, Incentives for SMEs, Industrial training & skill upgradation measures etc.
Profile of the MSME Sector
3.16 The number of New Enterprises filed Memorandum under MSMED Part II during the year 2012-13 was 13043. Out of which 413 MSMEs are by SC, 66 by ST and 3122 by Women. The number of new enterprises that filed Memorandum during 2012-13 shows 18 per cent increase against 11079 of the previous year. Investment on the sector decreased by 3 per cent from ` 190642.75 lakh of the previous year to ` 185074.41 lakh in 2012-13 while employment generated increased by about 4 per cent from 79181 to 81964. The value of goods and services produced in 2012-13 has been increased by 6 per cent ie, ` 621424.55 lakh over ` 584985.35 lakh in the previous year. The details are in Appendix 3.8.
3.17 During the current year (as on 30.11.2013) 9048 new enterprises have filed memorandum with an investment of ` 134207.07 lakh to provide employment to 54707 persons. The details are given in Appendix 3.9.
3.18 The total number of SSIs/MSMEs registered in Kerala as on 31.3.2013 is 219444 against 205987 in the previous year indicating a growth of about 7 per cent. Out of the total SSIs/MSMEs, 4 per cent are promoted by SCs, approximately 1 per cent by STs and 25 per cent by women entrepreneurs. The total investment was ` 1212674 lakh in 2012-13 against ` 1083169 lakh in the previous year, with an increase of almost 12 per cent and the total number of employment generated was 1103126 indicating more than 8 per cent over the previous year which was 1021162. Details of enterprises are given in Appendix 3.10.
Performance of the sector for the past 5 years
3.19 Investment, number of new units, production & employment in MSME sector over the past years is shown in the figure 3.3 and 3.4. The employment & production has been increased over the period while investment decreased. The details is given in Appendix 3.11.
Fig 3.3
Investment, Production & Employment in MSME sector over
the past years from 2007-08 to 2012-13

Fig 3.4
New units and Investment in MSME sector over last 5 years

District wise achievements
3.20 District wise analysis reveals that during the year under review, Ernakulam occupies highest position in all aspects with 1878 new MSME units and Idukki was at the lowest position except in total investment. Idukki has only 193 new MSME units. The Wayanad District shows the minimum investment of ` 3296.74 lakh. But the maximum number of SSI/MSME units are in Thiruvananthapuram with 29720. Thrissur at second position.
3.21 Details of enterprises that filed memorandum & District-wise details of enterprises which filed memorandum in Kerala during 2012-13 and 2013-14 (up to 30.09.2013) are given in Fig 3.5.
Fig 3.5
District wise investment, Value and Employment of
Enterprises registered in Kerala during 2012-13

Box 3.4
Major schemes/initiatives of the Annual Plans 2012-13 & 2013-14
Entrepreneurship Support Scheme(ESS)
Provide assistance to entrepreneurs in Fixed Capital Investment and Technology Acquisition to start new enterprises with special attention to women, SC/ST categories, Thrust Industries and enterprises starting in Wayanad and Idukki Districts.
Infrastructure Development under MSME sector – Multi storied Galas
Development of industrial galas for the benefit of MSME entrepreneurs, with quality infrastructure like roads, power, water, waste management etc. through PPP mode. It is envisaged to construct Multistoried Industrial Estates and an exhibition cum convention centre.
Capacity Building
Other than giving emphasis on skill development, the scheme provides Industrialization support/ other industrial promotion activities and creation of Business Incubation services.
Development of Commerce
Assistance to conduct research studies and evolve long term policy frame work for the sustained growth of commerce sector, Conduct or participate in national and international events/exhibitions and Institute awards for MSME sector.
MSE-Cluster Development Programme
This is a Centrally Sponsored Scheme of cluster development for micro, small and medium enterprises and provide assistance for sourcing of raw material, mutual credit guarantee for sourcing loans, common brand creation, marketing, setting up of CFSC, training, quality testing etc. Infrastructure development is also incorporated in this programme.
Achievements
In the plan period, State Government created appropriate investment climate to attract private investment to MSME sector by providing assistance such as working capital, adequate infrastructure, skill development training and financial assistance for technology upgradation and participation in fairs & marketing. The Government also implemented schemes/programmes on revival and strengthening of existing industrial enterprises/units, modernization, product diversification and value addition. KINFRA started and established several new Initiatives in Food Processing through Food parks.
Industrial Co-operative Societies
3.22 In Kerala, the total number of working Industrial co-operative societies as on 31.3.2013 was 621 against 582 in the previous year. Out of which, 151 Societies were registered by women. The details are given in Appendix 3.12.
Industrial Development Plot / Areas
3.23 Directorate of Industries and Commerce (DIC) is providing and developing infrastructure facilities for small scale sector in the state. At present there are 38 DA/DP s under DIC having a total acquired area of 2478.51 Acre. A total of 2176 working units are working in these DA/DPs which was 2019 in the previous year. The details are given in Appendix 3.13
Mini Industrial Estates
3.24 The total number of Mini Industrial estates under DIC as on 31.3.2013 is 88 and the total number of SSI units are 753. (94 and 780 as on 31.03.2012). Out of which 659 units are working . The total number of employees under these units is 3153. The Income generated from these units is ` 2908.96 lakh. (2012 -Out of which 663 units were working. The total number of employees under the units were 3345. The Income generated from these units amounted to ` 11952.86 lakh during 2011-12. ) The details are given in Appendix 3.14.
Common Facility Service Centres
3.25 There are two Common Facility Service Centres at Changanassery and Manjeri under Directorate of Industries & Commerce. These CFSCs provide services like Quality Control testing as per National and International Standards, Design and fabrication of moulds, dies and machineries, Maintenance of costly machines used for rubber and plastic product manufacturing, Conducting EDPs and seminars on rubber and plastic based industries etc. Also they extend new technical information, advice on product diversification and assist research scholars and students for their Project works of in the field of Chemistry, Rubber Technology, Polymer Chemistry by utilising the facilities of the centres.
Entrepreneurship Development
.3.26 Entrepreneurship is a process of identifying and starting a business venture, sourcing and organizing the required resources and taking both the risks and rewards associated with the venture. In Kerala, entrepreneurship is restricted to trade, transport and tourism, all of which are low knowledge-intensive sectors. The labour scenario in Kerala is also very challenging for entrepreneurs. It is envisioned that Kerala will be a knowledge economy by 2030.
Bank Credit to SSI / MSME Sector
3.27 RBI issued a master circular with the enactment of MSMED Act 2006, to all Scheduled Commercial Banks stating that the Bank Loans to Micro and Small enterprises, both Manufacturing and Service are eligible to be classified under Priority Sector advance and provide direct Finance to Manufacturing Enterprises, Loans for food and agro processing, Service Enterprises, Export Credit, Khadi and Village Industries Sector (KVI) and Rehabilitation of sick Micro and Small Enterprises. Public sector banks have been advised to open at least one specialised MSME branches in each district for Lending to MSME Sector.
3.28 As per State Level Bankers’ Committee (SLBC), the highest body of bankers in the State, report, the outstanding bank credit to various sectors by the commercial banks in Kerala at the end of March 2013 was increased by 17 per cent ie. ` 175087 crore against ` 149293 crore in the previous year. The outstanding flow of credit to MSME sector was ` 23563 Crore which shows an increase of 14 per cent from ` 20593 crore in 2012-13. The status of flow of credit to various sectors is given in Appendix 3.15.
Small Industries Development Bank of India (SIDBI)
3.29 Small Industries Development Bank of India (SIDBI) is the principal financial institution for the promotion, financing and development of MSME industries. It also acts as the nodal agency for the scheme sponsored by Government of India in this regard.
Kerala Small Industries Development Corporation (SIDCO)
3.30 Kerala Small Industries Development Corporation was established for strengthening the Small Scale Sectors in the State by providing infrastructure facilities, distribution of scarce raw materials, marketing the products etc. Execution of construction works for Industries department and public sector undertakings is another activity of SIDCO and there are some manufacturing units under SIDCO. There are 17 major industrial estates and 877 units are working in these estates. These working units provides nearly 7239 employment opportunities as on 31.03.2013 which is about 1 per cent more than that of the previous year. Besides, there are 36 mini industrial estates under SIDCO as on 31.03.2013.About 604 employees are working in 285 working units all over the state. Details of SIDCO are given in Appendix 3.16, 3.17, 3.18 and 3.19.
Institutes for Skill Development and Training
Kerala Institute for Entrepreneurship Development (KIED)
3.31 Kerala Institute for Entrepreneurship Development (KIED) is a Public Sector Training Institute registered under The Travancore-Cochin Literary, Scientific and Charitable Societies Registration Act. The institute is aimed to create awareness, finding the factors for the poor entrepreneurship culture and sorting out the issues for the development of entrepreneurial culture in Kerala. KIED is a premier institute promoted by Government of Kerala and Government of India for promotion and development of entrepreneurial activities in the State.
3.32 The institute conducts various programmes for developing the spirit of entrepreneurship among the people such as Entrepreneurial Awareness Campaign, Seminars, Workshops, Research etc leading to more and more self employment thereby developing the people of Kerala as an enterprising society.
Kerala State Self Entrepreneur Development Mission (KSSEDM)
3.33 The Kerala State Self Entrepreneurship Development Mission aims at inculcating entrepreneurial confidence among the youth of the State through a process of selecting persons with aptitude and earnestness, training them meticulously and enabling them to avail of finance on easy terms from Banks/Financial Institutions. The youth will be given opportunities in the agriculture and IT sectors. In a Panchayat-level scheme aimed at educated unemployed youth, KSSEDM providing training and soft loans to 10 select entrepreneurs in each Panchayat up to ` 20 lakh to start an enterprise.
Indus Entrepreneurs (TiE)
3.34 The Kerala Chapter of the Indus Entrepreneurs (TiE), a global not-for-profit organization, was registered in March 12, 2003 for providing advice, guidance and assistance to budding entrepreneurs by successful & experienced entrepreneurs and professionals.
Kerala State Small Industries Association (KSSIA)
3.35 Kerala State Small Industries Association establishes fellowship and co-operation among Small scale industrialists to protect their interests, publish journals, facilitate exchange of information etc.
Industrial Cluster Development
3.36 Industrial clusters are increasingly recognised as an effective means of industrial development and promotion of small and medium-sized enterprises. For MSME participants, clusters play an important role in their inclusiveness, technology absorption, efficiency improvement and availability of common resources. The Ministry of Micro, Small and Medium Enterprises (MSMEs) adopted the cluster approach as a key strategy for enhancing the productivity and competitiveness as well as capacity building of small enterprises.
3.37 The major clusters in Kerala are Rubber cluster, Rice millers cluster, Furniture cluster, Plastic cluster, Plywood cluster, Terra Tile cluster, Wood cluster, Ethnic food processing cluster, General engineering cluster, Printers cluster, Natural Fibre & allied products cluster, Automobile cluster, and Note books cluster.
3.38 The Ministry of MSME, Government of India provides financial assistance for setting up of Common Facility Centers (CFC) in various clusters under MSE-CDP scheme. Government of India has sanctioned assistance for a total amount of ` 5492.25 lakh for setting up CFC in 7 clusters, (work is progressing on 4 of them) of which Government of India share is ` 3593.91 lakh, Government of Kerala share is ` 1084.00 lakh and balance is the share of consortium.
MSME Development Institute, Thrissur & Cluster Development in Kerala
3.39 MSME-Development Institute, Thrissur, Kerala (MSME-DI, Thrissur), is the field outfit of Development Commissioner(MSME) under the Ministry of MSME, Government of India to take care of the needs of MSME sector in the State of Kerala and the Union Territory of Lakshadweep in the area of Techno-economic and managerial consultancy services.
3.40 The institute has conducted 165 tailor made development training programme on Entrepreneurship Development, motivation campaigns, Business Skill Development, Entrepreneurship Skill Development, Management Development and Special Skill Development and several Educational Seminars and other awareness programmes during 2012-13. 6625 persons benefited through these programmes. and 188 units are benefited through service workshop. The institute has been providing technical consultancy to the units for acquiring ISO 9000/14000 scheme and also providing reimbursement to the extent of 75 per cent of the expenses incurred by the units under the scheme.
3.41 MSME-DI, Thrissur has taken up 13 clusters for development. The clusters which are in various stages of development are in the areas of Wood, Plywood, Furniture, Rubber, Terratile, Rice Mill, Plastic, Printers, Ethnic Food, Natural Fibres and General Engineering. Details are given in Appendix 3.20.
Kerala Bureau of Industrial Promotion (K-BIP)
3.42 Kerala Bureau of Industrial Promotion(K-BIP) is designated as the nodal agency of Ministry of MSME, GOI for the cluster development projects in the state. The programmes undertaken by K-Bip includes Industrial Cluster Development in association with Directorate of Industries and Commerce, Food Processing Certification (HACCP), Participation in National/International/Regional fairs on behalf of Industries Department, Govt.of Kerala.
Central Govt. Schemes & Programmes
Prime Minister’s Employment Generation Programme (PMEGP)
3.43 Government of India introduced PMEGP Scheme, ie, credit linked subsidy programme from 2008-09 by merging the two schemes viz,PMRY and REGP.The Khadi and Village Industries Commission (KVIC) was approved as the nodal agency for implementation of the scheme at national level. In Kerala, State KVIC Directorate, State Khadi and Village Industries Board(KVIB), District Industries Centres (DICs) and bankers are the agencies for implementation of the scheme. A target of 568 number of units were allocated to DICs and 2480 applications were received during the year 2012-13, 123% increment compared to 1112 during 2011-12. The banks sanctioned 1304 applications about 53% more than 851 in the previous year and provided Margin Money of `1513.44 lakh which is 30% more than ` 1162.13 lakh in 2011-12. Details are given in Appendix 3.21 and 3.22.
Micro & Small Enterprises-Cluster Development Programme (MSE-CDP)
3.44 The Micro & Small Enterprises-Cluster Development Programme of the Ministry of MSME, Government of India aims at enhancing the productivity and competitiveness as well as capacity building of Micro and Small Enterprises (MSEs) and their collectives in the country. The main objectives of the programme are to support the sustainability and growth of MSEs by addressing common issues, building capacity of MSEs and creating sufficient infrastructural facilities & common facility centres.
Industrial Infrastructure Upgradation Scheme (IIUS)
3.45 The central sector scheme Industrial Infrastructure Upgradation Scheme (IIUS) of Ministry of Commerce& Industry aims to enhance international competitiveness of the domestic industry by providing quality infrastructure through Public-Private Partnership approach in clusters/locations which have greater potential to become globally competitive. Priority will be given to develop clusters having small industry concentration.
Credit Guarantee Scheme
3.46 This scheme is implemented with the objective of facilitating flow of credit to the MSEs, particularly to Micro Enterprises.
Credit Linked Capital Subsidy Scheme for Micro and Small Enterprises (CLCSS) for MSEs
3.47 This scheme aims at facilitating technology upgradation of MSEs by providing 15 per cent capital subsidy for purchase of plant and machinery.
Food Processing - A major MSME sector
3.48 Food processing industry is a sunrise sector that has gained prominence over the recent years. As per Annual Survey on Industry results, in India, the contribution of food processing sector to GDP has been growing faster than that of the agriculture sector. Declared a priority sector, food processing has been allowed a 100 per cent FDI by the Government of India. In Kerala, it has the potential for sustainable and more inclusive growth, diversification, possibility of generating substantial employment and further advancement in respect of industrial development in urban and rural areas. The FPI in Kerala spreads over both organized as well as unorganized sectors. Spices, pickles and the marine products are the major food product export from Kerala. Two thirds of Kerala’s export income comes from processed food. Dairy products, Fish/Meat products, Rice & wheat products, Ready to eat/ Ready to cook products and bakery products, masala powder, Coconut & other oils, Ayurvedic medicines, Fruit juices etc. are the major food items produced in the State.
3.49 Kerala Industrial Infrastructure Development Corporation (KINFRA) has set up exclusive Food Processing Parks to suit the specific needs of the food processing sector and they offer space for food processing units in their Industrial parks also. Out of these Mazhuvannur (Ernakulam) and Kakkancherry (Malappuram) food processing parks are having the highest number of units. KINFRA provides 4114 sq.ft space for 132 food Processing Units with an investment of ` 26979 lakh.
3.50 The National Centre for Hazard Analysis Critical Control Point (HACCP) Certification in association with K-BIP has initiated the process of auditing and certification of 41 food processing and allied units from the State and outside the State. Out of this, NCHC has successfully audited and certified 25 food processing units and the remaining is under progress. Surveillance audits are being conducted at regular intervals.
Box 3.5
State Food Processing Mission, Kerala
The Government of Kerala has nominated KINFRA as the Nodal Agency for State Food Processing Mission in Kerala for implementation of centrally sponsored scheme “National Mission on Food Processing” under Ministry of Food Processing Industries, Govt. of India. Setting up of new food processing units, modernization/expansion of existing ones, development of cold chain infrastructure, human resource development for food processing sector, proper infrastructure for abattoirs/meat shops, development of primary processing centres and collection centres in rural areas for assisting farmers, promotional activities etc are the thrust areas covered under State Food Processing Mission. The Mission has sanctioned ` 3.72 crore in 2012-13 and ` 2.00 crore till November in 2013-14 under various schemes. KINFRA is also the Nodal Agency for Ministry of Food Processing Industries, Govt. of India.
General Promotional Activities and Exhibitions
3.51 The Directorate of Industries and Commerce conducted/participated in 31 Exhibitions /Fairs /Expos inside Kerala with 1125 stalls in 2012-13 and generated an income of ` 13.04 Crore. The DIC represented Kerala in 8 national/international Exhibitions/ Fairs/ Expos outside Kerala with 17 stalls. Details are given in Appendix 3.23.
3.52 Government of Kerala has organised several Promotional Activities/ programmes and expos in co-ordination with Directorate of Industries & Commerce and other departments as follows:
Industry Institution Linkage Expo (Illuminate 2012), an Industry Institution Linkage Expo at Manjeri, Malappuram from April 2 to 4, 2012.
• Emerging Kerala 2012, at Hotel Le Meridian, Ernakulam from September 12 to 14, 2012.
• Kerala Bamboo Fest 2012, 9th edition at Jawaharlal Nehru Stadium Ground, Kaloor, Kochi from December 6 to 9, 2012.
• Nilambur Handicrafts Skill Development Fair 2013, concurrent to Pattulsav Tourism Festival at Nilambur from January 8 to 18, 2013.
• Kerala Agri Food Pro Meet 2013, at Jawaharlal Nehru Stadium Ground, Kaloor, Kochi from February 17 to 19, 2013
• Educational Industry Institution Linkage Expo (Illuminate 2013), at Malappuram from April 19 to May 1, 2013.
Fig 3.6
Result of Exhibition & Fairs conducted by Department of
Industries & Commerce inside the State

Outlook - MSME Sector
3.53 Lack of space, poor quality infrastructure and lack of sufficient entrepreneurial spirit are the main constraints in Micro, Small and medium scale industrial development in the state. Hence State should concentrate on design oriented and value based industries by clearly assessing the latest market trends and finding ways to collect adequate raw material
.
3.54 In a densely populated state like Kerala, multi-storied industrial galas/ parks built, where required are ideal. Land pooling techniques can be used on uncultivable / unused land identified at district level for this purpose and the cost of Government land should be rationalized.
3.55 The labour productivity and output per unit of capital in Kerala has always been less than the national average. Also the labour scenario under active trade unions in Kerala is very challenging for entrepreneurs. To improve entrepreneurial spirit among people, awareness programmes based on specific, innovative studies in small industries, diversity of products, technical know-how and value addition should be promoted. Financial Assistance to new worthy entrepreneurs for preparing good project reports, gaining technical know how and for maintenance of imported machines in the industrial units should be ensured.
3.56 Industrial effluent is a big issue. The focus would continue to be pollution free, power saving, Green and Eco-Friendly light manufacturing / traditional industries, with ethical and fair labour standards.
3.57 The traditional sector should be enhanced by producing value added, innovation driven, design oriented, socially and environmentally sustainable products like hand worked fabrics as these are a market niche, a small market segment in which the product features aimed at satisfying specific market needs, as well as the price range, production quality and the demographics that is intended to impact. The skill development programmes, cluster development, enhanced wage rates and trained private players for better profit making management could attract the young generation. Thus the structure of industry should be shifted from resource driven to efficiency driven in long run. It is important to assess actually how much people get benefitted from the traditional sector.
Traditional Industries
Textile Industry
3.58 Kerala’s textile industry comprises of traditional handloom sector, powerloom sector, weaving and spinning sector.
Handloom Sector
3.59 The Handloom Sector in Kerala stands second to the coir sector in providing employment among the traditional industries of the State. The Handloom Industry in the State is mainly concentrated in Thiruvananthapuram and Kannur District and in some parts of Kozhikode, Palakkad, Thrissur, Ernakulam, Kollam and Kasaragod Districts. The Industry is dominated by the Co-operative sector, covering 94 per cent of total looms. The remaining 6 per cent of Handlooms units are owned by Industrial entrepreneurs. The Co-operative sector consists of factory type and cottage type societies. There were 664 registered Primary Handloom Weavers Co-operative Societies in the State as on November, 2013, indicating a 12 per cent increase from March 2012. Of the 664 registered Primary Handloom Weavers Co-operative Societies, 153 are factory type and 511 are Cottage type societies. Of these 664 societies, 431 are in working condition as in November 2013. Details are given in Appendix 3.24.
3.60 The major varieties of products produced in the handloom sector of the State are dhothis, furnishing material, bed sheets, shirting, saree and lungi. These items contribute about 67 per cent of the total production of handlooms sector. About 80 per cent of the major items are produced in the southern region followed by Northern region (12 per cent) and Central region (6 per cent). Of the total production, nearly 95 per cent is contributed by the co-operative sector.
Box 3.6
Traditional Industries in Approach Paper to Twelfth Five Year Plan (2012-17) - Kerala
• Efforts of the Government shall be towards revamping the sector and making them sustainable.
• Thrust areas identified are enhancing export earnings, technology upgradation, product diversification / value addition, market promotion and skill development.
Box 3.7
Major schemes introduced in Annual Plan 2012-13
1) Self Employment under Handloom Sector
The aim is to attract new generation entrepreneurs by providing training, marketing support and margin money to set up units.
2) Weavers / allied workers motivation programme
The scheme aims to motivate weavers / allied workers to enhance production by providing attractive incentives.
3) Establishment of Handloom Village and Integrated Handloom Village
The aim is to provide assistance to build infrastructure for establishing Handloom Villages and Integrated Handloom Villages in the state to showcase the rich old craftsmanship, evolution of the industry, and the processes/ activities involved in making handloom products.
Government Assistance extended for the development of handloom industry, by way of loan and grant in the 12th Plan and 2012-13 is shown in Appendix 3.25.
3.61 The total value of production shows an increase of 10 per cent from 202.14 crores in 2011-12 to 222.87 crores in 2012-13. The total number of weavers employed has increased from 49930 in 2011-12 to 50433 in 2012-13. The number of women employed is also increased from 20784 in 2011-12 to 21434 in 2012-13. The total number of employment generated has increased from 90.32 lakh man days in 2011-12 to 105.86 lakh man days in 2012-13. Details are given in Appendix 3.26 and in Fig 3.7.
3.62 The membership in Kerala Handloom Workers Welfare Fund Board is 32297. As per the Handloom Census of India 2009-10, (Ministry of Textiles, Govt of India) there are around 12,000 Handloom Households in Kerala. Assuming an average of two active weavers per family, the total number of weavers in the state would be about 24000. As per the report of the Survey on Handloom Sector in Kerala 2009, there were 469 societies in Kerala. The total membership in these societies was 65964, of which only 57,405 (87%) were active in the industry. Hence there existed an ambiguity regarding the size of employment in the sector. To solve the issue, a new scheme ‘Detailed Survey on Handloom Industry in Kerala’ has been initiated in Annual Plan 2013-14.
Fig 3.7
Production and Employment in Handloom sector

Promotional measures of handloom sector
3.63 Promotional measures of handloom sector such as procurement, sales and marketing of handloom fabrics are being undertaken by two state level organisations namely Hantex and Hanveev.
3.64 Hantex is the apex society of handloom co-operative societies in the state. Number of PHWCS registered under Hantex is 504. Despite grants and loans being given to the society, the organisation is running at a loss as per the balance sheet of the year 2012-13. The working results of Hantex are given in Appendix 3.27.
3.65 Hanveev is a PSU setup to assist handloom weavers outside the co-operative fold by providing necessary raw materials at reasonable price and making arrangements for marketing their products. This organisation is also running in losses. The working results of Hanveev are given in Appendix 3.28 & 3.29. Hanveev conducted 30 exhibitions during 2012-13 and the sales turnover was `1646.29 lakh.
Box 3.8
Issues in the Handloom sector – As identified by the 12th Plan Working Group Report on MSME and Traditional Industries (Kerala)
1. Low productivity due to lack of technology intervention & poor market segmentation
2. Competition from cheap power loom fabrics and dumping of cheap fabric from outside state.
3. Lack of emphasis on quality and innovative designs of handloom products in market.
4. Lack of product diversification in accordance with new trends.
5. Difficulty in getting workers due to low wages & difficulty to avail credit facility.
6. Lack of working capital and fluctuation in hank yarn price.
7. Weak performance of apex societies and organizations.
Textile Sector – Spinning Mills
3.66 The Textile Industry in Kerala is spread over in public sector as well as in Co-operative Sector and there exists 13 Spinning Mills jointly in the public/ co-operative sector.
3.67 Kerala State Co-operative Textile Federation (TEXFED) has 7 Co-operative Spinning Mills as members. Five of them are administered by the Government and two have elected boards. Spinning Industry in Kerala is facing deep crisis due to high cost of inputs, competition from power loom sector and loss of market share. The Mills in Co-operative Sector slipped into the huge accumulated losses amounting to ` 132.52 crore. From 2006 onwards the Government has placed great emphasis on the day to day activities of these mills. Efforts are on to bring a turnaround towards profitability and imbibing financial discipline.
3.68 An amount of about ` 43 crore have already been provided to these mills in the Eleventh Five Year Plan Period, including the NCDC approved revival packages of Malappuram and Cannanore Co-operative Spinning Mills. The 4 spinning mills under KSTC show a declining trend in production. The first phase modernisation of Malappuram and Cannore Co-operative Spinning Mills have been completed and second phase modernisation has started.
3.69 The Co-operative Spinning Mills in the State were formed with a social objective to provide raw material support to the traditional handloom weavers of the state. This support has been stopped in 1999. Instead an integrated approach for the industry has been put in place with establishment of three hank yarn production centres by the Government at Cannanore, Alleppey and Trichur Co-operative Spinning Mills to provide raw material support to the weavers.
Issues of the spinning sector
3.70 The main handicaps faced by the Mills were the lack of working capital and non availability of raw materials. The Government has put in place a centralised purchase system to procure cotton for the entire textile sector through professionally constituted committee comprising of RIAB, TEXFED and KSTC. The sale of yarn through the depot is also monitored by the committee. Consequently raw material cost has come down heavily, sufficient savings are being generated due to which revenue and turnover has improved.
3.71 Majority of textile spinning mills in the State are over 25 years old and are obsolescent. Even though partial modernization has been done in certain units, it was not at par with the industry standards.
Power loom
3.72 In the power loom sector there are 21 working co-operative societies. Out of the 963 powerlooms in the State, 68 per cent are in the co-operative sector and the rest in the private sector. Comparing the figures for 2011-12 and 2012-13 it is noted that the production of cloth and the value of production has declined in the case of Co-op Sector, and increased in the case of the rest. Details are given in Appendix 3.30.
3.73 The five integrated power loom co-operative societies in the state at Calicut, Wayanad, Neyyattinkara, Kottayam and Malappuram have been accelerated by providing budgetary support.
3.74 The Calicut Integrated Power loom Co-operative Society Ltd., has been converted as a textile park comprising all the segments of a composite mill, with semi automatic and automatic powerlooms together. A modern processing unit to process yarn for both handloom and power loom with modern facilities and a garment making unit with state of art technology and professionally trained manpower is also functioning in this project.
3.75 In Wayanad, the remotest district in Kerala which is lacking industrial initiatives, rehabilitation cum industrial project is functioning. As part of it, a powerloom production centre has started in Thirunelli for tribal women folk for providing training. This will be converted as an employment generating centre in Powerloom & Handloom for adivasi women. Integrated Power loom Co-operative Societies in Neyyattinkara and Kottayam has also been activated and are in the process of production of grey cloth and some conversion orders for export market. The sizing unit functioning at Kottayam is activated as a common facility centre for all the integrated power loom Co-operative societies in the state.
Handicrafts
3.76 Handicraft industry is one of the traditional industries of Kerala, providing employment to Artisans. Eighty per cent of these artisans are from socially and economically backward classes. Kerala has the tradition of making beautiful handicrafts with ivory, bamboo, palm leaves, seashells, wood, coconut shells, clay, cloth, coir, metals, stone, lacquer ware and so on. Many old handicraft classics can be seen in Palaces, old heritage homes and museums in the State.
Importance of Handicraft Industry
3.77 Kerala State Handicrafts Apex Co-operative Society (SURABHI), Handicrafts Development Corporation and Artisans Development Corporation are the major promotional agencies in the handicraft industry. SURABHI is the apex organization of primary handicrafts co-operatives established with a view to uplift the artisans by marketing the product produced by the primary co-operatives and implementing welfare schemes with the assistance from State and Central Governments.
3.78 Handicrafts Development Corporation of Kerala is engaged in procuring and marketing handicraft products by giving fair returns to artisans through SMSE Institute and Kairali emporia spread all over India. At present it is having a net work of 19 such sales emporia. HDCK also owns a Common Facility Service Centre (CFSC) at Thiruvananthapuram where lot of artisans are provided with the facilities for the development of crafts. The Kerala Artisans Development Corporation (KADCO) is one of the State agencies to provide assistance to artisans for establishing production units, promoting marketing of products and providing employment opportunities through schemes of trade fairs and marketing centres.
Bamboo Industry
3.79 The importance of Bamboo as an Eco-friendly raw material capable of meeting multifarious needs of the people at large is gaining global acceptance. From a raw material known as the “ poor man’s timber” bamboo is currently being elevated to the status of “the timber of the 21st century”. A unique feature of the Kerala bamboo scene is that 67.3 % of the extracted bamboo comes from home gardens rather than from the forests.
3.80 The Kerala State Bamboo Corporation Ltd. was established in 1971 in Kerala to develop and promote industries based on Bamboo, reed, cane and rattan. Kerala State Bamboo Corporation’s main activity is collection of good quality reeds from Government forests and distributing these reeds to the registered mat weavers of the Corporation, throughout the State of Kerala, on credit basis and procuring woven mats made of these reeds at reasonable prices, thus providing employment and regular means of livelihood to these weaver sections of the society. Bamboo mats, Bamboo ply, Flattened board, Flooring tiles are the main products.
Box 3.9
Handicrafts Sector in Annual Plan 2012-13& 2013-14
Major Objectives
Share Capital Contribution to Handicrafts Primary Co-operative Societies
To provide Share Capital Contribution to Handicrafts Primary Co-operative Societies for strengthening their equity base. The scheme helps to acquire additional assets which will create more employment and quantify the production.
Assistance to Apex Organizations in Handicrafts Sector
For extending assistance based on definite projects to the following Apex organizations in the Sector.
Entrepreneur Assistance Scheme in Handicrafts/Artisans Sector
To provide term loan to those beneficiaries not belonging to backward classes or minorities, but who are below poverty line and are artisans, on the same terms and conditions as given by NBCFDC and NMFDC.
Establishment of Common Facility Service Centers for Handicrafts
For giving training in handicrafts, quality testing, machine based job works, dyeing, polishing and printing works, modernisation of handicrafts units, development and promotion of new designs and establishment of CFSCs.
Development of Bamboo related Industries
For conducting skill upgradation training programmes for artisans and craftsmen in making diversified and value added products of bamboo, for increasing the sales of bamboo products by promotional activities inside the State like participation in regional and state exhibitions, Organize ‘Kerala Bamboo Fest’, Promoting Art & Designs, etc.
An amount of ` 370.00 lakh was provided in the Annual Budget 2012-13 for the implementation of the above said schemes in the sector through the apex bodies SURABHI, HDCK, KADCO, KSBC and Bamboo Mission.
Plan Outlay and Expenditure in this sector for last two years
(` in Lakhs)
Annual Plan 2012-13 |
Annual Plan 2013-14 |
||
Outlay |
Expenditure |
Outlay |
Expenditure |
350.00 |
348.25 |
431.00 |
50.00* |
*Up to November. Expenditure is likely to pick up in the last quarter of 2013-14.
Achievements
SURABHI conducted 6 exhibitions participating hundreds of artisans and carried out sales through its 16 showrooms inside & outside Kerala. The turnover of the society during the year 2012-13 was ` 293.50 lakh. During 2013-14 the society conducted 5 exhibitions and the total turnover is `143 lakh.
KADCO conducted 4 Grihastha training programmes for about 400 female handicraft workers and provided loan to 98 artisans under NBCFDC loan scheme. Through Service & Supply scheme which is benefited to more than 100 units and above 3000 artisans, KADCO made a turnover of `13.29 Crore and a profit of ` 22.53 lakh in the year 2012-13.
Khadi and Village Industries
3.81 Khadi & Village Industries play a substantial role in generating employment in rural areas with minimum investment. These industries use eco-friendly, local resources and generate higher employment opportunities. “The Kerala Khadi and Village Industries Board is a statutory body constituted by the Act IX of 1957 Legislative Assembly. It is vested with the responsibility of organizing, developing and promoting Khadi and Village Industries in the State. Co-operative Societies, registered institutions and departmental units carry out activities of the Board by availing financial assistance from State Government, Khadi Commission and Nationalised Banks. The Board has achieved 100 per cent financial targets in 2012 and 2013.
Activities during the year 2012-13
3.82 The State Government had provided and released a sum of ` 1185 lakh under plan during the year 2012-13. In addition to this, an amount of ` 96 lakh has been received from State Government towards Modernisation of Khadi Sector under re-appropriation and ` 2000 lakh has been received from the State Government towards Income Support Scheme. The Board had also received ` 2094.84 lakh under Non-Plan Administrative Expenses. An amount of ` 550 lakh has been received towards Special Rebate on retail sale of Khadi throughout the year and a sum of ` 600 lakh has been received towards Special Rebate on retail sale of Khadi on Festival Seasons (for 108 days) under Non-Plan during the year 2012-13. The Khadi and Village Industries Commission had released an amount of ` 829.86 lakh (ie ` 824.76 lakh as Margin Money Grant and ` 5.10 lakh for Publicity) to the Board under Prime Minister’s Employment Generation Programme (PMEGP)
Box 3.10
Performance of Khadi Sector during 2012 and 2013
Under Prime Ministers Employment Generation Programme (PMEGP)
An amount of ` 829.86 lakh was disbursed as margin money grant for 374 projects. This generated 335 jobs under Special Employment Generation programmes, 2365 units were set up with total cost of `2665 lakh and an amount of ` 200 lakh was given as a subsidy (District wise achievement are shown in Appendix 3.31).
Goods worth ` 29052.18 lakh were produced and goods for 33830.96 lakh were sold by providing employment of 248528 persons. (Details of value of production, sales, employment, and wages paid are given in Appendix 3.32).
Under the Expansion and modernisation of sliver project of Ettukudukka in Kannur, a new carding machine and a simplex machine have been purchased and installed.
Board conducted Onam Mela to propagate Khadi.
Goods worth ` 3464-19 lakh has been sold through 216 sales outlets of Khadi & Village Industries. (District wise details are shown in Appendix 3.33) .
An amount of ` 20 crore has been received from Government under Income Support Scheme and disbursed to 11,193 Artisans in the Khadi Sector.
Goods worth ` 560.48 crore has been produced through the aided units of the Board and provided employment to 1,60,202 person.
Box 3.11
Major Schemes in the Khadi sector 2013-14
Scheme |
Outlay (`in lakh) |
1. Establishment and strengthening of Departmental Khadi production Centres |
335 |
2. Production / Festival Incentive to Khadi Spinners and Weavers. Establishment of new Khadi sales outlets, Modernisation & Computerization of existing sales outlets and Godowns to Khadi Board |
241.55 |
3. Special Employment Generation Programme |
450 |
3.83 The strategy for achieving growth during the 12th plan is to develop product –wise clusters of Khadi and Village Industries products and to develop their domestic as well as export market. Other strategies include introducing innovations in design and technology, creation of entrepreneurship and growth in manufacturing in rural non-farm sector to prevent migration by enhanced allocation for Prime Ministers Employment Generation programme.
Coir Industry
3.84 Coir Industry is a major traditional industry in Kerala in terms of the employment generation and foreign exchange it earns. It provides livelihood to nearly 3.75 lakh people. Government has given more emphasis on Coir Industry by considering the social features and problems faced by it. Kerala accounts for about 85% of the total production of coir in the country. The availability of coconut husks, the basic raw material, the natural retting facilities present in the lakes, lagoons and backwaters of Kerala and the traditional expertise of the people of the state were the reasons for the concentration and growth of the industry in the state, especially in the coastal area. The Coir Industry is classified into four sectors viz: Retting and Fibre Extraction Sector, Spinning Sector, Manufacturing Sector and Export Sector.
Major Institutions in Coir Sector
1) Foam Mattings (India) Limited
3.85 In FOMIL the accent is on technology, infrastructure and machinery, which are visible from its quality products. Great care is taken to maintain the world class standards of FOMIL production facilities. The latex backing plant, which were imported from Denmark, is one of its kinds in India. It has a capacity to latex back up to 3.3 million sq.m. of matting 4 metre width, per annum on three shift basis.. Company is providing employment to 163 persons. Sales turnover to FOMIL during 2012 -13 is ` 622.38 lakh.
2) Coirfed
3.86 The Kerala State Co-operative Coir Marketing Federation Ltd. 679 (Coirfed) is the apex federation of primary coir co-operative societies spread all over Kerala. The main objective of the federation is the procurement of the entire product of the member societies and marketing the same through its sales outlet throughout the country and thereby providing fair wages and subsistence to the poor coir workers of Kerala. At present Coirfed has two factories engaged in the manufactures of value added products – One producing rubberized coir products and the other rubber backed coir mats.
Coirfed has 4 Defibering Units.
3) Kerala State Coir Corporation
3.87 The Kerala State Coir Corporation Limited was established in 1969 to cater the needs of the Small Scale Coir Manufacturer by providing them manufacturing and marketing opportunities. It has three production units in Kerala Establishment of one more unit in Adoor, is in progress. Kerala State Coir Corporation has vast infrastructure in terms of land and buildings. However the productivity of employees, material and money is not high enough to compete with private entrepreneurs. The cost of production is the main component which needs to be brought down. To make the product of Coir Corporation competitive in market, the assistance of technically and professionally competent personnel is needed in every department. The compensation /salary package offered is not found lucrative to attract the best hands to this industry.
3.88 Kerala State Coir Corporation is implementing in Purchase Price Stablization Scheme (PPSS) in Coir Sector. Under the scheme the Kerala State Coir Corporation will directly procure coir products from Small Scale Producers. Mats & Mattings Co-operatives and alike there by avoiding middle men. Details of export by Coir public sector undertaking /Coirfed is in Appendix 3.34.
4) National Coir Research & Management Institute
3.89 The National Coir Research & Management Institute, strengthen the Research & Development activities of Coir Sector to enable the industry to produce more value added and new design products at a reasonable, but competitive price. The National Coir Research & Management Institute has developed a Mini Defibering machine capable of defibering 3000-4000 husk per day. These machines supplied to coir co-operative societies on 100% subsidy and private sector, at 50% subsidy and 60 per cent on SHG. Around 198 Defibering machines were supplied on demand.
Major development activities
Major development activities in the sector during the period of report are as follows:-
(a) The Coir Development Department has organized “Coir Kerala 2013” an international event on coir and natural fibre products at Alappuzha. This fair witnessed participation of buyers from 52 countries apart from those within India
b) Debt Relief Schemes for Co-operative Sector / Entrepreneurs
Government of Kerala implemented a scheme to provide one time assistance as debt relief to coir co-operatives/Entrepreneur’s in the coir sector for the settlement of loan availed to set up coir industry. The Government support is to nullify loan arrears subject to certain limits. During the year 2012-13, an amount of र 1,30,000/- has been sanctioned to 2 societies and र 12,57,047/- to 60 small scale producers under the scheme.
c) Working Capital Assistance to Coir Co-operative
The major issue of the Coir Co-operatives is shortage of working capital. In order to overcome the hurdle the Government of Kerala has released an amount of र 8,96,92,648/- to 440 Coir Co-operative Societies as working capital assistance during 2012-13. (Details of Coir Co-operative societies in Kerala in Appendix 3.35 and Activities of coir Co-operative societies in Appendix 3.36)
d) Husk Collection Scheme
The major hurdle in the coir sector is the shortage of sufficient quantity of husk and also poor mechanism to collect the husk. Government of Kerala has launched a scheme of husk collection. Under the scheme, the activity of collecting husk is done through Coir Co-operative Societies and Consortia. The husk collection scheme was modified and under the modified scheme revolving fund to the tune of र 1,00,000/- can be sanctioned to societies engaging in the collection of husk for their use. And the worker, who collects the husk will be given a financial assistance as incentive. Under the scheme 3,73,28,380 Nos. of husk has been collected during 2012-13.
e) Cluster Development Programme
An amount of र 46,89,950/- is released to 4 societies, Coirfed and Kerala State Coir Corporation during 2012-13, under the scheme.
f) Production and Marketing Incentive
An amount of र 300 lakh has been sanctioned and released to 278 societies under the scheme during the period 2012-13.
g) Marketing Development Assistance:-
An amount of र 8 crore has been released as follows during the period of report in Table
Table 3.2
Market Development Assistance
| Coir Societies | र 4453690/- |
Kerala State Coir Corporation |
र 49789030/- |
Foam Mattings (India) Ltd |
र 2360938/- |
Coirfed |
र 23396342 |
h) Income Support Scheme
Government of Kerala introduced a scheme ensuring at least र 210/- as wages per day for the works in the yarn sector providing a portion of the wage directly for the year 2012-13. Under the scheme the enhanced portion of wage will be released direct to the bank account of the coir workers, by utilizing Government fund. The wage increased to ` 260/- from 01.05.2013 onwards.
i) Pension to Coir Workers
A total amount of ` 3,200 lakh has been released as pensions to 60,000 coir workers during the period under report.
Box 3.12
Major Schemes in the Coir Sector 2013-14
Schemes |
Objective |
Allocation ( र in lakhs) |
| Regulated Mechanization of Coir Industry | Modernisation of Coir Industry and enhancement of production |
6858.85 |
| Marketing and publicity | Organising trade fairs at State National and International |
950.00 |
| Price Fluctuation Fund | Stablilzation of price of coir fibre yarn and coir products |
1500.00 |
| Coir Geo Textiles Development Programme | Implementing pilot projects inclusion of Geo textiles as a standard Engineering material |
30.00 |
| Cluster Development Programme | Formation of clusters as per direction from Government |
250.00 |
Box 3.13
Challenges and Remedial Measures in Coir Sector
CHALLENGES IN COIR INDUSTRY |
REMEDIAL MEASURES REQUIRED |
Husk Procurement not achieved as desired, Frequent hike in price of Fibre in neighbouring States
|
Strengthening of Husk collection and Fibre Production
|
Health and environment issues in traditional method in retting and husk beating Low Productivity |
Mechanisation in Fibre Extraction, spinning and weaving sector |
Competition from synthetic and other cheaper substitutes |
Diversification in Coir production Focus on Coir Geo-textiles |
Lack of professional management system |
Skill and Technology Development for coir workers Modernisation and Technology up gradation in spinning and product development |
Migration of workers to construction and other areas |
Introducing home concept in spinning sector Strengthening Cluster based activities in Coir Sector from clusters Strengthening support institutions and R & D Providing financial assistance to purchase land for selected societies, Revival of dormant Coir Co-operative |
Cashew Industry
3.90 India is the largest producer, processor, exporter, and the second largest consumer of cashew in the world which is an important commercial horticulture crop. India’s processing capacity of cashew far exceeds its production of raw nuts, with only half of the cashews processed in the country being produced domestically. The industry is highly dependent on imported raw-materials for value addition and the export marketing is highly competitive which is the most unfortunate situation. One of the key factors in favour of expanding the cashew industry in India is the stable price in the International market when compared to other nuts.
Importance of Cashew industry
3.91 The Cashew Industry in Kerala is a Traditional Industry mainly concentrated in Kollam District and is mainly controlled by private sector. The industry has a long history of employing large numbers of workers in decentralised units. The industry is highly labour intensive which employs more than 3, 00,000 workers, barely literate and majority of them are women. The skills of these workers do not include any entrepreneurial capacities and Cashew processing is a highly labour-intensive activity which includes grading and packaging of finished products. Export of Cashew & Foreign exchange earnings are given under Trade in Chapter 6.
3.92 The Kerala State Cashew Development Corporation (KSCDC) and Kerala State Cashew Workers Apex Co-operative Society (CAPEX) are the two agencies of the State engaged in cashew processing sector in Kerala. CAPEX with headquarters in Kollam, is the apex body of cashew workers primary societies engaged in the procurement of raw cashew nuts and marketing the processed kernels. The Society owns 10 factories. There are about 6300 workers. The performance of CAPEX by the last 5 years is given in Appendix 3.37. The Kerala State Cashew Development Corporation (KSCDC) has 30 factories with about 18000 workers. The Corporation processes raw cashew nuts and produces value added products. The Corporation could provide employment for 202 days in 2012-13. The performance of KSCDC by the last 5 years is given in Appendix 3.38.
Kerala State Agency for the Expansion of Cashew Cultivation (KSACC)
3.93 Kerala State Agency for the Expansion of Cashew Cultivation (KSACC) was constituted by Government of Kerala to overcome the crisis of diminishing trend in shortfall of area under cashew cultivation in the State. Since 2008, KSACC has been organizing promotional activities in cashew cultivation and distributing cashew grafts of high yielding varieties and financial assistance to farmers and institutions in the State. KSACC is the nodal agency for the Cashew cultivation activities in Kerala, approved by NHM (National Horticulture Mission). The area, production and productivity of cashew in Kerala shows a sharp increase during 2011-12 when compared to previous years.
3.94 An additional 19000 ha has been brought under the canopy of the project and implemented by the KSACC during the period 2008-09 to 2012-13. In spite of all these promotional boost, the area under cashew diminished further to 43848 ha and production to 35000 MT. involving more than 100000 farmers and a good number of institutions. Assistance was also given for establishing apple processing units.
Cashew Export Promotion Council of India (CEPCI)
3.95 The Cashew Export Promotion Council of India (CEPCI), a non-profit making company, was established at Kollam, Kerala with the object of promoting exports of cashew kernels and cashew nut shell liquid from India. The council operates plan schemes for GOI, and offers various services to its member exporters. The council has set up a Laboratory and Technical Division of international standards which is recognised as an approved Research Centre for Doctoral research by Kannur University and University of Kerala. The service of CEPC Lab is available to cashew industry as well as entire food processing industry in India and abroad. The lab analysed 4373 samples during 2012-13 and 69 trainees underwent the training Programmes conducted by the lab.
Box 3.14
Cashew Sector in Annual Plan -2012-13 & 2013-14
Major Initiatives and Objectives
1. Cultivation of Organic Cashew and Establishment of a Raw-nut Bank
For the establishment of cashew gardens and organic cashew cultivation in the available land and also to establish a Raw nut Bank to ensure steady supply of nuts for processing and promotion of the cultivation of organic cashew nuts.
An amount of ` 410.00 lakh was provided in the Annual Budget 2012-13.
2. Modernisation of Cashew Sector Including Brand Building
New scheme proposed in the Annual Plan 2012-13 incorporating the existing schemes Rejuvenation of cashew Industry, Upgradation of Facilities and Modernisation of Cashew factories, Modernisation of Cashew Factory Sheds, Expansion of Domestic market for cashew/Market Development & International Brand Building for cashews. The objectives were upgradation and modernization of cashew factories, construction and renovation of Godown sheds and factory sheds, upgradation of procurement centres and international brand building of cashews.
An amount of ` 6090.00 lakh was provided in the Annual Budget 2012-13, of which `3790.00 lakh is for KSCDC and ` 2300.00 lakh is for CAPEX.
Major Initiatives of Annual Plan 2013-14
Modernisation and Partial Mechanisation of Cashew Factories and Brand building
The main objectives of the scheme were to enhance the production output and productivity of the factories of Kerala State Cashew Development Corporation Ltd. And CAPEX by introducing partial mechanisation in the production process by installing Shelling, Peeling and Grading machinery which runs in parallel with workers and to achieve maximum capacity utilization in addition to the modernization and upgradation of infrastructure facilities of factories and brand building in Kerala, India and in international markets. ` 4170.00 lakh to KSCDC and ` 2530.00 lakh to CAPEX were provided.
Plan Outlay and Expenditure in this sector for last two years
(` In Lakhs)
Annual Plan 2012-13 |
Annual Plan 2013-14 |
||
Outlay |
Expenditure |
Outlay |
Expenditure |
6500.00 |
6121.95 |
7150.00 |
326.63* |
*Up to November. Expenditure is likely to pick up in the last quarter of 2013-14.
Achievements
• During the period, Modernization of Cashew factories were done in all levels.
• Value added products were produced through Value addition units.
• Continuous Employment was given to workers of KSCDC & CAPEX with good ESI facilities and other benefits.
• Established branded products in domestic and international markets.
• The Area of production of cashew enhanced to 43848 ha and rate of growth of production of raw nuts and the productivity per hectare were improved
Central Govt. Schemes & Programmes with their achievement
Market Development Assistance for MSME exporters (MSME – MDA)
3.96 The scheme encourage Small & Micro exporters in tapping and developing overseas markets, increase participation of representatives of small/ micro manufacturing enterprises under MSME at International Trade Fairs/ Exhibitions and enhance export from the small/ micro manufacturing enterprises. During 2012-13, MDA Grant reimbursed from exporters under this scheme was ` 18.80 lakh and Grant-In-Aid disbursed is ` 500 lakh, through CEPC. In 2013-14 disbursed Grant-In-Aid is `1000 lakh.
Promotional Events
3.97 ‘Cashewotsavam’ a meeting of all stakeholders of cashew in the country along with Cashew Machinery Expo was organised by CEPC in September 2012. Other than this, the Council participates in 3 International Exhibitions, 2 trade delegations, 3 international conferences and organised 2 BSMs abroad.
Outlook for Cashew Industry
3.98 Sustained availability of quality raw cashew nuts should be ensured to meet the requirement of the industry through increased domestic production by enhancing the area, production and productivity of cashew, by adopting high-end technology, promoting organic farming and by empowering women through formation of Self Help Groups (SHG) for processing and value- addition.
Industrial Financing
(A) Kerala Financial Corporation
3.99 Kerala Financial Corporation (KFC), provides long term finance, primarily to Micro, Small and Medium Enterprises (MSME), both in manufacturing and service sectors. Government of Kerala is the major shareholder with more than 97 per cent and the balance is held by SIDBI, LIC, SBT and others.
3.100 Kerala Financial Corporation has achieved substantial growth in terms of sanction, disbursement and recovery of financial assistance with the operational profit making a significant leap crossing the ` 100 crore mark for the first time in the history of the Corporation. KFC has emerged as the best performing public sector undertaking in Kerala. It also ranks No. 1 amongst all State Financial Corporations in the country in terms of profitability and low level of non productive assets (NPAs). The Corporation earned the highest ever profit of ` 66.83 crore during the FY 2012-13. The Non-Performing Assets are at the lowest level.
3.101 The Corporation sanctioned financial assistance of ` 625.82 crore during 2012-13 (16.3% growth over previous year). An amount of ` 475.91 crore was disbursed to various industrial units during 2012-13 (2% increase over previous year). Performance of working of KFC during the last five years is given in Appendix 3.39. The details of loan operations and industry-wise classification of loan during 2012-13 of KFC are shown in Appendix 3.40 and Appendix 3.41.
B) Kerala State Industrial Development Corporation (KSIDC)
3.102 Kerala State Industrial Development Corporation Ltd. (KSIDC) has the main objective of promoting, stimulating, financing and facilitating the development of large and medium scale industries in Kerala.
3.103 KSIDC has sanctioned projects involving a capital investment of ` 2172 crores with direct term loan assistance of ` 54 crores in the financial year 2012-13. The new projects are expected to generate employment for 10,000 persons directly and indirectly. The Corporation has also registered an all-time record of ` 54.20 crores profit before taxes (provisional) and an income of ` 63.72 crores. The disbursements also touched an all-time high record of ` 118.49 crores. Details of investment and employment made in KSIDC units during 2012-13 are given in Appendix 3.42.
3.104 During the year 2012-13, KSIDC initiated various industrial and infrastructure projects which are strategically important to Kerala’s industrial and economic development. The cumulative investments in these projects are expected to be around ` 1, 00,000 crore. Major projects developed by KSIDC are listed in Box 3.15 and the physical and financial performance during 2012-13 is given in Appendix 3.43.
Box 3.15
Major Projects Promoted by KSIDC for Industrial Development
• Electronic Hardware Park at Kochi – a world class manufacturing and R&D facility for Electronic Sector.
• Life sciences park for setting up state-of-the-art manufacturing and R&D facility for Biotechnology, Nano Technology, Contract Research etc.
• Titanium Sponge Project at Kollam
• Supplementary Gas Infrastructure Project
• Coconut Industrial Park, Kuttiyadi
• Organic Industrial Park, Kodungallor.
C) Kerala Industrial Infrastructure Development Corporation (KINFRA)
3.105 Kerala Industrial Infrastructure Development Corporation (KINFRA) aims at accelerating the industrial development of the State by providing infrastructure facilities to industries. The Industrial Parks developed by KINFRA have facilities like developed land or built up space, dedicated power, continuous water supply, communication facilities etc.
3.106 KINFRA has completed over the past 19 years, 21 theme based Industrial Parks in Kerala in areas such as garments, infotainment, marine/seafood, rubber, exports, food processing, etc. Some of the notable achievements are the successful completion of India’s first International Apparel Park at Trivandrum; India’s first Export Promotion Industrial Park at Ernakulam; India’s first Infotainment Park, the Film & Video Park at Trivandrum and India’s first Food Processing Industrial Park at Malappuram.
3.107 KINFRA has developed Joint Venture Projects like India’s first Rubber Park (a JVC with the Rubber Board) at Kochi, India’s first Seafood Processing Park (a JVC with MPEDA) at Alappuzha and Western India KINFRA Ltd. (a JVC with Western India Services & Estates) at Palakkad. A Joint Venture Company between KINFRA and ICICI, known as I-KIN, has been set up to identify and facilitate the development of infrastructure projects in the State and another company between KINFRA and NTPC, Electrical Supply Co. Ltd. (KINESCO) for distribution of power to KINFRA Parks in the State.
3.108 Government of Kerala has nominated KINFRA as the Nodal agency for State Food Processing Mission in Kerala. The mission has released assistance of ` 3.08 crore to food processing units in the State of Kerala from 2012-13.KINFRA also act as the Nodal Agency of the State for implementing “Assistance to States for Infrastructure Development of Exports and Allied Activities” (ASIDE) of Department of Commerce, Government of India. Government of Kerala has appointed KINFRA as the Nodal Agency for the National Institute of Fashion Technology (NIFT) at Kannur and land acquisition programme for Kannur Airport. The details of allotments in KINFRA Industrial Parks as on 30-09-2013 are given in Appendix 3.44.
Other Institutions
Centre for Management Development
3.109 The Centre for Management Development (CMD) is a leading, self-supporting autonomous institution intended to provide Research, Consulting and Training Support to the Development Agencies, Corporate and the Government, at the national, state and local levels. During the year 2012-13 also, CMD undertook several research, consulting and training assignments for the Government of India, Government of Kerala, Public Sector Enterprises and Autonomous institutions.
3.110 CMD also prepared the “Review of Public Enterprises in Kerala”, which forms part of the budget documents of the state, on behalf of the Bureau of Public Enterprises, Government of Kerala, for the twenty-fifth consecutive year. In the training front, CMD, in collaboration with the Bureau of Public Enterprises, Government of Kerala conducted Management Development programmes for Officers/Managers of the Public enterprises in Kerala during the year 2012-13. Ten programmes were conducted during the year covering 200 managers of various State Level Public Enterprise.
Central Sector Investment
3.111 Central Sector Investment in Kerala is ` 29025.98 crore (2.1%) during 2011-12 against the All India figure of ` 1373526.29 crore ( Public Enterprises Survey 2011-12). State-wise analysis shows that Maharashtra ranked first with the highest central investment of ` 241998.57 crores (17.6 per cent) and other southern states have higher investment in Central PSEs. Tamilnadu ranked 2nd and Andhra Pradesh 3rd.. As for Kerala it ranked 17th. Though the Central Sector Investment to Kerala has been increasing in absolute terms, the per centage share has decreased from 2.4% in 2007-08 to 2.1% in 2011-12. Details of Central Sector Investment in Kerala from 2008 to 2012 are given in Appendix 3.45 and Central Sector Investment in selected states as on 31/03/2012 are given in Appendix 3.46.
Outlook
• Creation of Enterprise Zones targeting economic revitalisation shall promote backward areas.
• Main streaming of environmental constraints like production techniques and organisation practices should be environment friendly.
• Development of recycling and waste management industry is needed.
• Development of eco-friendly parks shall be promoted.
• Establish Kerala as one of the most attractive locations for business investment by developing innovation driven and socially and environmentally sustainable industries.
• Shift in the structure of industry from resource driven to efficiency driven and then to innovation driven
Section 2
Labour and Labour Welfare
3.112 Kerala always ensures the protection of labour and safe guards the interest of labour force through enactment of Labour Laws and Labour Welfare Schemes which ensure that human rights and standards are comparable to advanced countries. State has initiated various measures to keep the right to work of one’s choice, right against discrimination, prohibition of child labour, social security, protection of wages, redressal of grievances, right to organize and form trade unions, collective bargaining and participation in management. Labour Department has been mandated to perform the task relating to maintenance of industrial peace and labour welfare including enforcement of labour laws, skill up gradation of youth, establishing linkages between the employable and the job market through the mechanism of Employment Exchanges, and taking care of the medical needs of the Insured Persons. Kerala is acclaimed nationally and internationally with respect to the Social Security and Welfare measures it has extended for the past so many years. The Government is of the view that every employee/ worker should be a member in any of the Welfare Board and they must be protected by the State throughout their lives. Almost 45 lakh of labour force in the State of Kerala are protected under any one of the Social Security schemes. There are 19 Labour Welfare Fund Boards under the Department. It is an accepted fact that the Labour laws and Labour welfare schemes implemented by state is much higher than that of other states in India. Even the world as such is viewing the labour force in Kerala in high esteem for its high standards.
Composition of Worker
3.113 The labour community in Kerala mainly consists of those who are engaged in the informal sector (loading & unloading, casual work, construction work, brick making self employment etc), traditional industries (coir, cashew, handloom, beedi etc), manufacturing sector (small, medium and large industries), IT industry, units in export promotion zones and those who are seasonally employed.
Industrial Relations
3.114 Creating and maintaining good and healthy industrial relations is one of the major functions of the Labour Department. All the activities of this department are focused on to ensuring fair working and living conditions of the workers in the State and maintaining cordial relationship between the employer and employee to develop a good industrial economy.
Fig 3.8
Number of mandays lost due to strikes

Source: Labour Department, GoK
*Up to September 2013
3.115 Kerala is constantly encouraging labour friendly atmosphere. The state is able to reduce the strikes and lock outs year over year. The total man days lost due to strikes in the state during 2008 was 3.94 lakh now it is reduced to 1.82 lakh. See Appendix 3.47. The man days lost due to lock out was 7.58 lakh in 2008, now it is 2.75 lakh and the man days lost due to lay off was 64316 and 24058 for the corresponding years.See Appendix 3.48 and 3.49.
Fig 3.9
Mandays lost due to lay off

Source: Labour Department, GoK
* Up to September 2013
Rashtriya Swasthya Beema Yojana (RSBY)
3.116 Rashtriya Swasthya Beema Yojana (RSBY) is a Health Insurance Scheme for BPL workers and their families in the Un organized sector introduced during 2008-2009 in all the 14 Districts of Kerala. The annual Insurance cover is for a maximum amount of ` 30,000/- for a family of 5 members including the worker, spouse, children and dependent parents (if included in the BPL family list). The annual insurance premium is fixed through tender process. It is estimated that the premium will be around ` 738/- . The State Government provides 25 per cent of the premium (not exceeding ` 125/-) and administrative cost. The Central Government provides 75 per cent of the premium (not exceeding ` 613/-) (including cost of smart card) directly to the implementing agency, CHIAK (Comprehensive Health Insurance Agency, Kerala). An amount of ` 31 crore is provided as 25 per cent state share for continuing the scheme in the budget 2013-14.
Comprehensive Health Insurance Scheme (CHIS)
3.117 Comprehensive Health Insurance Scheme (CHIS) extends to all families other than the BPL families (absolute poor) as per the guide lines of Planning Commission who come under the RSBY. The Non –RSBY population is divided into 2 categories: (a) those belonging to the BPL (Poor) list of the State Government but not to the list as defined by the Planning Commission, i.e. about 10 lakh Households; and (b) APL families that belong neither to the State Government list nor to the list prepared as per the guide lines of Planning Commission. In the case of the 1st category, the beneficiary pays the same contribution as the RSBY beneficiary and the State Government meets all the remaining expenses, including the cost of smart card. In the case of families in the 2nd category, the beneficiary contribution would cover the entire amount of premium and the cost of the smart card. More than 7 lakh people benefitted from the schemes RSBY/CHIS during the period 2012-13.
Aam Admi Bima Yojana
3.118 Government of India has launched a new insurance scheme called Aam Admi Bima Yojana (AABY) covering 48 categories of households in the country and implemented in the state since 2007-08. As per the scheme, the head of rural landless families or one earning member in each such family will be insured. This scheme is implemented through CHIAK. The premium under the scheme will be ` 200/-. Out of which,50 per cent shall be subsidy from the fund created for this purpose by Central Government and remaining 50 per cent will be contributed by the State Government. As per the scheme, the following benefits shall be given.
a. For natural death ` 30,000/-
b. For accident death ` 75,000/-
c. For permanent total disability due to accident ` 75,000/-
d. Disability due to accident (Loss of one eye or one limb) ` 37,500/-
e. Scholarship for 2 children @ Rs100/month for a child ` 200/- per month
Number of beneficiaries in this scheme is approximately 7.5 lakh
Industrial Training Department
3.119 Industrial Training Department implements Craftsman Training Scheme through Government and Private Industrial Training Institute and Apprenticeship Training Scheme through the Related Instruction Centres. The aim is to create skilled and technically qualified workforce who would contribute to the growth and development of the nation and to provide quality training to all possible people so as to achieve the National goal of 500 million skilled persons by 2020 so as to reduce unemployment.
3.120 There are 76 Government ITIs, one Basic Training Centre, Two Advanced Vocational Training System, and one Staff Training Institute under the Department. Besides this there are 450 ITIs in Private sector and 44 ITIs under Scheduled Caste Department exclusively for SC. Two ITIs which were under Scheduled Tribe Department exclusively for ST candidates which were recently merged with Industrial Training Department are exclusively implementing Craftsman Training Schemes. At present total seating capacity of these ITIs is approximately 97500.
3.121 During the last five years, 43 new ITIs were established in Government sector. Ten ITIs were upgraded and 12 ITIs were up-graded into Centre of Excellence, 22 ITIs were upgraded under PPP (Public Private Partnership) schemes,128 ITIs were sanctioned in the private sector and the training capacity has increased by 21486.The Department had participated in the Indian International Trade Fair 2012 held at New Delhi and got first place among the Departments of the state.
3.122 During 2012-13, total strength of the ITIs is 16812 and the total enrolment is 15520. Out of total enrolment 3939 are women, 2597 are SCs and 247 are STs. Government of India through Directorate General of Employment & Training (DGET) has introduced a Centrally Sponsored Scheme for Upgradation of ITIs into Centre of Excellence in order to produce world class work force. There are 500 ITIs are targeted to be Centres of Excellence in a phased manner at the rate of 100 ITIs in a year throughout the country. In Kerala it has upgraded 12 ITIs into Centre of Excellence with World Bank assistance and domestic funding and 8 ITIs being set up through PPP.
Kerala Institute of Labour and Employment (KILE)
3.123 KILE has been functioning under the Labour and Rehabilitation Department. The principal objective of the institute is to provide education, training, study and research in labour employment and related subject with special reference to Kerala. During 2012-13 (upto November) 11 trainings, 5 workshops, 2 Talks haves been conducted, the total beneficiaries under these programmes are 2695.
Migrant Labour
3.124 The migration of workers for employment is a process prevalent from time immemorial. The migration of workers from the state to other states and abroad was a phenomenon existed in the state from very earlier. However the recent trend in the employment sector in the state is the large inflow of migrant workers from other state such as West Bengal, Bihar, Odisha, Uttar Pradesh, Chhattisgarh, Jharkhand etc. besides the neighbouring state. The migrant workers from poorer states are in demand in levels wages demanded by them. Working conditions of the inter-state migrant workmen are dealt with the Inter State Migrant Workmen Regulation of Employment and Conditions of Service Act,1979. As per the provision of the Act the contractor have to obtain a recruitment license from the state from where the workers are recruited (Original State) and an employment license from the state where they are employed (Recipient State).Accordingly the contractor and the principal employer become liable for ensuring the provisions envisaged in the enactment as an immediate employer and the principal employer respectively. But usually these workers cannot be brought under the purview of the enactment due to lack of statutory ingredients required to attract the ambit of the enactment such as an intermediary third party/contractor between the Principal employer and the workmen. These workers are compelled to live in groups and unhygienic circumstances near to their working place without proper health facilities. There are more than 25 lakh migrant workers are employed in various employment sectors in the state. The percentage distribution of the workers from different states are given below.
Fig 3.10
State wise distribution of ISM workers

Source: Labour Commissionerate,GoK
3.125 Out of the total ISM (Inter State Migrant) workers, West Bengal is the leading state by accomplishing 47 per cent of ISM workers which is followed by Orissa by 16 per cent. See Appendix 3.50.These workers engaged in different areas such as agriculture, construction, Hotel and Restaurant, Manufacturing, trade etc. In some instance these workers exceeds the number of domestic workers employed. The percentage distribution of the workers employed in different employments is given below:
Fig 3.11
ISM workers in various employment in the state
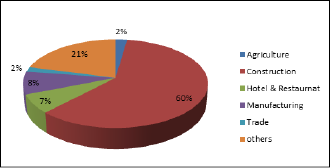
Source : GIFT,GoK.
3.126 The government initiated various welfare measures to ensure the social security of the ISM workers in Kerala and a considerable provision is earmarked in the budget proposals. But majority of the workers who are illiterate or having language problem did not have an opportunity to know about the scheme and enjoy the benefits provided from it. Therefore an awareness programmes, medical camps and UID registration are essential for the rehabilitation of these working groups. Additional details of the Labour sector is given in the Appendix 3.51, 3.52, 3.53, 3.54, 3.55, 3.56, 3.57, 3.58, 3.59 and 3.60.
Outlook
3.127 Given the changing dynamics of the employment landscape of the state, the role of the Labour Department needs to be restructured to ensure the long term employer-employee relationship. The issues confronting the vulnerable sections of the labour are to be addressed through effective implementation of labour laws and focused welfare policies. A realization has dawned upon all the stakeholders that most vulnerable sections of the labour resources viz. migrant labour, women and vast mass of labour working in the unorganized of informal sector need special attention.
Section 3
Unemployment Situation in Kerala
3.128 One of the major problems that exist in Kerala is unemployment. There is an increase in labour supply due to the increase in the number of women work seekers in various sectors from the decade of 1970’s, which resulted in rapid rise in unemployment in Kerala. Further the growth of educated manpower has increased the demand for white-collared jobs. As there is a lack of job opportunities in our state, which ensure high wages, many are emigrating especially to Gulf countries. Migration of people to foreign countries results in inflow of remittances into the state, which is one of the important drivers of our economy. However, emigration also has several drawbacks and adverse impacts on the domestic economy.
3.129 The Employment and Unemployment Surveys conducted by the National Sample Survey Office (NSSO) are the prime source of data on labour market in India.These surveys are usually conducted every five years. However, recently NSSO carried out two surveys at two year interval in the years 2009-10 and 2011-12. According to some Economic Analysts, the reason for conducting a survey in 2011-12 in such quick succession was due to the unusual economic conditions in 2009-10, a drought year and some parts of the economy were affected by the worldwide recession, thus making it a bad base year for comparisons.
3.130 As per the ninth Employment and Unemployment Survey conducted by the NSSO during the year 2011-12 as part of 68th round of National Sample Survey, among the larger Indian States, Kerala is the state having the highest Unemployment Rate (UR) under all (four) approaches of measuring unemployment. The survey reveals that only two small States viz; Nagaland and Tripura have a higher unemployment rate than Kerala.
3.131 Unemployment rate in Kerala for persons of age 15-59 years in 2011-12 as per Usual Principal & Subsidiary Status (UPSS) approach was 7.4 per cent behind two small states viz; Nagaland (18.7 per cent) and Tripura (13.6 per cent), as against the national average of 2.3 per cent. This indicates that the rate of unemployment in Kerala was almost three times the all India rate. According to the current daily status (CDS) approach, Kerala’s unemployment rate for persons of age 15-59 years was 16.5 per cent, behind Nagaland (25.5 per cent) and Tripura (19.7 per cent) as against the national average of 5.8 per cent.
3.132 The lowest unemployment rate of 0.5 per cent is estimated in Gujarat under UPSS approach for persons of age 15-59 years. Female UR under UPSS approach is highest in Tripura State (26.9 per cent), followed by 21.9 per cent in Nagaland, 15.4 per cent per cent in Kerala and 7.4 per cent in Bihar as against the national average of 2.5 per cent. Whereas the male UR under UPSS approach is highest in Nagaland (17.0 per cent) followed by 7.5 per cent in Tripura and 5.0 per cent in Goa. Male UR at the national level is 2.2 per cent under UPSS approach.The unemployment rate of persons of age 15-59 years according to UPSS approach based on 2011-12 survey for each State/UT is given in the Appendix 3.61.
3.133 In Kerala, the unemployment rate is higher in rural areas as compared to urban areas under all approaches of measurement.While comparing the unemployment rate of male and female, it is seen that UR is much higher among females as compared to males. For instance, under the UPSS approach for persons of age 15-59 years, the female UR is estimated to be 15.4 per cent whereas for males, the UR is 3.4 per cent. In rural areas, the female UR is estimated to be 15.6 per cent and male UR is 3.5 per cent; whereas the same in urban area is 14.6 per cent and 2.9 per cent respectively.
3.134 The unemployment rates of persons of age 15-59 years based on four different approaches as estimated by NSSO during 2011-12 is given in Table 3.3. A comparison between different estimates of unemployment indicates that the CDS estimate of unemployment is the highest. This scenario reflected both in rural and urban areas. The higher unemployment rates according to the CDS approach compared to the current weekly status (CWS) and usual status approaches (UPS and UPSS) indicate a high degree of intermittent unemployment in Kerala.
Table 3.3
Unemployment Rate in Kerala under different approaches as per 66th and 68th
National Sample Surveys (Per cent)
(Age: 15 years and above)
Approach |
Rural |
Urban |
Rural + Urban |
||||||
Male |
Female |
Total |
Male |
Female |
Total |
Male |
Female |
Total |
|
NSS 68th Round (July 2011 – June 2012) |
|||||||||
UPS* |
4.3 |
24.4 |
10.4 |
3.3 |
19.7 |
8.1 |
4.1 |
23.2 |
9.8 |
UPSS* |
3.5 |
15.6 |
7.7 |
2.9 |
14.6 |
6.6 |
3.4 |
15.4 |
7.4 |
CWS* |
6.8 |
22.3 |
11.8 |
4.9 |
18.7 |
9.1 |
6.3 |
21.4 |
11.0 |
CDS* |
13.0 |
29.3 |
18.0 |
8.9 |
22.0 |
12.6 |
11.9 |
27.4 |
16.5 |
NSS 66th Round (July 2009 – June 2010) |
|||||||||
UPS* |
4.1 |
22.8 |
9.9 |
3.7 |
20.6 |
8.9 |
4.0 |
22.1 |
9.7 |
UPSS* |
3.6 |
17.6 |
8.4 |
3.2 |
17.6 |
7.8 |
3.5 |
17.5 |
8.3 |
CWS* |
5.2 |
21.4 |
10.4 |
5.5 |
18.8 |
9.7 |
5.3 |
20.9 |
10.2 |
CDS* |
13.9 |
29.3 |
18.5 |
12.8 |
22.3 |
15.7 |
13.5 |
27.2 |
17.9 |
Source:1. Key indicators of Employment and Unemployment in India 2009-10, NSSO June 2011
2. Key indicators of Employment and Unemployment in India 2011-12, NSSO June 2013
* Please see glossary
3.135 A comparison of the unemployment rates given in Table 3.1 indicates that the number of unemployed has come down marginally in the State during the two year period 2009-10 and 2011-12, under UPSS approach. For instance, the unemployment rate based on UPSS approach among male in urban area was 3.2 per cent in 2009-10. This rate diminished to 2.9 per cent as per the 2011-12 sample survey. In the rural areas, the UR among males decreased from 3.6 per cent to 3.5 per cent during the two-year period. Among urban females, the UR decreased from 17.6 per cent to 14.6 per cent and among rural female, from 17.6 per cent to 15.6 per cent during the same period. Reduction in unemployment rates under UPSS approach implies that the rate of chronically unemployed persons (or open employment rates) declined marginally in Kerala during the two year period. However, in the case of person-days unemployment as per CDS approach, female UR increased slightly from 27.2 per cent in 2009-10 to 27.4 per cent in 2011-12; when the male UR declined marginally from 13.5 per cent in 2009-10 to 11.9 per cent in 2011-12, thus making it a decline in overall unemployment rates from 17.9 per cent in 2009-10 to 16.5 per cent in 2011-12.
3.136 Estimates on some important indicators reflecting the prevalence of employment/unemployment in Kerala and India for all persons based on the surveys conducted by the NSSO in 2009-10 and 2011-12 are given in Appendix 3.62 and Appendix 3.63 respectively.
Unemployment Rates as per Labour Bureau Survey, 2012-13
3.137 The third annual Employment & Unemployment Survey conducted by the Labour Bureau, an organisation under the Ministry of Labour & Employment during October 2012 - May 2013 confirmed the findings of NSSO survey (2011-12) that, among the larger Indian States, Kerala has the highest Unemployment Rate under all approaches. For example, Unemployment rate in Kerala for persons of age 15 years and above as per UPSS approach was 9.6 per cent, behind three small States of Sikkim (12.2 per cent), Arunachal Pradesh (10.2 per cent) and Goa (9.9 per cent). According to the CDS approach, Kerala’s Unemployment Rate was 10.2 per cent and the four small States which have higher UR than Kerala was Sikkim (12.9 per cent), Tripura (12.7 per cent), Arunachal Pradesh (11.6 per cent) and Goa (11.2 per cent). The unemployment rates based on four different approaches as estimated by Labour Bureau survey during 2012-13 are given in Table 3.4.
Table 3.4
Unemployment Rates in Kerala based on different approaches (per cent)
as estimated by Labour Bureau during 2012-13
Approach |
Rural |
Urban |
Rural + Urban |
||||||
Male |
Female |
Total |
Male |
Female |
Total |
Male |
Female |
Total |
|
UPS |
4.6 |
24.2 |
10.2 |
4.4 |
27.4 |
11.0 |
4.5 |
25.1 |
10.4 |
UPSS |
4.3 |
20.3 |
9.3 |
4.2 |
25.1 |
10.4 |
4.3 |
21.6 |
9.6 |
CWS |
4.9 |
18.3 |
8.9 |
4.8 |
24.1 |
10.4 |
4.9 |
19.9 |
9.3 |
CDS |
5.8 |
19.2 |
9.8 |
6.0 |
24.9 |
11.4 |
5.9 |
20.7 |
10.2 |
Source:Report on third Annual Employment & Unemployment Survey, Labour Bureau,
Ministry of Labour and Employment, Govt. of India, published in September 2013
Employment in the Organised Sector
3.138 In Kerala, employment in the organised sector is coming down. For instance, persons employed in organised sector decreased from 12.26 lakh in 2000 to 11.4 lakh in 2005 and further to 10.88 lakh in 2012, a reduction of 11.3 per cent over a period of 13 years. This is mainly due to the reduction of persons working in the public sector. The share of women in organized-sector employment was 42.0 per cent in 2013 March end and has remained nearly constant in recent years.
3.139 The organised sector comprises of private and public sectors, and in Kerala public sector employment is more when compared to private sector. For instance, in 2013 out of 10.88 lakh persons employed in the organised sector 5.65 lakh (52 per cent) are in public sector and 5.23 lakh (48 per cent) are in the private sector. The share of women in public sector in Kerala is about 32 per cent; where as in the case of private sector it is 53 per cent. Details of employment in organised sector in Kerala are given in Figure 3.12 and Appendix 3.64. All India figures may be seen at Appendix 3.65.
Fig 3.12
Employment in the Organized Sector- Kerala
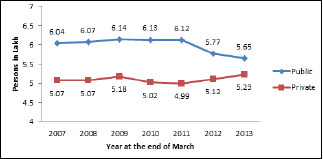
Source: Directorate of Employment, Govt. of Kerala, 2013
3.140 The branch-wise analysis of employment under public sector shows that persons employed in the Central Government offices in Kerala are decreasing over the years. At the end of March 2000 there were 86,889 central Government employees in Kerala. It declined to 76,789 in 2005 and further declined to 56,978 in 2013 (See Appendix 3.66). All India figures may be seen in Appendix 3.67.
3.141 The percentage distribution of employment in public sector as on March 31st 2013 shows that 47 per cent of employment is from the State Government when the employment from Central Government is only a 10 per cent. The share of Quasi Governments; Central and State together is 39 per cent of Public Sector employment (See Fig. 3.13).
Fig 3.13
Distribution of Employment in Public Sector- March 2013

Source: Directorate of Employment, Govt. of Kerala, 2013
3.142 Data on district-wise employment in organized sector as on March 2013 indicate that the highest employment is in Ernakulam District with 1.88 lakh persons, which accounted for 17.3 per cent of the total employment; followed by Thiruvananthapuram with 1.49 lakh persons (13.7 per cent), and Thrissur with 0.98 lakh persons (9.0 per cent). The lowest number of organized sector employment is in Wayanad district with 25,005 persons, which accounted for a paltry 2.3 per cent of the total employment; preceded by Kasaragod with 45,564 persons (See Appendix 3.68 & Appendix 3.69).
3.143 Of the total employment of 1.88 lakh persons in Ernakulum District as on March 2013, 1.06 lakh persons (56.4 per cent) are from the private sector. In Wayanad District only 12,319 persons are employed in the private sector. In the case of public sector highest employment is in Thiruvananthapuram District (1.13 lakh) when the lowest employment of 12,686 persons is from Wayanad District.
3.144 The sectoral distribution of workers in organised sector across different years indicates that the dependence on agriculture continues to decline;when service sector continues to rise. In 2012-13, the employment in agriculture (relative to other sectors) declined by approximately 1.3 per cent as compared to that in 2004-05. Share of employment in Mining & Quarrying and the Manufacturing sectors also registered a decline in 2012-13 as compared to that in 2004-05.The sectors Construction and Transport, Storage & Communication also witnessed a decrease in share in 2012-13. However; the Trade, Restaurants & hotels and Community, Social and Personal Services registered a marginal increase in their share in 2012-13. Electricity, Gas, Water & Sanitary Services and Financing, Insurance, Real Estate and Business Services also witnessed an increase in the share of employment (See Appendix 3.70).The relative share of employment in Community, Social and Personal Services in 2012-13 increased by 1.58 per cent as compared to that in 2004-05.
3.145 Analysis of the sector-wise growth of employment in organized sector in Kerala as on March 2013 given in Appendix 3.70 reveals that the highest employment is in the community, social and personal services (46.3 per cent), followed by Manufacturing 20.8 per cent, financing and business services 9.3 per cent and Transport, Storage & Communication 8.5 per cent. All India figures are given in Appendix 3.71.
Employment in Unorganised Sector
3.146 Unorganised sector constitutes a pivotal part of the Indian economy. More than 90 per cent of workforce and about 50 per cent of the Gross Domestic Product are accounted for by the unorganized economy. A high proportion of socially and economically weaker sections of society are concentrated in the unorganized economic activities in India and Kerala.
3.147 According to the latest employment and unemployment survey carried out by the NSSO as part of the 68th round of NSS during 2011-12 it is estimated, as per UPSS approach,that self employed workers in Kerala constituted 37.7 per cent of the total workers. Comparatively the percentage share of regular wage/salaried employee accounted for 22.5 per cent and that of casual labour accounted for 39.8 per cent.
3.148 Department of Employment in Kerala is planning to intervene in the employment market for the benefit of employment seekers under the unorganised sector; to reduce instances of unfair practices that exist. Employment in the unorganized sector is carried out usually through private agencies, who sometimes exploit both the service seekers and service providers by exhorting huge commissions from them. A web based interface is proposed to be launched soon to bring both the service seekers and service providers together without the intervention of middle men.
Registered Job Seekers at the Employment Exchanges
3.149 At the national level, the registered work seekers at the Employment Exchanges in India have come down during the period 2006-2010.The total number of work seekers in the country as on December 2006 was 414.66 lakh. It declined to 388.18 lakh in December 2010, a reduction of 26.48 lakh over a period of four years. However, as on 31st December 2011 the number shows a marginal increase of 13.53 lakh over the previous year. Of the total of 401.72 lakhwork seekers in 2011, 264.77 lakh are men (66.0 per cent) and 136.94 lakh women (34.0 per cent). Year-wise all India registration, placement, vacancies notified, submission made and Live Register for the period 2002 to 2011 are given in Appendix 3.72.
3.150 The main feature of live registers of employment exchanges in Kerala till 2012 was that the number of work seekers was increasing year after year mainly because no updation is done regarding those who have found jobs.The Employment Department has recently computerized live registers for making verifications, as a result the number of work seekers in the live registers of the employment exchanges in Kerala decreased significantly.
3.151 According to live registers of employment exchanges in Kerala, the total number of work seekers as on 31st December 2012 was 44.99 lakh, up from 41.44 lakh in 2008 and 36.70 lakh in 2005. But now it has declined to 39.78 lakh, as on 30th September 2013, a reduction of 5.21 lakh persons from the previous year. This has happened due to the removal of lapsed registrations. Job seekers are categorized as either General or Professional & Technical. The peculiarity of this declining trend is that the total number of general work seekers declined from 43.29 lakh in 2012 to 38.19 lakh in 2013.Of the total work seekers of 39.78 lakh as on September 2013, 23.86 lakh (60 per cent) are women. Category-wise registered job seekers in Employment Exchanges are given in Table 3.5. Details of work seekers under the general and professional & technical categories for various years may be seen at Appendix 3.73.
Table 3.5
Registered job seekers in Employment Exchanges - Kerala
(As on 30th September 2013)
No. |
Category |
Numbers |
1 |
Illiterate |
206 |
2 |
Below SSLC |
4,46,078 |
3 |
SSLC |
24,76,112 |
4 |
Higher Secondary |
6,88,946 |
5 |
Degree |
3,06,747 |
6 |
Post Graduates |
59,714 |
Total |
39,77,803 |
|
Source: Directorate of Employment, Govt. of Kerala, 2013
3.152 The number of work seekers below SSLC is declining year after year since 2006 and it declined from 6.37 lakh in 2006 to 5.98 in 2012 and further to 4.46 lakh as on September 2013. Whereas, the total number of work seekers who possess SSLC &above has shown an increasing trend till 2012 and thereafter the number declined in 2013 due to the removal of lapsed registrations.The trend of work seekers in the categories of ‘below SSLC’ and ‘SSLC & above’ since 2005 is shown in Fig.3.14.
Fig 3.14
Trends of work seekers in Kerala

Source: Directorate of Employment, Govt. of Kerala, 2013
3.153 The number of HSC qualified candidates who have registered at the employment exchanges increased from 5.75 lakh in 2005 to 7.49 lakh in 2012. But it has declined to 6.89 lakh in 2013 due to the removal of lapsed registrations. However, the data on registered graduates and post graduates shown a contrary picture. Even though the total registration is declined sharply in 2013 over the previous year, the number of registrations under the categories of graduates and post graduates increased by 0.41 lakh and 0.11 lakh respectively (See Appendix 3.74).
3.154 Of the total employment seekers as on September 2013, 11.2 per cent is below SSLC, 62.3 per cent SSLC, 17.3 per cent HSC or equivalent, 7.7 per cent graduates and 1.5 per cent post graduates. The percentage share of work seekers in various levels of education from 2008 to 2013 is given in Table 3.6.
Table 3.6
Percentage Share of Employment Seekers according to
level of Education–Kerala
Sl. No |
Level of Education |
Share (per cent) |
|||||
2008 |
2009 |
2010 |
2011 |
2012 |
Up to Sept. 2013 |
||
1 |
Below SSLC |
15.0 |
14.5 |
13.8 |
13.5 |
13.3 |
11.2 |
2 |
SSLC |
61.5 |
62.2 |
62.4 |
62.8 |
63.1 |
62.3 |
3 |
HSC or equivalent |
16.5 |
16.5 |
16.7 |
16.6 |
16.6 |
17.3 |
4 |
Degree |
5.7 |
5.6 |
6.0 |
6.0 |
5.9 |
7.7 |
5 |
Post Graduate |
1.3 |
1.2 |
1.1 |
1.1 |
1.1 |
1.5 |
Total Work Seekers |
100.0 |
100.0 |
100.0 |
100.0 |
100.0 |
100.0 |
|
Source: Directorate of Employment, Govt. of Kerala, 2013
3.155 The number of professional & technical work seekers comprising of Medical/ Engineering Graduates, Diploma/ Certificate holders in Engineering, Agricultural/Veterinary graduates as on September 2013 is 1.59 lakh. Data reveal that ITI certificate holders and Diploma holders in Engineering together constitute 80.4 per cent of the total professional & technical work seekers (See Table. 3.7). As on September 2013, the number of registered work seekers having other professional qualifications like LLB/LLM, MCA, MBA, PGDCA, BLisc/MLisc etc. altogether comes to 46,490.
Table 3.7
Percentage Share of Professional and Technical work seekers in Kerala
Sl. No |
Educational Qualification |
Share (per cent) |
|||||
2008 |
2009 |
2010 |
2011 |
2012 |
up to 2013 |
||
1 |
Medical Graduates |
1.6 |
1.7 |
1.4 |
1.5 |
1.7 |
7.7 |
2 |
Engineering Graduates |
5.5 |
6.5 |
5.4 |
6.7 |
8.5 |
11.2 |
3 |
Diploma holders in Engineering |
22.2 |
24.8 |
23.4 |
23.0 |
22.9 |
25.6 |
4 |
ITI Certificate holders |
69.8 |
66.2 |
69.3 |
68.2 |
66.2 |
54.8 |
5 |
Agricultural Graduates |
0.5 |
0.4 |
0.3 |
0.3 |
0.3 |
0.3 |
6 |
Veterinary Graduates |
0.4 |
0.4 |
0.3 |
0.3 |
0.4 |
0.4 |
Total |
100.0 |
100.0 |
100.0 |
100.0 |
100.0 |
100.0 |
|
Source: Directorate of Employment, Govt. of Kerala, 2013
3.156 As stated earlier due to the removal of lapsed registrations, the total number of work seekers at the employment exchanges in Kerala declined by 5.21 lakh as on September 2013 over the previous year. This has happened due to the reduction of numbers in the categories like below SSLC, SSLC, HSC and ITI certificate holders. Registration under ITI certificate holders is declined by 25,223 persons. However, Medical Graduates, Engineering Graduates and Diploma holders in Engineering have shown an increasing trend, as in the case of General Graduates and Post Graduates, in spite of overall reduction. This gives a clear indication that unemployment is increasing among these categories. The number of registered work seekers under the category of Medical Graduates comprising of Doctors, BSc Nursing, BSc MLT and B.pharm in 2013 increased from 2912 in 2012 to 12,284 in 2013 (See Appendix 3.74 & Appendix 3.75).
3.157 A significant and peculiar feature of Kerala’s unemployment situation is that women outnumber men who seek employment through employment exchanges. This position is reflected in all the 14 districts in Kerala. The district-wise unemployment of women and men in 14 districts of Kerala as on 31-09-2013 is shown in the following graph (Fig.3.15).
Fig 3.15
Work Seekers in Kerala as on 30-09-2013 (Status of Men and Women)

Source: Directorate of Employment, Govt. of Kerala, 2013
3.158 Thiruvananthapuram District ranks first in the number of work seekers in both general and professional categories as on 30-09-2013. The total number of work seekers in Thiruvananthapuram district is 6.4 lakh of which 3.8 lakh are women and 2.6 lakh men. The second largest number of work seekers is from Kollam district. There are 4.0 lakh job seekers in Kollam District as on September 2013, out of which 2.4 lakh are women and 1.6 lakh men. The lowest number of work seekers is in Kasargod district with 0.98 lakh persons, preceded by Wayanad District with 1.00 lakh persons (See Appendix 3.76).
Placement through Employment Exchanges in Kerala
3.159 The figures furnished by the Director of Employment & Training reveal that placement through Employment Exchanges in Kerala has been declining since 2000. Total placement is declined from 23,012 in 2000 to 11,731in 2012.The placement through employment exchanges in Kerala since 2000 is illustrated in the following graph Fig.3.16.
Fig 3.16
Placement through Employment Exchanges –Kerala

Source: Directorate of Employment, Govt. of Kerala, 2013
New Initiative for modernizing Employment Exchanges
3.160 Department of Employment has embarked on an ambitious programme to change the face of employment exchanges by converting them into employability centres (skill development centres). The idea is to make the work force of Kerala globally acceptable by imparting exhaustive training in accordance with the international standards. For this, skill gap analysis is proposed to be done through various processes and gap filling training will be given. After the training, testing and certificate will be done and a Skill Card will be issued to the pass outs. A website of the skilled workforce is also proposed for global access by prospective placements. Training will also be imparted for appearing in various competitive examinations. State’s first employability centre has been started functioning at the district employment exchange, Ernakulam.
Outlook for Industry, Labour and Employment
In land scarce and environment conscious Kerala, high value added, non polluting industry should be promoted, where knowledge, skills and work ethics provide a competitive edge. Public sector enterprises should be encouraged to form strategic partnerships with the private sector and to be run on a commercial basis as it would be difficult to sustain them unless they are run on commercial lines. Traditional industries are part of our heritage and preservation of handloom, coir, handicraft and cashew industries through Government support will be required. Nevertheless, they too should introduce innovative and new products, which are likely to create a steady demand. As far as mining is concerned, full coverage of survey and exploration measures including developing GPS data base of mineral resources are needed. Indiscriminate mining should be checked as it causes depletion of natural wealth. Highly skilled and well compensated labour force coupled with adequate and appropriate employment opportunities for labour of all categories- skilled, semi-skilled, unskilled, women, retired people, people from vulnerable communities etc. should be ensured to allow the benefits of industrial development to reach all pockets of society.