
Page 13 - economic review
P. 13
xi
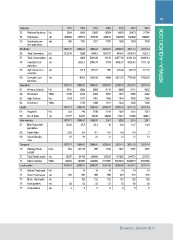
Factories No. 1971 1981 1991 2001 2011 2012 2014 KERALA – A QUICK LOOK
53 Working Factories -do 3024 9106 13255 18554 19676 20473 21764
54 Employees -do 206839 300515 368738 436410 644606 644802 646923
55 Employees per 969 1181 1267 1370 1930 1930 1930
Mu
lakh population -do 1970-71 1980-81 1990-91 2000-01 2009-10 2011-12 2013-14
Electricity -do 2125.99 5242 5490.8 7655.57 6494.5 8350.74 8218.1
56 Total Generation -do 2869 5281.86 12877.65 16181.63 18365.43
57 Total Consumption -do 2696.78 10319 4002.37 4926.43 8131.32
58 Industrial Con- 2025.3 3784
No.
sumption '000s 124.6 287.57 350 225.22 286.18 317.81
59 Agricultural Con- No.
'000s 409.2 1620.93 4688 5931.27 7705.86 8739.52
sumption No.
60 Domestic Con- -do 1970-71 1980-81 1990-91 2000-01 2009-10 2012-13 2013-14
9437 9605 9682 9714 9828 9737 9662
sumption Kms. 4156 4284 4402 3637 3015 2545 2442
Education -do 1199 1971 2451 2596 2814 2890 2964
61 Primary Schools '000s 1310 1498 1611 1443 1426 1406
62 Enrolment 1970-71
63 High Schools 553 1980-81 1990-91 2000-01 2009-10 2011-12 2013-14
64 Enrolment 746 1199 1319 1254 1255 1281
Health 21777 38242 37021 37388 38241
65 Hospitals 1970-71 32447 38726 2001 2009 2010 2011
66 No. of Beds 1980-81 1990-91 16 14.6 14.7 14.8
Vital statistics 32.26
67 Birth Rate/1000 25.5 20.3
population 9.23 6.4 6.1 6.6 6.6 6.8 7
68 Death Rate 61 37 21 11 12 14 13
69 Infant Mortality
1970-71 1980-81 1990-91 2000-01 2010-11 2011-12 2013-14
Rate 892 1257 1257 1257
Transport 921.35 988 1148
70 Railway Route
18037 94145 128403 125835 151652 244373 331372
Length 86234 195000 648000 2111885 6072019 8048673 8547966
71 Total Road Length 1990-91 2000-01 2006-07 2007-08 2008-09 2010-11 2013-14
72 Motor Vehicles
Local bodies 983 14 14 14 14
990 999 999 978
73 District Panchayat No. 58 152 152 152 14 14 152
3 53 53 53 999 978 60
74 Gram Panchayats -do 152 152
5 5 5 53 60 5
75 Block Panchyats -do
55
76 Municipalities -do
77 Corporations -do
Economic Review 2014