Page 16 - economic review
P. 16

xiv

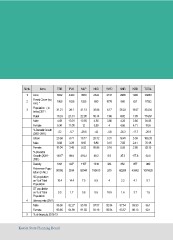
     Sl.No.         Items      TSR    PLK    MLP KKD        WYD    KNR KSD TOTAL
                                      4480   3550 2344      2131   2966 1992 38863
     1 Area                    3032   1628   1255 690       1776   866 621 17922

     2       Forest Cover (sq  1068   28.1                  8.17
             Km) *                    21.31                 7.86
                                      10.31                 3.86
     3       Population ( in   31.21  11.01  41.13  30.86          25.23  13.07  334.04
             lakhs) 2011              -5.7                    4
                                      6.77   22.95  10.14   -4.6   8.82   7.99   174.67
             Rural 10.24              3.28   10.95  4.85    0.31   4.26   3.88   84.08
                                      3.49          5.29    0.15   4.56   4.11    90.6
             Male 4.88                        12            0.16
                                      89.8           -43           -26.3  -17.7  -25.9
             Female            5.36          -29.8           6.6
                                       627          20.72          16.41  5.09   159.33
             % Decadal Growth  -52    2534   18.17  9.86     384   7.56   2.41   76.18
             (2001-2011)                     8.65   10.86    230   8.85   2.68   83.15
                                      14.4   9.52
             Urban             20.96                          4
                                       1.7
             Male 9.92                                      18.5
                                      92.27
             Female            11.04  84.99                 92.84
                                                            85.94
             % Decadal         149.7         410.2 88.2            35.3 117.8 92.8
             Growth (2001-
             2011)

             Density           1031          1157    1316           852    657     860
                                             82044  106613         60208  43342  1001625
             Fishermen Popu-   90306
             lation (in No.)

             SC population     10.4          7.5 6.5               3.3 4.1 9.1
             as % of Total
             Population

             ST population     0.3           0.6 0.5               1.6 3.7 1.5
             as % of Total
             Population

     4 Literacy rate (2011)

             Male 96.98                      95.78  97.57          97.54  93.93  96.1
                                             91.55  93.16          93.57  86.13  92.1
             Female            93.85

     5 % of dropouts 2012-13

     Kerala State Planning Board
   11   12   13   14   15   16   17   18   19   20   21