
Page 164 - economic review
P. 164
136
SOCIAL SERVICE Prof. P.O.J. Lebba, looks into the various aspects of the quality of school education in the State and
is expected to suggest measures for improving it.
Expenditure on Education
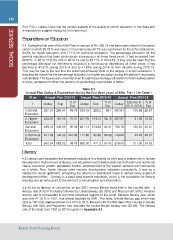
4.4 During the first year of the XIIth Plan an amount of Rs. 590.24 had been earmarked for Education
sector of which 98.78 % was spent. In the total outlay 48.7% was earmarked for the school education,
34.2% for higher education and 17.1% for technical education. The percentage allocation for the
general education has been continuously increasing in all these three years. It had increased from
82.87% in 2012-13 to 83.14% in 2013-14 and to 83.71% in 2014-15. It may also be seen that the
percentage allocation for elementary education is continuously decreasing all these years. It has
declined to 47.67% during 2013-14 and to 41.83% during 2014-15 from 48.66% during 2012-13.
This may be due to the fact that the state had achieved most of the targets in school education. It
may also be noted that the percentage allocation for higher education during this period is increasing
substantially. The figures also show that even though the percentage allocation for technical education
is lower, compared to other sub sectors, its percentage expenditure is better.
Table 4.1
Annual Plan Outlay & Expenditure during the first three years of XIIth Plan ( ` in Crore )
Sl no Annual Plan 2012-13 Annual Plan 2013-14 Annual Plan 2014-15
1 Outlay Exp. % of Outlay Exp. % of Outlay Exp.(Up to % of
Exp Exp 30.11.2014) Exp
1.School 287.15 286.54 99.79 333.15 220.2 66.1 367.81 106.56 28.97
Education
2. Higher 202.00 154.15 76.31 247.99 154.15 62.16 367.97 61.96 16.83
Education
General 489.15 440.69 90.09 581.14 374.35 64.41 735.78 168.52 22.91
Education
3.Technical 101.09 142.33 140.95 117.86 96.95 82.33 143.22 42.48 29.67
Education
Total 590.24 583.02 98.78 699.00 471.3 67.42 879.00 211.00 24.00
Literacy
4.5 Literacy and education are important indicators in a society as they play a central role in human
development. Higher levels of literacy and education lead to better attainment of health and nutritional
status, economic growth, population control, empowerment of the weaker sections and community
as a whole. Also, higher literacy rates improve development indicators consistently. It acts as a
catalyst for social upliftment, enhancing the returns on investment made in almost every aspect of
development effort. Literacy is a basic step towards education, which is the foundation for lifelong
learning and an entry point to the world of communication and information.
4.6 As far as literacy is concerned; as per 2011 census Kerala ranks first in the country with a
literacy rate of 93.91% closely followed by Lakshadweep (92.28%) and Mizoram (91.58%). Kerala’s
literacy rate is comparable to the most advanced regions of the world. Kerala’s literacy rate, which
was only 47.18 % in 1951, has almost doubled by 2011. The male, female literacy gap which was
22% in 1951 has narrowed down to 4.41% in 2011. Kerala holds the first rank in the country in female
literacy with 92% and Rajasthan has recorded the lowest female literacy rate (52.66). The literacy
rate of the state from 1951 to 2014 is given in Appendix 4.1.
Kerala State Planning Board