Page 224 - economic review
P. 224

196

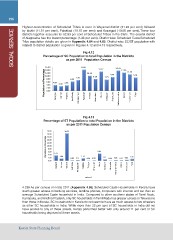
     Highest concentration of Scheduled Tribes is seen in Wayanad district (31.24 per cent) followed
     by Idukki (11.51 per cent), Palakkad (10.10 per cent) and Kasargod (10.08 per cent).These four
     districts together accounts for 62.93 per cent of Scheduled Tribes in the State. The coastal district
     of Alappuzha has the lowest percentage (1.36 per cent). District wise Scheduled Caste/Scheduled
     Tribe population details are given in Appendix 4.84 and 4.85. District wise SC/ST population with
     respect to district population is given in Figures 4.12 and 4.13 respectively.
SOCIAL SERVICE

                                          Population in Percentage

                                                                 Kas ar god
                                                                         Kannur
                                                                                  Wayand

                                                                                          Kozhikode
                                                                                                  Malappuram

                                                                                                           Palakkad
                                                                                                                   T hriss ur
                                                                                                                            Ernakulam

                                                                                                                                    Idukki
                                                                                                                                            Kottayam
                                                                                                                                                     Alappuzha
                                                                                                                                                             Pathanamthitta

                                                                                                                                                                     Kollam
                                                                                                                                                                              Trivandrum

                                                                                                                                                                                      Total
                                            Fig 4.12
     Percentage of SC Population to total Population in the Districts

                           as per 2011 Population Census

     16.00                                   14.37                 13.12                13.74
     14.00                                                                                      12.46
     12.00                                                                                             11.30
     10.00                                          10.39                         9.46                          9.10
                                                             8.18         7.79
      8.00                        6.45 7.50
      6.00
      4.00  4.08 3.30 3.99
      2.00
      0.00

                                            Fig 4.13
     Percentage of ST Population to total Population in the Districts

                           as per 2011 Population Census

     20.00                 18.53
     18.00
     Population in Percentage16.003.74                             5.03
                     Kasargod14.001.64
     12.00                                   1.74
                              Kannur10.00
                                      Wayand
                                               Kozhikode8.00
                                                       Malappuram6.00
                                                                Palakkad4.00
                                                                        Thrissur2.00
                                                                                 Ernakulam0.00

                                                                                         Idukki
                                                                                                 Kottayam
                                                                                                          Alappuzha
                                                                                                                  Pathanamthitta

                                                                                                                           Kollam
                                                                                                                                   Trivandrum

                                                                                                                                            Total
                                  0.49 0.56         0.30 0.50            1.11 0.31 0.68 0.41 0.81 1.45

                                                                                                                       Series1

        4.236 As per census on India 2011 (Appendix 4.86) Scheduled Caste Households in Kerala have
        much greater access to banking services, landline phones, computers with internet and car than an
        average Scheduled Caste household in India. Compared to other southern states of Tamil Nadu,
        Karnataka, and Andhra Pradesh, only SC households in Tamil Nadu has greater access to Televisions
        than those in Kerala. SC households in Kerala do not seem to have as much access to two wheelers
        as other SC households in India. While more than 22 per cent of SC households in India did not
        have access to any of these assets, Kerala performed better with only around 11 per cent of SC
        households being deprived of these assets.

     Kerala State Planning Board
   219   220   221   222   223   224   225   226   227   228   229