Chapter 1
MACRO ECONOMIC PROFILE
Introduction
Kerala was known for long as a case of high human development at low incomes. But recent years have seen a great change in the status of Kerala. Now both urban and rural areas of the State report asset holdings much higher than that of the Indian average and the State ranks among the top three Indian States. In rural Kerala, the average value of assets of the cultivators is about ₹1 crore compared to ₹1.79 crore and ₹1.25 crore in Punjab and Haryana respectively. The value of assets of non-cultivators is about ₹26 lakh compared to ₹17 lakh and ₹18 lakh in Punjab and Haryana respectively. Overall, at ₹27 lakh per household the average rural asset holding in Kerala is close to three times the Indian average. In urban areas, the average asset holding in Kerala at ₹40 Lakhs is almost twice the national average and is way above that in Punjab (₹26 lakh) and Haryana (₹37 lakh) and slightly below that in Maharashtra (₹43 lakh). Along with asset holding, the monthly per capita consumer expenditure in rural Kerala is ₹2669 which is the highest for any State and 86% higher than the national average. The urban monthly per capita consumer expenditure at ₹3408 in Kerala is about 10% lower than that in Haryana but is about 30% higher than the national average. Along with higher levels of asset holding and per capita expenditure level of inequality has also risen in the State. Currently, inequality in per capita consumer expenditure in Kerala is one of the highest among the Indian states.
A fairly high density of population, close settlements in the low lands and coastal plains and the increasing movement towards service sector employment has seen Kerala urbanise rapidly. Kerala, in 2011 is one of the most urbanised Indian states. Rapid urbanisation calls for greater investment in transportation, housing, sewerage, drinking water and waste management. All this calls for vast improvements in the efficiency of public expenditure, especially, when the fiscal health of the State is not in good shape.
Section 1
Demography
The Census of 2011 counted Kerala’s population at 3,34,06,061. Out of this population 1,60,27,412 (48 per cent) are males and 1,73,78,649 (52 per cent) are females. In the last census in 2001, the population was 3,18,41,374; 1,54,68,614 (48.6 per cent) males and 1,63,72,760 (51.4 per cent) females.
1.2 The growth rate of Kerala’s population during the last ten years is 4.9 per cent, the lowest rate among Indian states. Figure 1.1 shows that the national rate of growth of population during the period 2001-2011 is 17.64 per cent. The population growth trend shows that Kerala is moving towards zero population growth or towards negative growth. Among the districts Malappuram has the highest growth rate of 13.4 per cent, and Pathanamthitta has the lowest growth rate (-3.0 per cent). Idukki also has a negative growth rate (-1.8 per cent). The growth rate of population is low in six southern districts (Idukki, Kottayam, Alappuzha, Kollam, Pathanamthitta and Thiruvananthapuram) of the State.
Fig 1.1
Decadal Growth of Population in India and Kerala 1901-2011

Source: Census of India 2011
1.3 The child population (0-6 years) in Kerala shows a declining trend. Census data reveals a negative growth rate of the child population in the State (-8.44 per cent). Kerala’s total child population in 2011 is 3472955 compared to 3793146 in 2001 census. Figure 1.2 presents a visual of child population in the districts of Kerala in 2001 and 2011. The highest proportion of child population is in Malappuram district and the lowest proportion is in Pathanamthitta district. The proportion of child population has decreased from 12% in 2001 to 10% 2011 in the State. The decreasing trend is seen in all the districts. The southern districts of Kerala show 2% decline except Kollam which reports a decline of 1% in the proportion of child population. All the northern districts of Kerala show 1% decline in the proportion of child population, except Wayanad which reports a decline of 2%. It shows that new addition to population in northern districts is faster than in the southern districts. Details are in Appendix 1.1
Fig 1.2
Child Population in Kerala ( % )
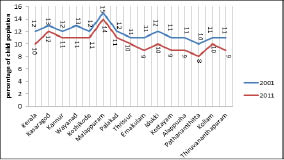
Source: Census of India 2011
Literacy
1.4 Kerala has the highest effective literacy rate of 94 per cent among Indian states as per 2011 census. It was 90 per cent during 2001 census. Kottayam tops in the literacy chart with 97.2 per cent and Pathanamthitta is just behind with 96.5 per cent. Wayanad has the lowest literacy rate of 89 per cent and Palakkad is just above with 89.3 per cent. Even the lowest literacy rate of Wayanad is higher than national rate of literacy (72 per cent). The difference between the lowest and the highest value is just 8.2. As compared to 2001, literacy rate of all the districts has improved. Details are in Appendix 1.1.
Sex Ratio
1.5 The sex ratio ( number of females per thousand males ) of Kerala according to census 2011 is 1084 and has improved by 26 points from 2001. Sex ratio of India is 943 as per census 2011.
1.6 Among the districts, Kannur has the highest sex ratio (1136) followed by Pathanamthitta (1132). While Idukki has the lowest ratio (1006), Ernakulum is just above with 1027. All the districts have the ratio above 1000. The difference between the lowest (Idukki-1006) and highest (Kannur-1136) is 130 points. Details are in Appendix 1.2.
Child Sex Ratio (0-6 Years)
1.7 Child sex ratio (number of females per 1000 males) in Kerala is 964 as per the 2011 census. It was 960 in 2001. Pathanamthitta reports the highest ratio (976) followed by Kollam (973) and Kannur (971). While, Thrissur has the lowest ratio of 950, Alappuzha is just above with the ratio of 951. Considering that the biological level sex ratio at birth is around 105 male births per 100 female births and that it is not invariant, the variations observed across the districts may be the effect of natural selection processes. When analysing the decadal change, the highest gain is for Kollam (13) and Kozhikode followed with a score of 10. All other districts have the score below 10 points. Thrissur (-8), Idukki (-5) and Alappuzha (-5) have negative decadal change in sex ratio. Details are in Appendix 1.2.
Density of Population
1.8 Kerala’s density of population as per 2011 census is 860 persons / sq. km. It is much higher than that of India (382). Thiruvananthapuram is the most densely populated district (1508) and Idukki is the least densely populated district (255). Density of population has increased in all districts compared to 2001 except for Pathanamthitta (-16) and Idukki (-4) where it has declined. Details are in Appendix 1.1.
Age Group Distribution
1.9 The demographic transition of Kerala during the last six decades has resulted in major changes in the composition of population. It is observed that the proportion of population in the age group of (0-14 years), has declined from 43% in 1961 to 23% in 2011. In the case of working age group (15-59 years), there is an increasing trend with slow growth rate. However, due to the increasing life expectancy and availability of health facilities, the proportion of population in the old age group (60 years and above) is showing an increasing trend from 6% in 1961 to 13% in 2011(See Fig 1.3). It may be observed that the addition to the working age group (15-59 years) has become smaller as the feeder category (0-14 years) is diminishing. Moreover, proportion of the old age dependent group (60 years and above) has increased which will entail higher social security expenditure by government.
Fig 1.3
Age Group Distribution (percentage) Kerala 1961-2011
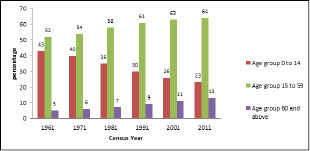
Source : Census 1961,1971,1981,1991,2001,2011
Section 2
Urbanisation in Kerala
1.10 According to the World Population Report 2007, by 2030, 40.76% of India’s population is expected to reside in urban areas. As per World Bank, India along with China, Indonesia, Nigeria, and the United States will lead the world’s urban population surge by 2050. At current rates of growth, urban population in India will reach a staggering total of 575 million by 2030.In 2011,as many as 52 cities in India had population of a million plus and the total urban population in India is 377 million, ie. 31.2% of the total population lives in 7935 towns. In recent years, the urban sector in India has undergone a major change following the country’s transition towards a market based economy.
1.11 Urbanisation as measured by the share of urban population has shown a sharp increase from 25.96% in 2001 to 47.72% in 2011 in Kerala. Corresponding levels for India were 25.52% in 2001 and 31.16% in 2011. The Urban Sector of Kerala consists of 6 Municipal Corporations and 87 Municipalities. Among the states, Kerala has undergone highest level of urbanisation in its history during 2001-2011 with an increase of 83.82% in its urban population. Kerala, positioned 19th in terms of the level of urbanisation among the states of India as per the 2001 Census came to be ranked 9th in 2011. Ernakulam (68.1%) is the most urbanised district of Kerala and Wayanad (3.9%) the least urbanised. Details of urban and rural population in Kerala are given in Appendix 1.3.
1.12 The trend of urbanisation in Kerala shows some peculiarities. Generally, increase in the rate of urban population is the result of over concentration of population in the existing cities especially in metropolitan cities. But in Kerala, the main reason for the growth of urban population is the increase in the number of urban areas and also urbanisation of the peripheral areas of the existing major urban centres. Barring a few Panchayaths in the hilly tracks and a few isolated areas here and there, the entire State depicts the picture of an urban – rural continuum. It is very difficult to demarcate the urban and rural areas in the State since the features in rural and urban areas are almost alike.
1.13 In Kerala the population has settled all along the transportation routes in non-nucleated settlements wherever there are community facilities such as schools, administration and market centres. The geographical features, availability of sub soil water, climatic factors, easy access to transportation corridors and the socio economic factors etc. have contributed to the development of a dispersed settlement pattern in the State. The effectiveness of investments in infrastructure development and social services is considerably reduced since the scarce resources are spread too thinly throughout Kerala and the accruing benefit is only marginal.
Section 3
Income
1.14 The Gross National Income (GNI) of India at 2011-12 prices is estimated at ₹10513163 crore during 2014-15, as against the previous year’s estimate of ₹9800813 crore (Table 1.1). The gross national income is estimated to have risen by 7.27 per cent during 2014-15, in comparison to the growth rate of 6.85 per cent in 2013-14. GNI at current prices is estimated at ₹12383908 crore during 2014-15, as compared to ₹11205169 crore during 2013-14 showing a rise of 10.5 per cent. The Net National Income (NNI) at current prices is estimated at ₹11117615 crore during 2014-15, as compared to ₹10056523 crore during 2013-14, showing a rise of 10.6 per cent. Details are given in Table 1.1.
1.15 GDP at constant (2011-12) prices in the year 2014-15 is estimated at ₹10643983 crore showing a growth rate of 7.3 per cent over the estimates of GDP for the year 2013-14 of ₹9921106 crore. GDP at current prices in the year 2014-15 is estimated at ₹12541208 crore showing a growth rate of 10.5 per cent over the estimates of GDP for the year 2013-14 of ₹11345056 crore. The per capita GDP in real terms (at 2011-12 prices) during 2014-15 is estimated at ₹84009 as against ₹79305 in 2013-14, registering an increase of 5.9 per cent during the year. The per capita GDP at current prices is estimated at ₹98983 in 2014-15 as against ₹90688 for the previous year depicting a growth of 9.1 per cent.
Table 1.1
National Income, Domestic Product & Per Capita Income at 2011-12 Prices and Current prices (All India)
(₹ crore)
Sl No
|
Item |
At 2011-12 Prices |
At Current Prices |
||||
2012-13 (NS) |
2013-14 (NS) |
2014-15 (PE) |
2012-13 (NS) |
2013-14 (NS) |
2014-15 (PE) |
||
1 |
Gross National Income (GNI) |
9172925 |
9800813 (6.85) |
10513163 (7.27) |
9871777 |
11205169 (13.5) |
12383908 (10.5) |
2 |
Net National Income (NNI) |
8193427 |
8751834 (6.82) |
9388992 (7.28) |
8841733 |
10056523 (13.7) |
11117615 (10.6) |
3 |
Gross domestic product (GDP) |
9280803 |
9921106 (6.9) |
10643983 (7.3) |
9988540 |
11345056 (13.6) |
12541208 (10.5) |
4 |
Net domestic product (NDP) |
8301305 |
8872127 (6.9) |
9519811 (7.3) |
8958496 |
10196410 (13.8) |
11274915 (10.6) |
5 |
Per capita Gross domestic product (₹) |
75148 |
79305 (5.5) |
84009 (5.9) |
80879 |
90688 (12.1) |
98983 (9.1) |
6 |
Per capita Net domestic product (₹) |
61217 |
70920 (5.51) |
75136 (5.95) |
72538 |
81506 (12.36) |
88989 (9.18) |
Note: The figures in Parenthesis shows the percentage change over previous year.
NS- New Series Estimate, PE- Provisional Estimate
1.16 The details of GDP, NDP, GNI and NNI at current and constant (2011-12) prices from 2011-12 to 2014-15 with percentage change over previous year are given in Appendix 1.4, 1.5, 1.6 and 1.7. The sectoral distribution of GVA at constant (2011-12) prices and current prices with percentage change over previous year is given in Appendix 1.8 and Appendix 1.9.
State Income
1.17 The Ministry of Statistics & Programme Implementation has released the new series of national accounts. There are some conceptual differences between the key aggregates of national accounts published till 2014-15 at 2004-05 base year prices and 2011-12 base year prices being published now. The new series follows System of National Accounts (2008) standards to a large extent. GDP at factor cost has been replaced by Gross Value Added (GVA) at basic prices and GDP at market prices is now termed GDP (Box 1.1).
Box 1.1
Base Year Change and Growth Rates
Base year has been revised in the computation of national accounts statistics from 2004-05 to 2011-12. Some concepts have also undergone changes following the adoption of System of National Accounts (2008) partly. Gross Domestic Product (GDP) at constant market prices will henceforth be known as GDP and Gross Value Added at basic prices will replace GDP at factor cost. The relation between the two is: GVA at basic prices = GVA at factor cost + production taxes less production subsidies. GDP and GVA at basic prices bear the following relationship: GDP = GVA at basic prices + product taxes - product subsidies.
Production taxes or production subsidies are paid or received with relation to production and are independent of the volume of actual production. Some examples of production taxes are land revenues, stamps and registration fees and tax on profession. Some production subsidies are subsidies to Railways, input subsidies to farmers, subsidies to village and small industries, administrative subsidies to corporations or cooperatives, etc. Product taxes or subsidies are paid or received on per unit of product. Some examples of product taxes are excise tax, sales tax, service tax and import and export duties. Product subsidies include food, petroleum and fertilizer subsidies, interest subsidies given to farmers, households, etc. through banks, and subsidies for providing insurance to households at lower rates.
Comprehensive coverage of the corporate sector in manufacturing, services and the financial sector by inclusion of information from the accounts of stock brokers, stock exchanges, asset management companies, mutual funds and pension unds, and the regulatory bodies has led to changes in the estimates of GVA both at aggregate and sectoral levels. The sector-wise shares in aggregate GVA in Kerala have also undergone significant revision. Consequent to changes in weights and growth rates of sectors the aggregate growth rates too have changed. As may be seen below the growth rate of GVA in Kerala has shown a decline in 2013-14 and 2014-15. While there was a marginal increase in growth rate in 2012-13 from 5.92 per cent to 5.97 per cent, the next two years witnessed significant decreases- from 6.27 per cent to 4.34 per cent in 2013-14 and from 6.82 per cent to 6.20 per cent in 2014-15.
Growth Rates (%) of GVA, Kerala: Effect of Base Change |
|||
2012-13 |
2013-14 |
2014-15 |
|
| Kerala, Base 2004-05 | 5.92 |
6.27 |
6.82 |
| Kerala, Base 2011-12 | 5.97 |
4.34 |
6.20 |
Such changes in aggregate growth rates have come about owing to the change in the weights of sectors and change in the sectoral growth rates. The change in the base year has resulted in the weight of primary sector in 2011-12 increasing from 10.41 per cent (at 2004-05 prices) to 15.21 per cent (2011-12 prices); in industry the corresponding rise was from 21.63 per cent to 27.43 per cent; and tertiary sector showed a corresponding fall from 67.96 per cent to 57.46 per cent. Sectoral growth rates too have changed because of the change of base. For instance in year 2013-14, primary sector growth rate fell from -1.96 per cent to -2.97 per cent, secondary sector growth rate from 1.34 per cent to 1.20 per cent and tertiary sector growth rate from 8.95 per cent to 7.60 per cent. Thus the decline in the GVA growth rate from old base to new base of 1.93 percentage point (6.27- 4.34) is accounted for by change in sectoral growth rates of 1.15 per cent and change in weights of 0.78 per cent.
The Indian growth rates too changed consequent to the change in the base. In the Indian case too in 2012-13 the change was marginal- from 4.7 per cent to 5.1 per cent; but 2013-14 saw a big jump from 5.00 per cent to 6.9 per cent. While the direction of change in the case of India is opposite to that of Kerala, the reasoning is more or less the same.
Growth Rates (%) of GVA, India: Effect of Base Change |
|||
2012-13 |
2013-14 |
2014-15 |
|
India, Base 2004-05 |
4.7 |
5.0 |
5.6 |
India, Base 2011-12 |
5.1 |
6.9 |
7.3 |
The change in the share of the three sectors consequent to the shifting of the base at the all-India level is comparable to that of Kerala: share of primary sector increased from 17.9 per cent to 18.7 per cent, share of secondary sector from 26.1 per cent to 31.7 per cent and share of tertiary sector dropped from 56.1 per cent to 49.6 per cent. The sectoral growth rate of manufacturing in the year 2013-14Q2 with the old series was 1 per cent which increased to 3.8 per cent with the new series; trade and hotel showed an increase from 4 per cent to 11.9 per cent and communication from 7 per cent to 9.1 per cent; and agricultural growth hardly changed. And the GDP growth rate increased from 5 per cent to 6.9 per cent as the fall in the share of tertiary sector was more than compensated by the rise in manufacturing, unlike in Kerala.
GDP growth rates came to be revised in opposite directions despite the sectoral weights changing in a comparable manner. The main reason for such a change is that in Kerala the sectors which gained more weight reported poorer growth rates- agriculture a severe strain on Kerala- whereas it did not happen in the case of India. In the Indian case the weight of manufacturing went up so too its growth rate.
1.18 The quick estimate of Gross State Domestic Product (GSDP) at constant (2011-12) prices is ₹43236140 lakh during 2014-15 as against the provisional estimate of ₹40530850 lakh during 2013-14, registering a growth rate of 6.67 per cent in 2014-15 compared to 4.54 per cent in 2013-14 (Figure 1.4). At current prices the Gross State Domestic Product is estimated at ₹51989585 lakh (quick estimate) during 2014-15 as against the provisional estimate of ₹46291606 lakh during 2013-14.
Fig 1.4
Growth Rate of GSDP at Constant (2011-12) Prices – Kerala

Source: Department of Economics and Statistics
1.19 The quick estimate of Net State Domestic Product (NSDP) at constant prices (2011-12) is ₹39176307 lakh during 2014-15 compared to the provisional estimate of ₹36588661 lakh during 2013-14, recording a growth rate of slightly above 7.0 per cent in 2014-15. At current prices the NSDP is estimated at ₹47052306 lakh (quick estimate) in 2014-15 compared to the provisional estimate of ₹41804353 lakh during 2013-14. The growth rate of NSDP at current prices is 12.55 per cent in 2014-15 compared to 12.56 per cent in 2013-14 (Table 1.2).
Table 1.2
State Domestic Product and Per Capita Income of Kerala
Sl No
|
Item |
Income (₹ Lakhs) |
Growth Rate (Per cent) |
|||
2012-13 |
2013-14 (P) |
2014-15 (Q) |
2013-14 (P) |
2014-15 (Q) |
||
1 |
Gross State Domestic Product |
|||||
|
a) At Constant (2011-12) prices |
38769346 |
40530850 |
43236140 |
4.54 |
6.67 |
|
b) At Current prices |
41231300 |
46291606 |
51989585 |
12.27 |
12.31 |
2 |
Net State Domestic Product |
|||||
|
a) At Constant (2011-12) prices |
34861581 |
36588661 |
39176307 |
4.44 |
7.07 |
|
b) At Current prices |
37138412 |
41804353 |
47052306 |
12.56 |
12.55 |
3 |
Per Capita GSDP (₹) |
|||||
|
a) At Constant (2011-12) Prices |
115158 |
119799 |
127166 |
4.03 |
6.15 |
|
b) At Current Prices |
122471 |
136827 |
152912 |
11.72 |
11.75 |
4 |
Per Capita NSDP (₹) |
|||||
|
a) At Constant (2011-12) Prices |
103551 |
108147 |
115225 |
4.44 |
6.54 |
|
b) At Current Prices |
110314 |
123564 |
138390 |
12.01 |
11.99 |
Source: Department of Economics and Statistics
P: Provisional Estimate, Q: Quick Estimate
Per Capita State Income
1.20 As per the quick estimates, the per capita Gross State Domestic Product at constant (2011-12) prices in 2014-15 was ₹127166 as against provisional estimate of ₹119799 in 2013-14, recording a growth rate of 6.15 per cent in 2014-15. At current prices, the per capita GSDP in 2014-15 was ₹152912 compared to ₹136827 in 2013-14. The best indicator of per capita state income is NSDP divided by the population. At constant (2011-12) prices, the quick estimates of per capita Net State Domestic Product in 2014-15 was ₹115225 as against provisional estimate of ₹108147 in 2013-14, recording a growth rate of 6.54 per cent in 2014-15. Fig 1.5 shows that during the period 2012-13 to 2014-15, the per capita state income at constant prices was higher than the per capita national income by over 50 per cent.
Fig 1.5
Per Capita State Income at Constant Prices

Source: Central Statistics Office and Department of Economics and Statistics
Sectoral Distribution of Gross State Value Added
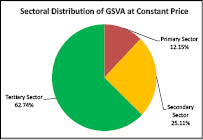
1.21 During 2014-15, the contribution from primary, secondary and tertiary sectors to the GSVA at constant prices (2011-12) was 12.15 per cent, 25.11 per cent and 62.74 per cent respectively. At current prices, the primary, secondary and tertiary sectors contributed 12.91 per cent, 24.81 per cent and 62.28 per cent respectively to the GSVA during 2014-15 (Fig. 1.6). This difference in sectoral share between constant and current prices shows that inflationary trends in the primary sectors are much higher than in the secondary and tertiary sector.
Fig 1.6
Sectoral Distribution of GSVA 2014-15 at Basic Prices
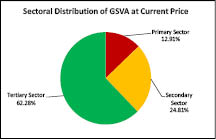
1.22 While analysing the sectoral distribution of state income for the year 2014-15, it is seen that the contribution from primary sector and secondary sector are decreasing. But tertiary sector is showing an increase to 62.75 per cent from 60.89 per cent. The analysis of annual sectoral growth rate of Gross State Valued Added shows that tertiary sector recorded the highest rate of growth 9.42 per cent in 2014-15 at constant (2011-12) prices followed by secondary sector (3.74 per cent) and primary sector showed a negative growth rate of -3.86 per cent. The driving factor for the growth of the tertiary sector is mainly the growth in storage, trade, hotels and restaurant which is showing an increase of 14.72 per cent in 2014-15 compared to 7.10 per cent in 2013-14. Negative growth in agriculture is generally because of the decrease in production of some of the cash crops like pepper, turmeric, cashew, tea, coffee and rubber. At current prices, the tertiary sector recorded a growth rate of 14.43 per cent, secondary sector 9.22 per cent and primary sector with 6.13 per cent in 2014-15.
1.23 The share of primary and secondary sector has decreased during the period 2012-13 to 2014-15 and tertiary sector has increased from 59.06% to 62.75%. The details of sectoral distribution of GSVA with percentage share during the last three years is given in Appendix 1.10, 1.11 and 1.12 and the details of GSDP, NSDP at constant and current prices during 2011-12 to 2014-15 are given at Appendix 1.13, 1.14, 1.15 and 1.16.
District-wise Gross State Value Added
1.24 District wise distribution of Gross State Value Added at basic prices at current prices shows that Ernakulam District continues to have the highest income of ₹7308907 lakhs in 2014-15 as against ₹ 6494347 lakhs in 2013-14 registering a growth rate of 12.54 per cent. At constant (2011-12) prices, this amounts to ₹6081130 lakhs during 2014-15 compared to ₹5680292 lakhs during 2013-14. The district wise details are given in Table 1.3.
Table 1.3
District-wise Distribution of Gross State Value Added
Sl. No |
District Name |
Gross State Value Added at Basic Price (₹ Lakhs) |
|||||
At Current Prices |
At Constant Prices |
||||||
2013-14 (P) |
2014-15 (Q) |
Growth Rate (%) |
2013-14 (P) |
2014-15 (Q) |
Growth Rate (%) |
||
1 |
Thiruvananthapuram |
4906613 |
5531521 |
12.74 |
4241687 |
4521768 |
6.60 |
2 |
Kollam |
3888801 |
4315970 |
10.98 |
3330426 |
3557257 |
6.81 |
3 |
Pathanamthitta |
1263905 |
1342681 |
6.23 |
1149559 |
1164054 |
1.26 |
4 |
Alappuzha |
2861282 |
3213578 |
12.31 |
2452281 |
2629840 |
7.24 |
5 |
Kottayam |
2569349 |
2756034 |
7.27 |
2362638 |
2407431 |
1.90 |
6 |
Idukki |
1632253 |
1903017 |
16.59 |
1481562 |
1598774 |
7.91 |
7 |
Ernakulam |
6494347 |
7308907 |
12.54 |
5680292 |
6081130 |
7.06 |
8 |
Thrissur |
3912802 |
4362645 |
11.50 |
3368596 |
3586517 |
6.47 |
9 |
Palakkad |
2912365 |
3246376 |
11.47 |
2540318 |
2703804 |
6.44 |
10 |
Malappuram |
3885258 |
4434668 |
14.14 |
3358850 |
3611899 |
7.53 |
11 |
Kozhikode |
3311731 |
3730678 |
12.65 |
2829553 |
3004196 |
6.17 |
12 |
Wayanad |
785409 |
887882 |
13.05 |
686640 |
730581 |
6.40 |
13 |
Kannur |
3075895 |
3448484 |
12.11 |
2698704 |
2845478 |
5.44 |
14 |
Kasaragod |
1138820 |
1299119 |
14.08 |
999819 |
1044070 |
4.43 |
|
GSVA |
42638831 |
47781562 |
12.06 |
37180927 |
39486797 |
6.20 |
Source: Department of Economics and Statistics
P: Provisional Q:Quick
District-wise Per Capita Income
1.25 Growth of incomes at current prices confounds the effects of real income growth and price changes. Real NSDP is arrived at by eliminating the effect of price changes.
1.26 The analysis of district per capita income shows that Ernakulam stands at the top with the per capita income of ₹161472 at constant (2011-12) prices in 2014-15 as against ₹151210 in 2013-14. The district wise per capita income with corresponding rank and growth rate is given in Table 1.4.
Table 1.4
District-wise Per Capita Income at Basic Price-Constant (2011-12) Prices
Sl. No. |
District |
2013-14 (P) |
Rank |
2014-15 (Q) |
Rank |
Growth Rate (%) |
1 |
Thiruvananthapuram |
114495 |
3 |
122030 |
3 |
6.58 |
2 |
Kollam |
113369 |
4 |
121251 |
4 |
6.95 |
3 |
Pathanamthitta |
84900 |
9 |
87111 |
9 |
2.60 |
4 |
Alappuzha |
104243 |
6 |
111674 |
5 |
7.13 |
5 |
Kottayam |
104424 |
5 |
107622 |
6 |
3.06 |
6 |
Idukki |
114708 |
2 |
124298 |
2 |
8.36 |
7 |
Ernakulam |
151210 |
1 |
161472 |
1 |
6.79 |
8 |
Thrissur |
96647 |
7 |
102552 |
7 |
6.11 |
9 |
Palakkad |
79552 |
11 |
84461 |
11 |
6.17 |
10 |
Malappuram |
71727 |
13 |
76467 |
13 |
6.61 |
11 |
Kozhikode |
82243 |
10 |
86919 |
10 |
5.69 |
12 |
Wayanad |
72909 |
12 |
77593 |
12 |
6.43 |
13 |
Kannur |
93906 |
8 |
98960 |
8 |
5.38 |
14 |
Kasaragod |
65216 |
14 |
67579 |
14 |
3.62 |
|
STATE |
98246 |
|
104198 |
|
6.06 |
Source: Department of Economics and Statistics
P: Provisional Q: Quick
1.27 Table 1.4 reveals that the districts Alappuzha, Idukki, Ernakulam, Thiruvananthapuram, Kollam, Malappuram, had much higher growth rates than the average growth in per capita income in 2014-15. However, the districts of Pathanamthitta, Kottayam, Kasaragod and Kannur showed lower growth in per capita income than the state average.
1.28 District wise and sector-wise analysis of GSVA reveals that contribution of Ernakulam in primary, secondary and tertiary sectors is the highest. District-wise sectoral distribution of Gross State Value Added from 2012-13 to 2014-15 at current and constant (2011-12) prices are given in Appendix 1.17, 1.18, 1.19, 1.20, 1.21 and 1.22.
Section 4
Poverty
1.29 Poverty is a complex and multifaceted issue which requires numerous activities to be carried out simultaneously to deal with the problem effectively and efficiently. According to the Nobel laureate Professor Amartya Sen “Poverty is not just a lack of money; it is not having the capability to realize one’s full potential as a human being”. The World Development Report (2000) identifies three priority areas for reducing poverty: increasing opportunity, enhancing empowerment and improving security. Opportunity makes markets work for the poor and expands poor people’s assets, empowerment makes state institutions work better for poor people and removes social barriers and security helps poor people manage risk*.
1.30 Kerala’s approach put human development at its centre - it emphasised education and health; upheld gender parity; channelled public funds to schools, hospitals and infrastructure. Individual resources too were directed into areas such as private expenditure on health and education as well as to build health and educational institutions. These broad based policies and investments aimed at the ‘equitable provision’ of public services is the foundation of the celebrated ‘high human development at low per capita income’. This ‘support led’ strategy has also been at the base of the poverty reduction in the State.
1.31 The success of Kerala in poverty reduction is reflected in the sharp reduction in the proportion of poor as shown in Table1.5.
Table 1.5
Proportion of Poor in India and in Kerala, 1973-74 to 2011-12**
Year |
Kerala |
India |
||
Rural |
Urban |
Rural |
Urban |
|
1973-74 |
59.19 |
62.74 |
56.44 |
49.01 |
1977-78 |
51.48 |
55.62 |
53.07 |
45.24 |
1983 |
39.03 |
45.68 |
45.65 |
40.79 |
1987-88 |
29.10 |
40.33 |
39.09 |
38.20 |
1993-94 |
25.76 |
24.59 |
37.27 |
32.36 |
1999-2000 |
9.38 |
20.27 |
27.09 |
23.62 |
2004-05 |
13.20 |
20.20 |
28.30 |
25.70 |
Rangarajan Committee Method |
||||
2009-10 |
9.7 |
23.7 |
39.6 |
35.1 |
2011-12 |
7.3 |
15.3 |
30.9 |
26.4 |
Source: Rangarajan Committee Report (Lakdawala Methodology is used from 1973-74 to 2004-05)
1.32 The challenge before Kerala is to bring it down further and continue the numerous programmes which have made the achievement possible.
1.33 Various strategies adopted by Kerala for alleviating poverty are:
(i) Providing subsidised food to the multitudes of population through universal Public Distribution System (PDS).
(ii) Meeting basic amenities and building capabilities: Poverty also means deprivation of basic amenities, such as housing, sanitation, and water supply. Government had initiated many schemes over a long period to provide these amenities. Panchayati Raj Institutions have continued many of these schemes with renewed vigour.
(iii) Access to credit through the Kudumbashree Programme initiated in 1998 which acts as an informal “bank of the poor”.
(iv) Social security: Assistance to various categories of workers in the informal sector both in agriculture and non-agricultural occupations, cutting across rural-urban and gender differences has been offered through the Welfare Fund Model.
(v) Pension Programme: In the 1980s pensions were introduced for different categories of population groups.
(vi) Social support to the physically challenged: Kerala has gone beyond the affirmative action in government departments by offering employment to the physically challenged as lottery agents and in other similar avenues.
1.34 Various schemes on Poverty Reduction have been dealt with in other chapters of the Review. The participatory decentralized governance is the key instrument for broad based poverty elimination. Eventhough Kerala has made considerable progress in eradicating poverty, there are still several pockets of deprivation in the State, for example among tribal population and fishermen communities. Greater central assistance and appropriate livelihood programmes in these pockets are required to ensure that poverty is reduced throughout the State. More details about Kudumbashree Mission and poverty alleviation programmes are given in Chapter II of the Review.
Section 5
Prices
1.35 In the Indian context, inflation was a major concern of policy makers during 2010-13, especially the persistent high inflation in food and food products. However, from 2014-15, there has been a secular decline in price indices. The reasons for this decline included measures taken by the Government for improving food supply management and persistent decline in global crude oil and commodity prices.
1.36 There has been significant easing of food inflation during the first half of 2014-15 to 6 per cent which further declined to 2.5 per cent in October 2014. WPI food inflation which was a matter of concern in the last few years turned negative in the second quarter of 2015-16 as compared to 5 per cent in the corresponding period last year. The annual rate of inflation based on monthly WPI, stood at, 3.81% (provisional) for the month of October,2015 (over October,2014) as compared to -4.5% (provisional) for the previous month and 1.66% during the corresponding month of the previous year.Inflation in the prices of food articles rose to 5.2 per cent in November 2015 from 2.4 per cent in the preceeding month. This is the third consecutive month of year on year rise in prices of food articles. Fuel& Power group recorded a fall in year on year prices to the tune of 11.1 per cent in November 2015, thus marking the fifth consecutive month of double-digit-deflation. This fall was on the back of year on year fall in prices of petrol and high-speed diesel. Prices of Manufacturing Products recorded a deflation of 1.4 per cent in November 2015 compared to 1.7 per cent in the previous month. As a whole,WPI inflation came down to 2 per cent in 2014-15 from 6 per cent in 2013-14. It has remained negative since November 2014, and averaged (-)3.5 per cent in 2015-16 (Apr-Oct).The fall was on account of fall in the prices of textiles, chemicals &chemical products and basic metals,alloys & metal products.Consumer Price Index (CPI-New Series) inflation, though higher than WPI, also exhibits a similar pattern in 2014-15. CPI-NS inflation for 2014-15 declined to 5.91 from 9.51 in 2013-14. Inflation in terms of Consumer Food Price Index (CFPI) has also come down to 5.2% in October 2015 from 6.9% in February 2015.
1.37 Inflation based on CPI-Industrial Workers for September 2015 stood at 5.1% compared to 7.2% in January 2015. CPI-Agriculture labour and CPI Rural labour based inflation declined to 3.5% and 3.7% respectively in September 2015 compared to 6.2% and 6.5% in January 2015.
1.38 In Kerala, price structure of the essential commodities especially vegetables and meat increased exorbitantly due to inadequate domestic production and supply of these products. Agricultural production has shrunk and demand of the State is met from the neighbouring states like,Tamil Nadu and Karnataka.
Price Index
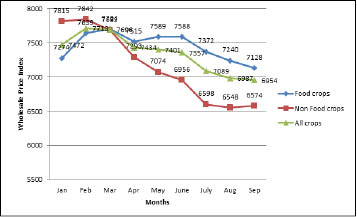
1.39 Wholesale Price Index (WPI) of Food Crops increased to 8021.44 in 2014 from 4999.73 in 2010 and it declined to 7455.33 in September 2015. The reason for decline in of WPI of food crops in 2015 is because price of rice, condiments and spices have reduced by 5 per cent and 1 per cent respectively. On the other hand WPI of Non-Food Crops has increased by 2.4 per cent in 2015 over the previous year. Altogether, WPI of all food crops has fallen by 3.9 per cent from 7642.57in 2014 to 7345.37 in 2015. The Details of Wholesale Price Index of Agricultural Commodities in Kerala are in Appendix 1.23. The details of month wise wholesale Price index of food ,non-food and all crops are given in Appendix 1.24 and Figure 1.7.
1.40 The Consumer Price Index (CPI) ofAgricultural and Industrial workers in Kerala increased to 275 in September 2015 from 263 of the previous year. Eventhough,prices increased, the rate of inflation decreased considerably in 2014 and 2015. Consumer Price Inflation in 2015 was 4.56 per cent against 8.68 per cent in 2014.State wide inflation based on CPI was 12 basis points between 2014 and 2015.Centre wise analysis shows that CPI in Pathanamthitta, increased to 296 in 2015 from 283 in 2014 and the percentage of inflation registered in 2015 is 4.59. CPI of Mundakayam was 287 in 2015 against 275 in the previous year. Meppady in Wayanad registered the highest inflation percentage of 6.48 in Kerala in 2015 followed by Kannur and Ernakulam. Thrissur reported the lowest CPI in Kerala, at 255 and the percentage of inflation is also low at 3.19 in 2015. In Thiruvananthapuram, the rate of inflation is only 4.48 per cent in 2015 against 9.69 per cent in 2014. For all the centres, Consumer Price Index and percentage variation of inflation is shown in Appendix 1.25.
1.41 The prices of essential commodities in Kerala from January 2015 to November 2015 (Appendix.1.26) reveal a mixed pattern. Price of green gram per kg has gone up to ₹113.24 in October 2015 from ₹95 during the same month in 2014. Likewise, price of black gram has also gone up to about 90 per cent in November 2015 over the previous year.The prices of dry chilly, onion, vegetables etc have also increased considerably.
Fig 1.7
Month wise Wholesale Price Index of Food, Non food and all Crops in 2015
Source: Economics and Statistics Department, Government of Kerala
Price Parity
1.42 The index refers to the relationship between price received by farmers for their sales and the prices paid by them for their purchases. During 2015, farm expenses (index of price paid by farmers) increased to12008.83 from 11477.67 in 2014. Meanwhile, price received by farmers (income by the farmers) decreased to 7822.67 in 2015 from 8272.25 in 2014. Farm expenses like cultivation cost, transportation cost, etc increased by 531.16 (4.63%) in 2015. On the other hand, income of the farmers reduced by 449 (-5.7%). The details of Price received and price paid by farmers since 2005 is depicted in Appendix 1.27.
Wages
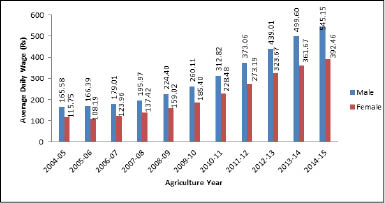
1.43 Wage rates of the skilled and unskilled workers in Kerala have increased every year since 2004-05. In case of skilled workers, average daily wage rate of carpenter has increased to ₹705.08 in 2014-15 compared to ₹644.92 in the previous year.Average daily wage rate of mason has also increased to ₹707.75 in 2014-15 from ₹635.08 in 2013-14. Average daily wage rates of skilled workers is givenin Appendix 1.28. The Average Daily Wage Rates of Unskilled Workers in the agricultural sector have also increased. In 2014-15 average daily wage rate of male Paddy Field Workers was ₹545.15 against the ₹499.6 in 2013-14. The wage rate of female workers was ₹392.46 and ₹361.67 respectively during the two yea₹ Average Daily Wage Rate of unskilled workers in the agriculture sector(Paddy field) can be seen in Appendix 1.29 and Figure 1.8.
Fig 1.8
Average Daily Wage Rates of Unskilled Workers in the Agricultural Sector
Source: Economics and Statistics Department, GoK
Section 6
State Finances
1.44 The State Government enacted the Kerala Fiscal Responsibility Act in 2003 to ensure prudence in fiscal management and fiscal stability by progressive elimination of revenue deficit. In the years that followed enactment of the Kerala Fiscal Responsibility Act in 2003 improvement has been witnessed in key fiscal indicators of the State. The revenue deficit which was 4.37 per cent of GSDP in 2002-03 came down to 1.36 per cent in 2010-11. State’s fiscal consolidation largely relied on revenue receipts. Deterioration in the buoyancy in revenue receipts due to multiple reasons in recent years has adversely affected State’s fiscal performance in achieving the fiscal consolidation targets.
1.45 In pursuant to the State’s commitment towards fiscal consolidation, the Budget Estimates 2014-15 envisaged a Revenue Deficit target of 1.53 per cent of GSDP. However severe domestic challenges and external compulsions had an adverse impact on the buoyancy of State revenues and government could not adhere to fiscal consolidation targets set in the budget. In 2014-15, revenue deficit was 2.78 per cent of GSDP against 2.63 per cent of 2013-14. Fiscal deficit during 2014-15 at 3.75 per cent has shown a slight improvement compared to 3.94 per cent during 2013-14. Earnest efforts are being taken for enhanced revenue generation to have better fiscal consolidation including rationalization of expenditure to achieve the fiscal targets. A long term fiscal policy would be necessary to rationalize the expenditure without compromising the quality of spending.
1.46 Even though national economy showed improvements in macro-economic stability, steady growth in State’s economy is yet to be achieved. The recent tax reform policies adopted by the State Government would likely play a crucial role in the enhancement of revenue receipts. It is expected that the implementation of Goods and Service Tax (GST) will increase buoyancy in State’s tax revenue in the coming years.
1.47 In recent years committed expenditure on account of salaries, pensions, and debt charges have increased considerably. The expenditure on salaries and pensions is likely to increase further consequent on the implementation of the 10th Pay Commission recommendations. Increased devolution to Local Self Governments (LSGs) and enhanced payments for welfare schemes and subsidies have also generated pressure on State’s finances. Fiscal constraints created by rise in revenue deficit impacted the growth in capital expenditure during 2014-15.
1.48 The major deficit indicators of the State for the period from 2009-10 to 2015-16 BE are shown in Table 1.6.
Table 1.6
Major Deficit Indicators
(₹ Crore)
Year |
Revenue Deficit |
Fiscal Deficit |
Primary Deficit(-) / Surplus (+) |
GSDP |
|||
Amount |
% to GSDP |
Amount |
% to GSDP |
Amount |
% to GSDP |
||
2009-10 |
5022.97 |
2.17 |
7871.60 |
3.39 |
-2579.12 |
-1.11 |
231998.67 |
2010-11 |
3673.87 |
1.36 |
7730.46 |
2.87 |
-2040.80 |
-0.76 |
269473.79 |
2011-12 |
8034.26 |
2.61 |
12814.77 |
4.16 |
-6521.17 |
-2.12 |
307906.00 |
2012-13 |
9351.45 |
2.46 |
15002.47 |
3.95 |
7797.66 |
2.06 |
379417.00 |
2013-14 |
11308.56 |
2.63 |
16944.13 |
3.94 |
8678.74 |
2.02 |
430211.00 |
2014-15 |
13795.96 |
2.78 |
18641.73 |
3.75 |
8872.14 |
1.79 |
496886.00 |
2015-16 BE |
7831.92 |
1.37 |
17699.25 |
3.10 |
6747.15 |
1.18 |
570523.00 |
Source: Finance Department, Goverment of Kerala
1.49 The revenue deficit shown above is net of revenue expenditure by way of grants for creation of capital assets. In the State’s context a significant portion of devolution to LSGs and grants to various autonomous bodies are intended for creation of capital assets of durable nature. The revenue deficit in 2014-15 was ₹13795.96 crore against ₹11308.56 crore in 2013-14. If an amount of ₹4983.32 crore incurred for providing grants for creation of capital assets is deducted, the effective Revenue Deficit would be ₹8812.64 crore in 2014-15, which is 1.77 per cent of GSDP. Major financial indicators of Government of Kerala are shown in Table 1.7.
Table 1.7
Financial Indicators for Government of Kerala
Particulars |
2009-10 |
2010-11 |
2011-12 |
2012-13 |
2013-14 |
2014-15 |
Balance from current Revenue (BCR) |
-2155 |
-910 |
-4973 |
-4866 |
-6694 |
-9037 |
Interest Ratio |
0.20 |
0.18 |
0.17 |
0.16 |
0.17 |
0.17 |
Capital Outlay/ Capital receipts |
0.26 |
0.43 |
0.31 |
0.29 |
0.25 |
0.23 |
Return of Investment ratio |
0.008 |
0.020 |
0.016 |
0.016 |
0.018 |
0.012 |
Outstanding Guarantees (including interest) / Revenue Receipts |
0.29 |
0.24 |
0.22 |
0.22 |
0.20 |
0.19 |
Assets/ Liabilities |
0.40 |
0.40 |
0.40 |
0.40 |
NA |
NA |
Source: Finance Department, Government of Kerala
NA : Not Available
Revenue Receipts
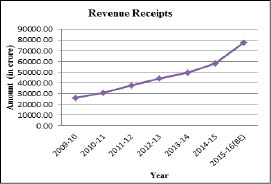
1.50 Revenue receipts of the State consist of own tax and non-tax revenues, share of central taxes and grant-in-aid from Centre. The revenue receipts of the State recorded an increase of 87 per cent during the period from 2010-11 to 2014-15. The total revenue collection during 2014-15 was ₹57950.47 crore. The revenue receipts of the State in proportion to GSDP increased marginally to 11.66 per cent in 2014-15 from 11.43 per cent in 2013-14. Growth rate of revenue receipts also showed an upward trend of 17.84 per cent in 2014-15 against 11.42 per cent in 2013-14. The trend in Revenue Receipts from 2009-10 to 2015-16 BE is given in Figure 1.9.
Fig 1.9
Trend in Revenue Receipts
Source: Finance Department, Government of Kerala
1.51 Own taxes are the main source of revenue receipts of the State. In 2014-15, contribution from State’s own taxes was ₹35232.50 crore which constituted 60.80 per cent of the total revenue collection. Contribution from the share of central taxes was ₹7926.29 crore (13.68 per cent), State’s own non-tax revenue ₹7283.69 crore (12.57 per cent) and Grants in aid received from Centre was ₹7507.99 crore (12.96 per cent) in 2014-15. The details of Revenue Receipts from 2009-10 to 2015-16 BE are given in Appendix 1.30.
State’s Own Tax Revenue (SOTR)
1.52 The main sources of State’s Own Tax Revenue (SOTR) are Sales Tax including Value Added Tax (VAT), Stamps and Registration fees, State Excise Duties, Motor Vehicle Tax and Land Revenue. The receipt from State’s Own Tax Revenue in 2014-15 was ₹35,232.50 crore, which was 92.03 per cent of the targeted revenue. Receipts from Sales Tax and VAT contributed the major share of SOTR. In 2014-15, receipts from Sales Tax and VAT contributed ₹27,908.33 crore which was 79.21 per cent of the total SOTR, followed by 7.55 per cent from Stamp duties and registration fees (₹2659.02 crore), 6.71 per cent from Taxes on Vehicles (₹2364.95 crore), 5.04 per cent from State Excise Duties (₹1777.42 crore), and 0.4 per cent from Land Revenue (₹139.03 crore).
1.53 The receipts from Sales Tax including VAT showed 12.15 per cent growth in 2014-15 against 10.55 per cent in 2013-14. The receipts from Motor Vehicle Taxes, Stamp duties and Registration fees and Land Revenue recorded a growth of 9.43, 2.53 and 56.60 per cent respectively, while State Excise Duties have recorded a negative growth rate (-8.46 per cent) in 2014-15. The details of State’s Own Tax Revenue from 2009-10 to 2015-16 BE are given in Appendix 1.31.
State’s Own Non-Tax Revenue (SONTR)
1.54 State’s own Non-Tax Revenue (SONTR) mainly consists of receipts from State Lotteries, Forest, Interest & Dividend and receipts from various social developmental services. Receipts from SONTR registered noticeable increase in the last three years. In 2014-15, ₹7283.69 crore was realized as SONTR, recording growth of 30.65 per cent over 2013-14 (₹5575.03). The receipt from State’s own non-tax revenue increased to 1.47 per cent of GSDP in 2014-15 from 1.30 per cent in 2013-14. Significant growth in non-tax revenue could be achieved mainly due to the revision of fees and fines for the services rendered by the Government.
1.55 In 2014-15, receipts from State Lotteries comes to ₹5444.88 crore recording a growth rate of 43.45 per cent. This constitutes 75 per cent of the total non-tax revenue of the State. This was followed by ₹673.09 crore from Social Developmental Services (9.2 per cent), ₹300 crore from Forest revenue (4.14 per cent) and ₹102.15 crore (1.40 per cent) from debt services. The details of State’s Own Non-Tax Revenue from 2009-10 to 2015-16 BE are given in Appendix 1.32.
Central Transfers
1.56 Central Transfers comprises of share in central taxes and grants in aid from Centre. The share of States in the net proceeds of shareable central taxes during the 13th Finance Commission period from 2010-11 to 2014-15 was 32 per cent. Out of this, State’s share was 2.34 per cent. The central transfers by way of share of central taxes and grant-in aid received was ₹15434.28 crore.
1.57 The central transfer as percentage of GSDP in 2014-15 was 3.11 per cent. Out of the total central transfers, the receipts under share in central taxes and central grants were ₹7926.29 crore and ₹7507.99 crore respectively. In 2014-15, share of central taxes witnessed growth rate of 6.13 per cent only against 9.18 per cent in 2013-14. The receipt from central grant in aid showed considerable increase in 2014-15, it increased to 81.43 per cent against the growth rate of 37 per cent in 2013-14. This substantial growth was due to the release of Central Plan Assistance through State Budget from 2014-15, which was released directly to State Implementing Agencies till 2013-14. The details of Central Transfers from 2009-10 to 2015-16 BE are given in Table 1.8.
Table 1.8
Central Transfers: 2009-10 to 2015-16 (BE)
(₹ Crore)
Year |
Share in Central Taxes & Duties |
Grant-in-aid and other receipts from Centre for Plan and Non-plan |
Total Transfers |
|||
Amount |
Annual Growth Rate (%) |
Amount |
Annual Growth Rate (%) |
Amount |
Annual Growth Rate (%) |
|
2009-10 |
4398.78 |
2.88 |
2233.38 |
-16.89 |
6632.16 |
-4.75 |
2010-11 |
5141.85 |
16.89 |
2196.62 |
-1.65 |
7338.47 |
10.65 |
2011-12 |
5990.36 |
16.50 |
3709.22 |
68.86 |
9699.58 |
32.17 |
2012-13 |
6840.65 |
14.19 |
3021.53 |
-18.54 |
9862.18 |
1.68 |
2013-14 |
7468.68 |
9.18 |
4138.21 |
36.96 |
11606.89 |
17.69 |
2014-15 |
7926.29 |
6.13 |
7507.99 |
81.43 |
15434.28 |
32.98 |
2015-16 (BE) |
13121.77 |
65.55 |
9946.28 |
32.48 |
23068.05 |
49.46 |
Source: Finance Department, Govt. of Kerala
The Fourteenth Finance Commission Awards and Kerala
1.58 The Fourteenth Finance Commission award has been acclaimed as a land mark as the recommendations made by it devolves close to 50 per cent of the divisible pool to the states. The Commission awarded 42% of the Divisible Pool (32% by the 13th Finance Commission) as tax assignment to the states. Another 6.84% has been awarded as grants-in-aid under Article 275(I). The devolution formula has been changed to include the 2011 population and for the first time, forest cover has come into the horizontal share formula recognizing the importance of environmental sustainability.
1.59 The horizontal shares of the states have changed significantly. While Bihar (10.917% to 9.665%), Tamil Nadu (4.969% to 4.023%) and Uttar Pradesh (19.67% to 17.959%) have seen a decline in their share of the taxes, Arunachal Pradesh (0.328% to 1.37%), Jharkhand (2.808% to 3.139%), Kerala (2.341% to 2.50%) and Madhya Pradesh (7.12% to 7.548%) have seen an increase.
1.60 As regards the increase in state’s share of central taxes, had there been no change in the inter se shares of the states, every state would have got an increase of 55% in 2015-16 over 2014-15. Thus any deviation from 55% would point to gains or losses of the states. The states that receive less than the average of 55% are the losers. The largest gains have been made by Goa and the north eastern states with the exception of Assam. Tamil Nadu at the other end is the worst hit with an increase of only 26%.Assam, Bihar and Uttar Pradesh too have seen increases of between 35 to 45% which are significantly below the average of 55%. Kerala, Karnataka, Jharkhand and Maharashtra have made gains of between 65 to 75%.
1.61 This Commission had brought about major changes in the grants structure. While the previous commission had many channels through which grants would flow, like sector and scheme specific grants, elementary education etc., the Fourteenth Finance Commission has moved decisively away from them, arguing that there has been no continuity between Commissions, they overlap with Plan schemes, the lack of an allocation formula and lack of flexibility in use putting states in difficulties in running the schemes. The Commission found that flow of funds through these mechanisms are best identified, prioritized and financed by the respective states. Therefore, the Fourteenth Finance Commission recommended that grants-in-aid to states flow through only three channels: i) Post-devolution revenue deficit grants, ii) Disaster management grants, and iii) Grants to local bodies. The grants awarded by the Fourteenth Finance Commission have been confined to just three areas: local governments (53.49 per cent), financing disaster management (10.25 per cent) and revenue deficit (36.26 per cent). The local government grants are formula based with 90 per cent of the weight being carried by population and ten per cent by performance.The 90 per cent weight for population makes the award criterion simple and equitable without unnecessarily complicating it with indices of decentralization and so on.Grants in 2015-16, have shown large increases in the case of Andhra Pradesh (₹2774 crore to ₹9538 crore), Kerala (₹1378 crore to ₹5610 crore) and West Bengal (₹2665 crore to ₹10914 crore).
1.62 Except for Haryana and Tamil Nadu for which the increase in the tax share and grant is below 25%, mostly the low income states report below average increases. Kerala stands along with the North Eastern states, Himachal Pradesh and Jammu and Kashmir receiving an increase of over 100% in resource transfer (share of taxes and grants). The Budget Estimate of Kerala’s share in Central taxes and duties is shown as ₹13,122 crore for 2015-16 assuming an increase of 15.83% in the Gross Tax Revenue of the Centre. But tax collection this year has surpassed the 15.83% by more than half and as end of August is running at 22.82%. Kerala would then get a higher amount which could be over ₹13914 crore. Together with the revenue deficit grant, disaster management fund and local governments grant the total would be over ₹19,500 crore.
Expenditure
1.63 Expenditure of the State includes two components viz. revenue expenditure and capital expenditure including expenditure on loan disbursements. The total expenditure of the State recorded an increase of 98 per cent during the last five years from ₹38,790.24 crore in 2010-11 to₹76,744.11 crore in 2014-15. Revenue expenditure of the State has grown by 18.6 per cent in 2014-15 compared to 13.08 per cent in 2013-14, whereas capital expenditure and expenditure on loan disbursement has shown a downward trend.
Revenue Expenditure
1.64 The revenue expenditure of the State comprises of expenditure on salaries, pension, debt charges, devolutions to the Local Self Government Institutions (LSGI) and subsidies. The operational and maintenance cost for the upkeep of the completed projects and programmes are classified under the revenue account. Grants provided by the State to meet salaries and pension liabilities of employees in the Universities and State autonomous bodies and also the pension liabilities of employees of Panchayat Raj Institutions too are classified under revenue expenditure. Major portion of funds devolved to LSGIs from the revenue account of the State government is utilized for the creation of capital assets of durable nature. Also a significant share of grant-in-aid set apart for universities and autonomous institutions are meant for creation of capital assets.
1.65 Expenditure on social and economic services together constitutes development expenditure. Funds devolved to LSGIs for expansion and development and maintenance of assets is also reckoned as development expenditure. The thrust on expenditure in the social and economic sector have contributed towards maintaining the human development indicators of the State at a high level which ultimately impacts the long-term prospects of the economy. State Government’s priority for social and economic services in the State is clearly evident from the increased trend of development expenditure in recent years. Non-development expenditure of the State constitutes the committed expenditure consisting of debt charges, expenditure on pension payments and administrative services.
1.66 Revenue expenditure has shown more than 100 per cent growth during the period from 2010-11 to 2014-15. Total revenue expenditure in 2014-15 was ₹71746.43 crore, of which plan expenditure was ₹10282.59 crore and non-plan expenditure was ₹61463.85 crore. The ratio of revenue expenditure relative to GSDP has shown signs of stabilization during the last few years and this trend continued in 2014-15 also. This was in the ratio of 14.06 and 14.44 per cent in 2013-14 and 2014-15 respectively. The trend in revenue expenditure from 2009-10 to 2015-16 (BE) is given in Fig.1.10 and Appendix 1.33.
Fig 1.10
Trend in Revenue Expenditure
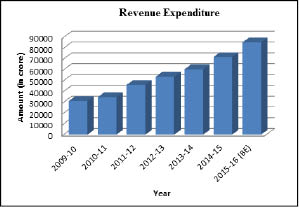
Source: Finance Department, Government of Kerala
1.67 Expenditure on committed liabilities viz. salaries, pension, interest payments, subsidies and devolution to LSGs constitutes 69.71 per cent of revenue expenditure in 2014-15. 86.30 per cent of the revenue receipts during 2014-15 of the State was used for meeting the above committed expenditure. Important factors contributing to higher revenue expenditure have been government’s active intervention to contain rise in prices of essential commodities, policy initiatives to bring all weaker sections of society under social security net and government’s priority to impart quality services in health and education sectors.
1.68 In 2014-15, salary expenditure as proportion of total revenue expenditure was 29.75 per cent whereas it was 31.88 per cent in 2013-14. Pension expenditure as percentage of total revenue expenditure was 15.68 per cent in 2014-15 compared to 16.49 per cent in 2013-14. Interest payment as percentage of total revenue expenditure decreased to 13.62 per cent in 2014-15 from 13.67 per cent in 2013-14. The details of revenue expenditure from 2011-12 to 2014-15 are shown in the Table1.9. The item wise details of revenue expenditure from 2009-10 to 2015-16 BE is given in Appendix 1.34.
Table 1.9
Trend in Revenue Expenditure from 2011-12 to 2014-15
(₹ Crore)
Items |
2011-12 |
2012-13 |
2013-14 |
2014-15 |
||||
Expenditure |
As per cent of TRE |
Expenditure |
As per cent of TRE |
Expenditure |
As per cent of TRE |
Expenditure |
As per cent of TRE |
|
i. Salaries |
16028.82 |
34.81 |
17257.41 |
32.26 |
19279.78 |
31.88 |
21343.50 |
29.75 |
ii. Pension |
8700.3 |
18.9 |
8866.89 |
16.58 |
9971.27 |
16.49 |
11252.67 |
15.68 |
iii. Interest |
6293.6 |
13.67 |
7204.81 |
13.47 |
8265.38 |
13.67 |
9769.59 |
13.62 |
iv. Devolutions to LSGIs |
3896.76 |
8.46 |
4739.33 |
8.86 |
4971.48 |
8.22 |
6398.00 |
8.92 |
v. Subsidies |
1014.43 |
2.20 |
1265.19 |
2.37 |
1278.96 |
2.11 |
1247.52 |
1.74 |
Committed Expenditure total (i to v) |
35933.91 |
78.04 |
39333.63 |
73.54 |
43766.87 |
72.36 |
50011.28 |
69.71 |
Others |
10110.71 |
21.96 |
14155.12 |
26.46 |
16718.63 |
27.64 |
21735.15 |
30.29 |
Total |
46044.62 |
100.00 |
53488.75 |
100.00 |
60485.50 |
100.00 |
71746.43 |
100.00 |
Source: Finance Department, Government of Kerala
Capital Expenditure
1.69 Development of the economy depends on investment in infrastructure. Large Fiscal Deficit is a major impediment to infrastructure financing. Government has therefore adopted the policy of looking at alternative sources for financing major infrastructure projects in the State. The share of government spending on capital projects has increased during recent years. In 2010-11, capital expenditure was ₹3363.69 crore. In 2011-12 and 2012-13 it increased to ₹3852.92 crore and ₹4603.29 crore respectively. In 2014-15 it was ₹4254.59 crore against ₹4294.34 crore in 2013-14. In 2014-15, Capital outlay - GSDP ratio marginally decreased to 0.86 per cent from 1 per cent in 2013-14. The public works continued to be the major segment of capital outlay accounting for 34.72 per cent of the total capital outlay in 2014-15 followed by agriculture and allied activities (8.37 per cent), Irrigation (6.35 per cent) and Industries (6.12 per cent). The trend in capital outlay and loan disbursement from 2009-10 to 2015-16 BE is given in Figure 1.11.
Fig 1.11
Trend in Capital outlay and Loan disbursement
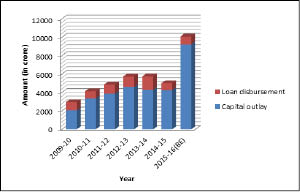
Source: Finance Department, Government of Kerala
1.70 The details of capital expenditure and total expenditure and item wise details of capital outlay from 2009-10 to 2015-16 BE are given in Appendix 1.35 & 1.36.
Debt Profile
1.71 Borrowings which are repayable and on which interest accrues are classified as debt. Debt of the State comprises of internal debt, loans and advances from Central Government and liabilities on account of Small Savings and Provident Fund Deposits, etc. Increasing gross fiscal deficit has led to increasing debt liabilities of the State. During the last five years market borrowings and accretions in Small Savings and Provident Fund Deposits have been the main sources available to the State Government to finance the fiscal deficit. The debt GSDP ratio has shown perceptible improvement in recent years. The annual growth rate of debt has come down to the level of 13.81 per cent in 2014-15 from 14.92 per cent in 2013-14. Outstanding debt liabilities of the State at the end of 2014-15 were ₹135440 crore. The Debt-GSDP ratio in 2010-11 was 29.83 per cent which came down consistently and reached the level of 27.26 per cent in 2014-15.The ratio of debt in terms of revenue receipts decreased to 233.72 per cent in 2014-15 from 242 per cent in 2013-14. The debt of the State from 2009-10 to 2015-16 BE is given in Table1.10.
Table 1.10
Debt of the State
(₹ Crore)
Year |
Internal Debt |
Growth Rate (%) |
Small Savings, Provident Fund, Others |
Growth Rate (%) |
Loans and advances from Central Government |
Growth Rate (%) |
Total |
Growth Rate (%) |
2009-10 |
43368.00 |
11.73 |
21296.00 |
15.44 |
6305.00 |
4.93 |
70969.00 |
12.17 |
2010-11 |
48528.10 |
11.90 |
23786.06 |
11.69 |
6359.08 |
0.86 |
78673.24 |
10.86 |
2011-12 |
55397.39 |
14.16 |
27625.10 |
16.14 |
6395.69 |
0.58 |
89418.18 |
13.66 |
2012-13 |
65628.41 |
18.47 |
31310.65 |
13.34 |
6621.78 |
3.54 |
103560.84 |
15.82 |
2013-14 |
76804.35 |
17.03 |
35542.51 |
13.52 |
6662.21 |
0.61 |
119009.07 |
14.92 |
2014-15 |
89067.91 |
15.97 |
39307.28 |
10.59 |
7065.05 |
6.05 |
135440.24 |
13.81 |
2015-16 BE |
105111.33 |
18.01 |
33763.00 |
-14.10 |
7793.00 |
10.30 |
146667.33 |
8.29 |
Source: Finance Department, Government of Kerala
1.72 The share of internal debt in the total debt liabilities of the State comes to 66 per cent in 2014-15. The growth rate of internal debt in 2014-15 was 15.97 per cent. Internal debt outstanding increased to ₹89067.91 crore in 2014-15 from ₹76804.35 crore in 2013-14. The liabilities under Small Savings, Provident Fund etc. comes to around 29 per cent of the total liabilities. The liabilities under Small Savings, Provident Fund etc at the end of 2014-15 was ₹39307.28 crore. It showed an increase of ₹3764.77 crore over 2013-14 (₹35542.51 crore). Loans and Advances outstanding from the Centre at the end of 2014-15 was ₹7065.05 crore. The gross and net retention of debt in 2014-15 was ₹16431.18 crore and ₹6641.03 crore respectively.
1.73 In recent years major fiscal indicators have shown instability mainly due to low buoyancy in revenue receipts. Slowdown in major sectors of the economy especially the rubber industry have virtually crippled the State’s economy and consequently destabilized tax collections. However to mitigate impacts of slowdown and for the revival of the economy, government has raised its public expenditure by making investment in social development sector. Government is also taking policy initiatives to augment funds through alternative sources for investing in major infrastructure development projects. It is expected that these bold measures would help the State to bring back the economy and finances right on track. The debt profile of the State from 2009-10 to 2015-16 BE is given in Appendix 1.37.
Contingent Liabilities
1.74 To overcome the ceiling on fiscal deficit set by the Fiscal Responsibility Act, the State Government stands guarantee to the borrowings of public sector undertakings and other institutions instead of funding them directly through the budget. These contingent liabilities become the debt obligations of the State in the event of default by the borrowing units for which Government is a guarantor. The outstanding guarantees during 2013-14 is ₹12275.21 crore. The outstanding guarantees of the State Government from 2008-09 to 2013-14 are shown in Table 1.11.
Table 1.11
Outstanding Guarantees
(₹ Crore)
Year |
Maximum Amount Guaranteed |
Amount outstanding (Principal & Interest) |
2008-09 |
11385.54 |
7603.32 |
2009-10 |
10225.78 |
7495.00 |
2010-11 |
12625.07 |
7425.79 |
2011-12 |
11332.11 |
8277.44 |
2012-13 |
11482.25 |
9099.50 |
2013-14 |
12275.21 |
9763.36 |
Source: Finance Department, Government of Kerala
Section 7
Banking
1.75 The financial sector, of which banking is the largest player, has been undergoing a transformation. After the introduction of New Economic Policy, the liberalised banking policies widened the scope and volume of financial activity, which contributed towards economic growth. In India, banking has grown both horizontally and vertically but the branch penetration in rural areas has not kept pace with the rising population and the need for accessible financial services.
1.76 In terms of number of branches, while Kerala has the largest number of bank branches among the semi urban areas in the country, Uttar Pradesh has the largest number of bank branches in rural and urban areas. Kerala has a total of 5981 bank branches as on March 2015 which accounts for 4.75 per cent of the total as against 5602 as on March 2014. During 2014-2015, 379 new branches were opened in the State. The total number of bank branches increased to 6010 by the end of June 2015. Despite Kerala’s small land area, it has large number of bank branches, indicating the spread of the financial system in the State (Appendix 1.38).
Deposits
1.77 The total bank deposits in Kerala increased by 15.14 per cent and touched ₹320010 crore during 2015 from ₹277,940 crore in 2014. The increase in bank deposits in 2014 was 18.67 per cent compared to 15.14 per cent in 2015. Among the major states, Madhya Pradhesh recorded 22.47 per cent growth in deposits during 2015, higher than the national average of 10.75 percentage (Appendix 1.39). In Kerala, the share of Ernakulam district with its total deposits is the highest (Appendix 1.44). District-wise distribution of deposits and credits of Scheduled Commercial Banks as on March 2015 is shown in Figure 1.12.
Fig 1.12
District-wise Distribution of Deposits and Credits of
Scheduled Commercial Banks in March 2015
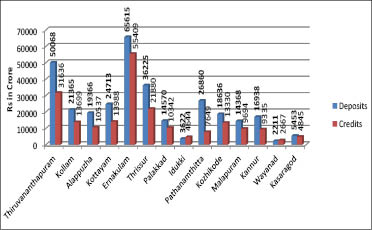
Source: Reserve Bank of India
NRI Deposit
1.78 Remittance from Non-Resident Indians plays an important role in the economic development of the State. The inflow of NRI deposits increased by 17 per cent from ₹93,883 crore in March 2014 to ₹1,09,603 crore in March 2015 (Appendix 1.41). Domestic deposits grew 13.20 per cent to₹2,10,287 crore during March 2015, as against ₹1,85,772 core in March 2014. Domestic deposits constitute 65.74 per cent of the total deposits of the State. The bank wise analysis of deposits shows that major share of deposit comes from domestic deposit except for Federal Bank. The Federal Bank attracts more NRI deposits than the other public and private sector banks. During March 2015 the share of NRI deposits to total deposit of the Federal Bank was 51.58 per cent whereas it is less than 50 per cent for all other public and private sector banks (Appendix 1.42).Figure 1.13 shows growth of deposits from 2001 to 2015.
Fig 1.13
Growth of Deposits from 2001-2015 in Kerala
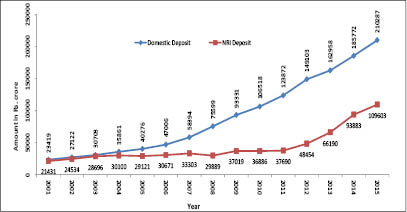
Source:-State Level Bankers Committee, Kerala
1.79 Bank Group wise total deposits and percentate of NRI deposits in March 2015 is shown in Table 1.12.
Table 1.12
Bank Group Wise Deposit - March 2015
(₹ Crore)
Bank Groups |
Total Deposit |
Percentage |
NRI deposit |
Percentage |
State Bank Group |
106004 |
24.89 |
41159 |
27.30 |
Public Sector Banks |
204347 |
47.98 |
64698 |
42.91 |
Private Sector Banks |
115543 |
27.13 |
44905 |
29.79 |
Total |
425894 |
100.00 |
150762 |
100.00 |
Source:- State Level Bankers Committee, Kerala
Advances
1.80 Priority sector advances by the banks in Kerala increased to ₹1,28,655 crore by March 2015 as against ₹1,13,555 core in 2013-14. The advance to priority sector is 58.83 per cent of the total advances, which is higher than the mandatory norm of 40 per cent. However, there was a marginal decrease of 0.31 per cent as compared to the previous year. Advances to agricultural sector increased from ₹48,812 crore to ₹57,656 core. This marks an increase of 0.94 per cent from 25.42 per cent in 2013-14 to 26.36 per cent during 2014-15. Advances to industrial sector increased from ₹38,479 crore to ₹54,417 crore in 2015. In 2014-15, advance to Industrial Sector accounted for 24.88 per cent of the total advances. An amount of ₹47092 crore has been disbursed to weaker sections in the State which is 21.53 per cent of the total advances in the year 2014-15. Analysis reveals that nationalised banks disbursed the bulk of advances to priority sector followed by Co-operative banks. At the national level it is seen that an amount of ₹6697242 crore has been disbursed as advances by Scheduled Commercial Banks in 2015. Among the major States, Maharashtra (29.44 per cent) stands at the top in disbursement of advances followed by TamilNadu (9.60 per cent) and Karnataka (6.08 per cent). Banks in Kerala disbursed an amount of ₹2,01,695 crore (3.01 per cent) in 2015 whereas it was ₹1,81,666 crore (2.97 per cent) in 2014(Appendix 1.40). Bank wise priority sector advances during March 2015 is shown in Figure 1.14.
Fig 1.14
Bank wise Priority Sector Advances in Kerala, March 2015

Source: State Level Bankers Committee
Pradhan Mantri Jan Dhan Yojana (PMJDY)
1.81 The National Mission on Financial Inclusion was announced by the Prime Minister in his Independence Day speech 2014 and formally launched on 28th August 2014 with the main objective of covering all households with at least one bank account across the country.
1.82 The accounts opened under PMJDY are Basic Savings Bank Deposit Accounts (BSBDA) which can be with zero balance as per Reserve Bank of India guidelines. As on October 2015, the deposits collected stood at ₹25,146.97 crore. The PMJDY accounts having balances in them also now exceed 60 per cent and the zero balance accounts have reduced to less than 40 per cent. The progress in deposits in these accounts shown in Figure 1.15.
Fig 1.15
Progress in Deposits under PMJDY
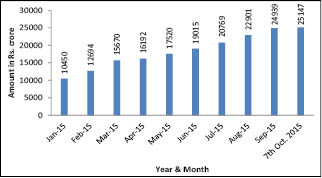
Source: Press information Bureau, GOI
1.83 Major banks who have contributed to this achievement are State Bank of India (₹2989.18 crore), United Bank of India (₹2644.77 crore), Oriental Bank of Commerce (₹2104.70 crore), Bank of Baroda (₹1771.424 crore), and UCO Bank (₹1178.17 crore).
1.84 States of Goa, Kerala and Tripura, Union Territories of Chandigarh, Pondicherry and Lakshadweep and nineteen districts of Gujarat have already been declared as having 100 per cent coverage of all households under PMJDY with at least one bank account.
MUDRA BANKS
1.85 Micro Units Development & Refinance Agency Ltd. (MUDRA) is a new institution set up by Government of India for development and refinancing activities relating to micro units and was announced by the Hon’ble Finance Minister in the Union Budget for FY 2015-16. The purpose of MUDRA Bank is to provide funding to the non-corporate small business sector. The biggest bottleneck to the growth of entrepreneurship in the Non-Corporate Small Busi ness Sector (NCSBS) is lack of financial support. Most of this sector does not have access to formal source of finance. To begin with it is being set up as a subsidiary of Small Industries Development Bank of India (SIDBI).
1.86 MUDRA would be responsible for refinancing all Last Mile Financiers such as Non Banking Finance Companies of various types engaged in financing of small business, Societies, Trusts, Section 8 companies, Co-operative Societies, Small Banks, Scheduled Commercial Banks and Regional Rural Banks which are in the business of lending to micro / small business entities engaged in manufacturing, trading and services activities. The Bank would partner with State / Regional level financial intermediaries to provide finance to Last Mile Financier of small / micro business enterprises.
1.87 MUDRA will offer smaller loans up to ₹50,000/- under the ‘Shishu’ category, beyond ₹50,000 and up to ₹5 lakh under the ‘Kishor’ category and above ₹5 lakh and upto ₹10 lakh under ‘Tarun’ category. These products have been designed to cater to customers operating at the lower end of the enterprise spectrum. The loans will be extended through MFIs, NBFCs, and Banks etc. An amount of ₹2996.12 crore has been sanctioned and ₹2887.79 crore been disbursed under all the three catogories in Kerala (as on 08.01.2016).
Box 1.2
Non-Banking Financial Institutions in Kerala
he Working Group on Non-Banking Financial Institutions in Kerala, constituted by the State Planning Board, has submitted its report in December 2015. The Working Group was constituted broadly with the mandate to a) study the performance of NBFIs sector in the State b) assess the functioning of Money Lenders and c) study the magnitude of Chit business in the State. The Report covers in detail, the role and functions of NBFIs and selected PSUs, Chit Funds, Kudumbasree, KSFE, Money Lenders, Co-operative Societies, Interest Free Banking and Case Studies of major NBFIs in Kerala.
The number of deposit accepting Non-Banking Financial Corporations (NBFCs) in Kerala declined from 23 in 2002 to 12 in 2015. Though the number of NBFCs had decreased over the years, the size of aggregate public deposit had increased from ₹50.47 crore in 2001-02 to ₹191.46 crore as on March 31st, 2014 and to ₹231.59 crore in March 2015. The number of Chits registered in the State by KSFE, Private Chit Funds and Co-operative Societies increased from 8810 in 2009-10 to 13737 in 2014-15. The total revenue to the Government by way of Chit Registration fee and Stamp duty increased from ₹13.46 crore in 2009-10 to ₹28.19 in 2014-15. The total number of registered Money Lenders in Kerala has increased from 5696 in 2003-04 to 10656 in 2014-15, an increase of 87 percent. However, the presence of unregistered private Money Lenders is evident in the State. Under Operation Kubera 14757 raids were conducted and 3400 cases registered. Though Idukki, Kottayam and Palakkad districts have lesser number of Money Lenders, large number of cases have been registered in these districts. Kerala Government has floated Cheramon Financial Services Ltd. on the principle of Zero Interest Banking with an authorised financial share capital of ₹1000 crore which operates in the areas of Equipment Leasing, Equity Funding & Infrastructure Development.
The Working Group, interalia, recommended the establishment of an overriding mechanism to observe and validate the operations of NBFIs under different regulators, to establish an umbrella regulatory frame for right operations in the State. Strengthening Chit business through rationalization of Chit Act/Rules, recognition of micro credit lending through formal and informal channels and adequate legislative mechanism to promote accountability in lending are some of the other measures suggested by the Working Group.
Source: Working Group Report on Non-Banking Financial Institutions in Kerala, State Planning Board, 2015
Credit Deposit Ratio
1.88 The CD Ratio of public sector banks in India excluding Regional Rural Banks by the end of March 2015 was 76.05 per cent. It was 78.20 per cent in 2014. Tamil Nadu occupied topmost position among the major states in the CD Ratio (120 per cent) followed by Telengana (107.82 per cent), and Andhra Pradesh (106.13 per cent) compared to which the CD Ratio in Kerala is only 69.48 per cent. During March 2014, it was 71.01 per cent (Appendix 1.43). The CD Ratio of Idukki (128.22 per cent) and Wayanad (120.62 per cent) remain high. Among the districts, Pathanamthitta stands at the bottom with CD Ratio of 28.48 per cent (Appendix 1.44).
Primary Agricultural Co-operative Societies (PACS) and Financial Inclusion
1.89 The 14 District Co-operative Banks in Kerala have 747 branches across the State and there are1654 Primary Agricultural Co-operative Societies affiliated to them. The financial activities of the District Co-operative Banks (DCBs) and its affiliated PACSs reveal the significance of Co-operative Banks in the banking activities at the grass root level in the State. The total deposits and advance in these banks were ₹40,133 crore and ₹25,150 crore respectively in March 2015. The total priority sector advances by the Co-operative Societies in the State was ₹14,661 crore, covering sectors such as Agriculture (₹3425 crore), SME (₹418 crore) and Housing (₹2973 crore).
Advances to SCs/STs
1.90 According to SLBC’s banking statistics, an amount of ₹4390 crore and ₹1164 crore was disbursed to SCs & STs respectively in March 2015 in the State. The major share of advances to SCs came from State Bank Group (₹3237 crore) which accounted for 74 per cent. Private Sector Banks and Regional Rural Banks disbursed ₹119 crore and ₹94 crore respectively. ₹962 crore (83 per cent) by State Bank Group, ₹158 crore (14 per cent) by Nationalised Banks, ₹31 crore (3 per cent) by Regional Rural Banks and ₹13 crore (1 per cent) by Private Sector Banks were distributed to STs.
Section 8
Annual Plan 2015-16
1.91 Annual Plan 2015-16 is the 4th year of the 12th Five Year Plan (2012-17). Several systematic changes were made during 2015 to ensure that the Annual Plan is holistically implemented. Annual Plan for the year is formulated based on specific guidelines. While formulating the plan, critical review of the performance of ongoing schemes were held. Stakeholder consultations were held on different areas of critical importance to the State, with a bottom up approach, to capture information on the ground realities. In order to avoid proliferation of schemes, attempts have been made to reduce the number of schemes and wherever possible schemes having similar nomenclature have been grouped together under a single head as an ‘umbrella’ scheme.
1.92 Aiming at a qualitative improvement in plan implementation, an Award System for the best performers in Plan implementation was introduced in 2013-14. It has been decided to continue the system. A notable achievement of the system is that a Summary Document on Sector/Sub-Sector/Scheme wise Officer responsible for the implementation of each of the schemes is furnished in the Annual Plan 2015-16 to be tabled in the State Legislature along with the Budget documents for 2015-16.
1.93 In the Annual Plan (2015-16), the Aggregate Budgeted Outlay of the State (BE) is ₹27686.32 crore which includes the State Plan of ₹20000 crore and Central Assistance of ₹7686.32 crore. In the budgeted outlay, Other Central Assistance (OCA), One Time Additional Central Assistance (OTACA) and 13th FC Award schemes constituted ₹659.62 crore.
1.94 Following the 14th Finance Commission recommendations to discontinue allocations under OCA, OTACA, and FC Award Schemes and consequent to the changes in the funding pattern of Centrally Sponsored Schemes (CSS) in the Union Budget 2015-16, a re-estimation of plan resources became essential. Accordingly, a realistic estimation of the resource requirement under OCA, OTACA, FC Award Schemes and State Share of CSS were made. The revised estimation indicated an increase in the State Plan size from the existing ₹20000 crore to ₹21573.51 crore and the Annual Aggregate Plan was reduced to ₹26270.47 crore from the BE of ₹27686.32 crore. The reduction in Aggregate Plan is due to the re-estimation of Central Assistance from the BE of ₹7686.32 crore to the RE of ₹4696.96 crore. The net impact to the State exchequer has been worked out at ₹2238.13 crore. Major sector wise comparative statements of the outlays of Annual Plan (2014-15) and (2015-16) are given in Table 1.13.
Table 1.13
Annual Plan 2014-15, 2015-16 (BE) and 2015-16 (RE)
Sectorwise outlay comparative statement
(₹ crore)
Sl. No |
Sector |
2014-15 |
2015-16 (BE) |
2015-16 (RE) |
% of increase / decrease over RE |
% of increase / decrease over BE |
||||||
Outlay |
CSS |
Aggregate |
Outlay |
CSS |
Aggre gate |
Outlay |
CSS |
Aggre gate |
||||
I |
Agriculture and Allied activities |
1664.02 |
149.09 |
1813.11 |
1241.85 |
627.58 |
1869.43 |
1280.08 |
329.33 |
1609.41 |
-11.23 |
3.11 |
II |
Rural Development |
617.23 |
833.41 |
1450.64 |
653.12 |
2223.08 |
2876.20 |
909.73 |
1968.37 |
2878.10 |
98.40 |
98.27 |
III |
Special Area Programmes |
413.76 |
|
413.76 |
467.23 |
75.20 |
542.43 |
491.84 |
0.00 |
491.84 |
18.87 |
31.10 |
IV |
Irrigation and Flood Control |
749.64 |
160.67 |
910.31 |
348.01 |
223.67 |
571.68 |
338.84 |
223.67 |
562.51 |
-38.21 |
-37.20 |
V |
Energy |
1370.04 |
|
1370.04 |
1467.20 |
0.00 |
1467.20 |
1467.20 |
0.00 |
1467.20 |
7.09 |
7.09 |
VI |
Industry and Minerals |
639.40 |
36.68 |
676.08 |
582.20 |
28.71 |
610.91 |
609.10 |
3.38 |
612.48 |
-9.41 |
-9.64 |
VII |
Transport |
1180.87 |
0.63 |
1181.50 |
1300.12 |
0.00 |
1300.12 |
1300.12 |
0.00 |
1300.12 |
10.04 |
10.04 |
VIII |
Science, Technology and Environment |
621.45 |
42.73 |
664.18 |
688.40 |
67.59 |
755.99 |
711.44 |
47.13 |
758.57 |
14.21 |
13.82 |
IX |
General Economic Services |
1651.49 |
43.25 |
1694.74 |
2508.19 |
137.64 |
2645.83 |
2596.03 |
39.98 |
2636.01 |
55.54 |
56.12 |
X |
Social Services |
6334.44 |
2435.33 |
8769.77 |
5873.47 |
4287.85 |
10161.32 |
6992.23 |
2073.41 |
9065.64 |
3.37 |
15.87 |
XI |
General Services |
57.66 |
30.00 |
87.66 |
70.21 |
15.00 |
85.21 |
76.90 |
11.69 |
88.59 |
1.06 |
-2.79 |
|
TOTAL - I toXI |
15300.00 |
3731.79 |
19031.79 |
15200.00 |
7686.32 |
22886.32 |
16773.51 |
4696.96 |
21470.47 |
12.81 |
20.25 |
XII |
LSGD |
4700.00 |
0.00 |
4700.00 |
4800.00 |
0.00 |
4800.00 |
4800.00 |
0.00 |
4800.00 |
2.13 |
2.13 |
|
GRAND TOTAL |
20000.00 |
3731.79 |
23731.79 |
20000.00 |
7686.32 |
27686.32 |
21573.51 |
4696.96 |
26270.47 |
10.70 |
16.66 |
Rationalisation of CSS - Report of Sub Group of CMs
1.95 The Central Government abolished the Planning Commission and constituted the NITI Aayog with all the Chief Ministers as members of its Governing Council chaired by the Prime Minister. In the first meeting of the Governing Council, the Prime Minister announced the constitution of the subgroup of Chief Ministers on Rationalization of centrally sponsored schemes. The subgroup was formed with a view to enhancing the efficiency in implementation of CSS and making necessary modifications so as to make their impact more visible. The Sub-group comprised of Chief Ministers of Arunachal Pradesh, Jammu & Kashmir, Jharkhand, Kerala, Manipur, Nagaland, Rajasthan, Telangana, Uttar Pradesh and Lt. Governor of A & N Islands. The Chief Minister of Madhya Pradesh was designated as the Convener and the CEO (Chief Executive Officer) NITI Aayog was the Co-ordinator.
1.96 On the basis of extensive and wide ranging consultations, the Sub-Group has made recommendations regarding redesigning and implementation of the CSS. Some of the major recommendations include pruning down of the number of existing CSS from the current 66 to a maximum of 30. The revamped CSS will now reflect the priorities set in the National Development Agenda that was unanimously adopted at the first meeting of the Governing Council of the NITI Aayog. The CSS that have been recommended for continuation have been classified as Core of the Core, Core and Optional Schemes reflecting their inter-se importance in furthering the National Development Agenda. The Sub Group has recommended that the participation of the States in the Core Schemes shall be mandatory.
1.97 Ministry of Finance, GoI has intimated that report of Sub Group of CM’s has been considered and decided that funding of fully supported schemes (A category) will remain unchanged and that of schemes with changed funding pattern (B category) will be shared in the ratio of 60:40 between the Centre and the State. All other schemes (not listed in the above two categories) will be optional for the States and the funding pattern will be 50:50 between the Centre and the State. The CSS proposed in the Annual Plan 2016-17 of the State is on the basis of revised funding pattern as intimated by the Government of India. The views of State Planning Board/GoK have been taken by NITI Aayog in deciding the funding pattern of CSS.
Box 1.3
Highlights of Annual Plan 2015-16
• Strengthening of Vegetable Development – Support for institutions developed for the promotion of vegetable cultivation.
- • Organic farming – For promoting organic agriculture
- • 15 Agro Service Centres proposed
- • 40 Plant Clinics proposed
- • Veterinary Service – Night service proposed for 20 Development Blocks
- • Integrated Dairy Development project for Idukki and Kannur districts.
- • Adoption of mechanisation and modern technology
- • Elevation of 100 Govt schools to international standard over a period of 3 years.
- • Modernisation of Film/Digital preservation vault (KSFDC)
- • Vajrakeralam– to herald the achievements and development of the State during the last 60 years.
- • New Medical Colleges in Idukki, Kasaragod, Pathanamthitta, Malappuram and Wayanad
- • Santhwanam Rental Housing Scheme for patients who are undergoing continuous treatment in Medical Colleges of the State
- • Awareness creation programme for loading and unloading workers
- • Introduction of GPS based Mother and Child tracking system in Mananthavadi Block
- • First 1000 days programme for infants in Attappady
- • Petcoke based power project (500-600 MW)
- • Setting up of Centre for Bio-polymer Science & Technology
- • KSIDC projects – Green Financing Scheme, Mega Food Park, Cherthala
- • KINFRA projects – Mega Food Park- Palakkad, Foot Wear Park- Ramanattukara, Gem and Jewellery Park- Puzhakkal, Thrissur, Spices Park, Muttam, Thodupuzha, Nano Tech Zone at Hi- Construction of By lane to NH
- • Establishment of Modern Slaughter Houses in urban areas
- • Establishment of gas crematorium in urban areas
- • ATSP Housing for homeless Scheduled Tribes
Planspace-District Roll Out
1.98 As part of strengthening the plan monitoring and evaluation mechanism, an online plan monitoring software planspace was developed by the State Planning Board with the technical support of IIITM-K (a Government of Kerala undertaking at Technopark, Thiruvananthapuram). Planspace is a web based management information system for monitoring and evaluation of the progress of implementation of all plan schemes in the State. For the first time, the Annual Plan proposals for the year 2015-16 were received online from Heads of Department and Implementing agencies through planspace.
1.99 With a view to strengthen the District Level Plan Monitoring System, planspace has been rolled out to all the districts in the State. As part of it 1089 officers in the districts were trained to familiarize the software for the district level monitoring. The official declaration of District Roll Out of planspace in the State is expected during January 2016. This will enable implementing officers at district and sub district levels to directly input data into the system, thus further enhancing its accuracy and timeliness. As per the information available on planspace, during the current Financial Year the total plan expenditure is 41% per cent as on 31st December 2015 which is expected to improve substantially by the end of the financial year.
1.100 As a further step towards making the monitoring mechanism more effective, it has been decided to introduce digitised documentation of assets created in the Annual Plan. Photographs/images of physical assets created with geographical co ordinates will be uploaded to planspace using GPS, IIITM-K has developed an Android based mobile application for this. In the first phase, this will be introduced on a pilot mode in selected departments and later extended to all departments.
Macro Economic Outlook for Kerala
1.101 The nature of growth in the state has widely been perceived as being vulnerable as consumption led growth is subject to internal and external dynamics. Low value addition, poor infrastructure, high unemployment, inequality and various environmental challenges are the major hindrances to pushing up growth in the State. Rising urbanisation has brought to forefront many daunting challenges before the State. The changes in the funding pattern for CSS has brought about a change in the resource availability in the State. The State needs to improve the quality of its expenditure and also enhance the availability of financial resources to fill the critical gaps observed in the development process. Planning, prioritisation and performance is the key. The Perspective Plan 2030 charts out the vision and development strategy for the State. Prioritisation of expenditure and effective implementation of the strategies will be instrumental in leveraging the advantage of the state, addressing the challenges and transforming the State to knowledge based economy as envisaged in the Perspective Plan.