Industry, Labour and Employment
Manufacturing
According to the Index of Industrial Production (IIP), the mining, manufacturing and electricity sectors in India registered growth of (-) 0.2 per cent, (-)1 per cent and 4.6 per cent respectively during April to October 2016 over the corresponding period of 2015.
As far as the State is concerned, industrial sector consists of medium and large industries, micro, small and medium enterprises (MSME) and traditional industries. The Departments/ Agencies engaged with medium and large industries are Kerala State Industrial Development Corporation Ltd (KSIDC), Kerala Industrial Infrastructure Development Corporation (KINFRA), Public Sector Restructuring and Internal Audit Board (RIAB), Bureau of Public Enterprises (BPE) and Centre for Management Development (CMD) . The agencies that are concerned with MSME and traditional industries are Department of Industries and Commerce, Directorate of Handloom and Textiles, Directorate of Coir Development, Khadi and Village Industries Board, Cashew Workers Apex Co-operative Society (CAPEX) and Mining and Geology.
The department wise outlay and expenditure during 2014-15, 2015-16 and 2016-17 are given in Table 3.1. An amount of Rs. 658.93 crore has been provided for Industry Sector in 2016-17, which is 11.22 per cent higher than that of the previous year.
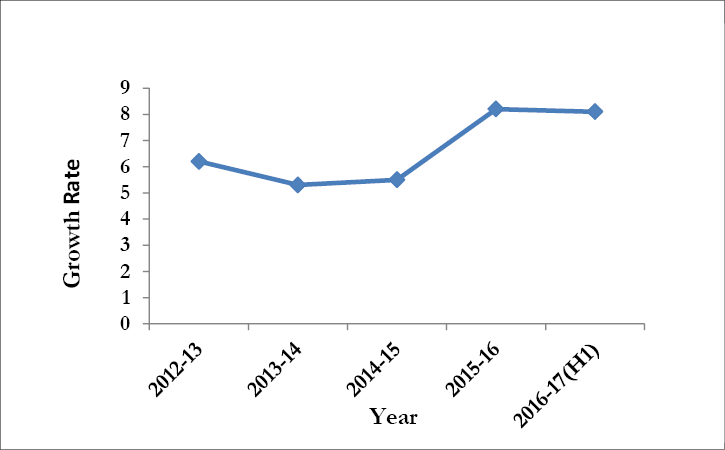
As per estimates by the CSO, the share of manufacturing sector in India's GVA at constant prices was 17.81 per cent in 2015-16.The trends in growth of manufacturing sector in India over the previous years as per provisional estimate of GVA by economic activity at constant prices for a period from 2012-13 to 2016-17 (H1) is exhibited in Figure 3.1
Figure 3.1
Growth of Manufacturing Sector in India,in per cent

Source: Central Statistics Office
Table 3.1
Sub Sector wise outlay and expenditure during 2014-15 to 2016-17, in lakh
| Sl.No | Name of Department/ Scheme | 2014-15 | 2015-16 | 2016-17 | |||
| Outlay | Exp. | Outlay | Exp. | Outlay | Exp. * | ||
| 1 | Medium and Large Industries | 30084.00 | 6184.43 | 23405.33 | 21788.79 | 29178.00 | 2851.33 |
| 2 | Department of Mining & Geology | 83.00 | 53.07 | 83.00 | 79.93 | 84.00 | 19.11 |
| 3 | Village and Small Scale Industries | 33773.00 | 20571.56 | 35757.00 | 28821.31 | 36631.00 | 10922.91 |
| Total | 63940.00 | 26809.06 | 59245.33 | 50690.03 | 65893.00 | 13793.35 | |
*As on October 2016
Source: State Planning Board
State Scenario
As per Quick Estimate of Gross State Domestic Product for 2015-16 by Economics & Statistics Department, the manufacturing sector of Kerala grew by 9.28 per cent at current prices compared to 5.02 per cent in the previous year. At constant prices (2011-12), the sector registered a growth of 12.65 per cent in 2015-16 as against 2.46 per cent in 2014-15. The shares of manufacturing sector in GSDP at constant and current prices in 2015-16 were 9.97 per cent and 8.72 per cent respectively. The income from manufacturing sector to GSDP from 2011-12 to 2015-16 is given in Appendix 3.1
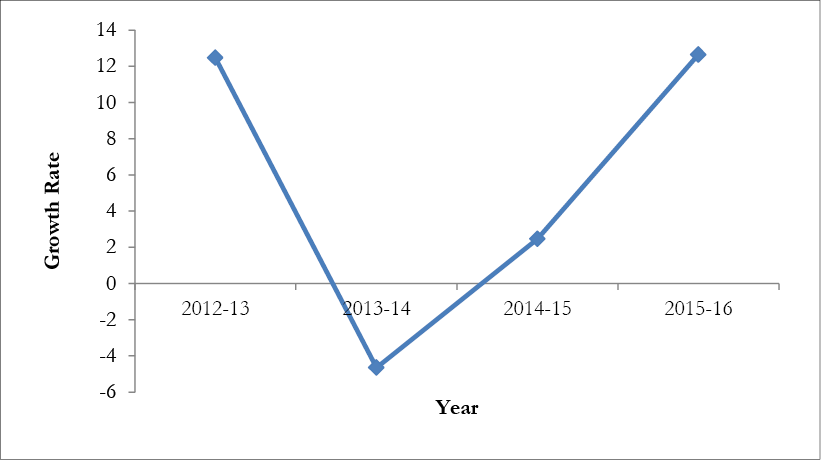
The trend in growth of income from manufacturing sector in Kerala on the basis of GSDP at constant prices for the period from 2012-13 to 2015-16 is shown in Figure 3.2.
Figure 3.2
Rate of Growth of Manufacturing Sector in Kerala, in per cent

Source: Directorate of Economics and Statistics
The income from manufacturing sector in Kerala which registered 12.47 per cent growth in 2012-13 witnessed a decline during 2013-14 (-4.65 per cent) and recorded a growth of 2.46 per cent during 2014-15 and a moderate growth of 12.65 percent during 2015-16.
Mining
India is rich in minerals especially Iron ore, Barytes, Rare Earth and Mineral Salt. India produced 90 minerals in 2012-13, which included 11 metallic, 52 non metallic and 23 minor minerals. India is ranked 2nd in the world in the production of Barytes, third in Chromite, coal and lignite, 5th in Iron ore and Steel (crude), 6th in Bauxite ore, 7th in Manganese Ore and 8th in Aluminium (crude) in 2012. The number of mines in India which reported mineral production (excluding minor minerals, petroleum (crude), natural gas and atomic minerals) was 1,878 in 2015-16 as against 3,524 in 2014-15.
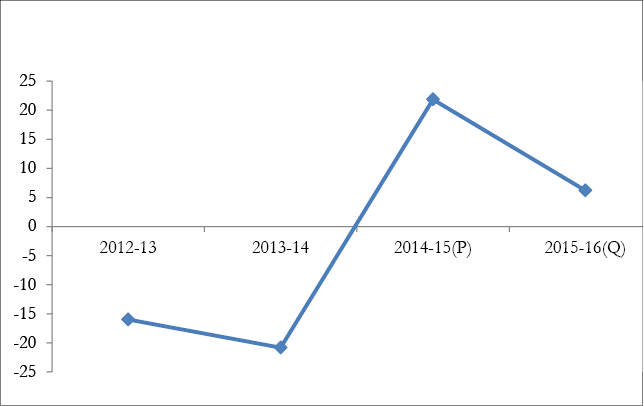
As per Provisional Estimate (PE) of Gross Value Added (GVA) at constant prices (2011-12) for 2015-16, mining and quarrying sector at national level decelerated to 7.4 per cent as against 10.8 percent in 2014-15.During the period April-September (H1) 2016, the mining and quarrying sector contributed 1.49 lakh crore to Gross Value Added (GVA) at constant prices.The sector decelerated by (-) 0.9 per cent as compared to 6.9 per cent growth in the first half of 2015-16. At current prices, the sector contributed1.68 lakh crore to GVA during 2016-17 (H1) with a growth rate of 1.3 per cent as compared with the growth of 3.5 per cent of 2015-16(H1). The trend in national growth rate of Mining and Quarrying sector on the basis of GVA at constant prices is shown in figure3.3.
Figure 3.3
National Growth Rate of Mining and Quarrying Sector, in per cent

Source: Central Statistical Office
Growth of Mining Sector in the State
The contribution of Mining and Quarrying sector to Gross State Domestic Product at constant prices is estimated at 5,07,958 lakh during 2015-16, thus registering a growth of 6.21 percent compared to previous year. The share of the sector in GSDP at constant prices stood at 1.20 percent during 2015-16.
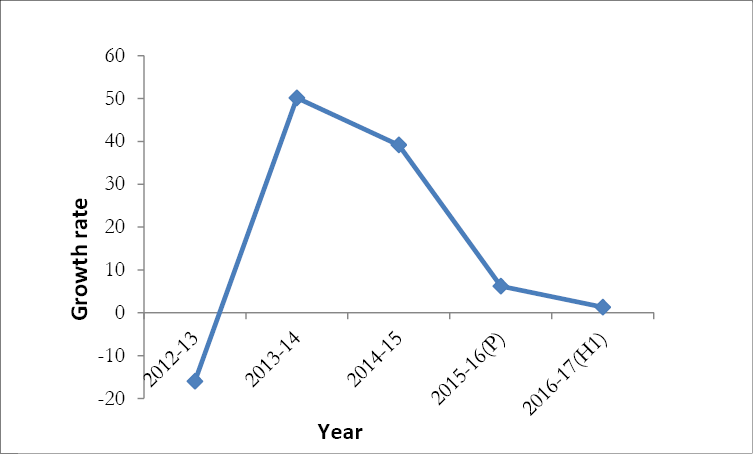
The growth of income from the sector as per estimate of GSDP at constant prices (2011-12) from 2012-13 to 2015-16 is depicted in Figure 3.4.
Figure 3.4
Growth Rate of Income from Mining and Quarrying Sector in Kerala, in per cent

Source: Directorate of Economics and Statistics
Mining and quarrying sector in the State registered negative growth during 2012-13 and witnessed a high positive growth of 50.13 per cent during 2013-14 and declined to 39.13 percent in 2014-15 and 6.21per cent in 2015-16
There are 87 major mineral mines that are operational in the State as on March 31, 2016. During 2015-16, 77 mining leases for major minerals, 501 quarrying leases for minor minerals, 2,670 quarry permits in minor minerals and 1,549 dealers' license were granted. In 2015-16 there were 188 registered metal crusher units in Kerala and two prospecting licenses granted for minor minerals.
The total area covered by mining leases as on October 2016 is 1,139.75 hectares, of which Mineral Sand accounts for 558.37 hectares, Limestone 245.69 hectares, Lime shell/seashell 99.4 hectares, Iron Ore 86.06 hectares and China Clay 72.95 hectares. Area covered by Graphite is 1.25 hectares and of Bauxite is nil. Mineral wise details of area covered by mining lease are given in Appendix 3.2
Production and Royalty of Minerals 2015-16
During 2015-16, 408.01 lakh tonnes of major and minor minerals were produced in Kerala. Among major minerals, Bauxite/laterite tops the list with 16.90 lakh tonnes followed by Limestone (6.26 lakhs ton) and China clay (5.86 lakh ton). Among minor minerals highest production is from Graphite Building Stone (298.75 lakh ton) followed by Ordinary Earth (55.08 lakhs ton) and Ordinary Sand (13.31 lakhs ton)
During 2015-16 an amount of 119.51 crore was received as royalty from minerals, of which 28.00 crore was from major minerals and 91.51 crore was from minor minerals. During 2015-16 highest royalty among major minerals was from bauxite/laterite (16.22 crore) followed by lime stone (5.01 crore), china clay (2.34 crore), silica sand (1.59 crore) and ilmenite (1.15 crore).Among minor minerals granite building stone stands first by contributing 71.70 crore as royalty followed by ordinary earth (11.01crore) and ordinary sand (5.32 crore) during 2015-16. The production and royalty of minerals in the State during 2015-16 are given in Appendix 3.3
Revenue Collected from Major/Minor Minerals
District wise analysis of revenue collection shows that Ernakulum district has the highest collection of 22.51 crore (16.11% of total revenue) followed by 17.43 crore (12.48%) in Palakkad and 13.00 crore (9.31%) in Kannur. The least revenue collection of 3.01crore (2.15%) is from Alappuzha. The district wise collection of revenue from major and minor minerals is furnished in Appendix 3.4

