Industry, Labour and Employment
Labour and Labour Welfare
Labour and labour welfare is the cornerstone of human development policies undertaken by the Government to attain greater efficiency and productivity and ensure safety and security of its human resources. Labour market has witnessed significant transformation in the last two decades both in terms of employment conditions and industrial relations.Labour is the subject in the concurrent list where both centre and state government are empowered to enact legislations. Kerala has always recognised the value addition of the working class in the economic transition of the state which is reflected in the welfare measures enacted by the government. It is accepted fact that labour laws and labour welfare schemes implemented by the State have been commendable compared to other parts of the country.Existing unique labour structure in the state have been achieved through the active intervention of the Government on right to work of one’s choice, right against discrimination, pro hibition of child labour, social security, protection of wages, redressal of grievances, right to organize and form trade unions, collective bargaining and participation in management. The Government is of the view that every employee/ worker should be a member in a Labour Welfare Board and they must be protected by the State throughout their lives.Currently around 29 Labour Welfare Fund Boards exist in the State, of which 16 are under the Labour Commissionerate.
Kerala however, has been facing challenges in terms of high rate of unemployment and under employment,low rate of productive employment, inadequate levels of skill creation and training, low level of labour force participation and low worker population ratio and disparity in wages of male and female. Essentially, the state has to create employment opportunities and employment-intensive growth and for which the labour force has to be allowed from low-value added to high-value added activities.The state aims to achieve job induced growth in the economy to create new jobs in both urban and rural Kerala, a unified and consolidated legislation for social security schemes, reprioritisation of allocation of funds to benefit vulnerable workers, long term settlements based on productivity, labour law reforms in tune with the times, amendments to Industrial Disputes Act,1947 and revamping of curriculum and course content in Industrial Training Institutes. Monitoring & Evaluation have also been considered integral to labour reforms against the backdrop of increasing inter-state and international migration.
Labour Force Participation Rate (LFPR)
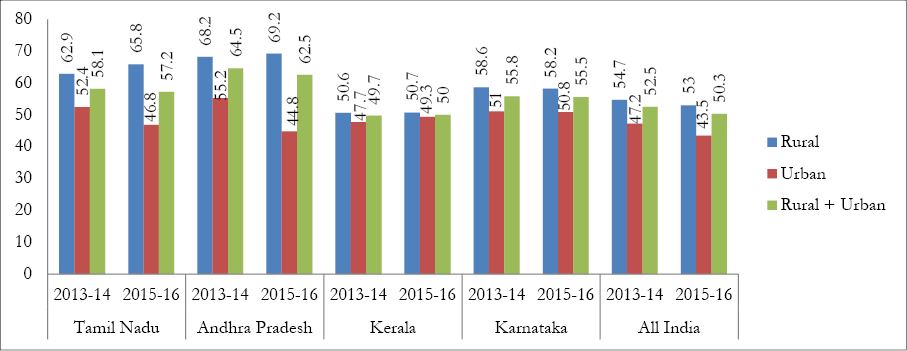
The situation of labour force in Kerala can be gauged from the indicators such as LFPR, WPR, daily wage rage and trend in industrial relations. Low level of LFPR is the perpetual characteristic of Kerala labour market among Indian states. Apart from slight increase of LFPR in urban region, labour force participation has been constant over the last two years. As per the 5th Annual Employment & Unemployment Survey (2015-16) of Labour Bureau, Ministry of Labour, Government of India, LFPR in Kerala is 50 per cent, a marginal increase by 0.3 per cent over the year 2013-14. Even if we are at par with the national average, LFPR in our neighbouring states is better at 62.5 per cent, 57.2 and 55.5 per cent in Andhra Pradesh, Tamil Nadu and Karnataka respectively. Similarly in Rural areas, we are not only distant from national average but also from our neighbouring states of Andhra Pradesh and Tamil Nadu where the rate is 69.2 and 65.8 per cent respectively. Figure 3.26 shows the LFPR of Kerala and other southern states.
Figure 3.26
LFPR for persons aged above 15 as per Usual Principal Status
Source: Labour Bureau, Ministry of Labour, GoI
Yet another aspect of significant concern is the low female labour force participate rate. North eastern and southern states, in general, have a higher LFPR compared to low levels in northern states. The details regarding female LFPR is covered under Gender section in Chapter 4.
Worker Population Ratio (WPR)
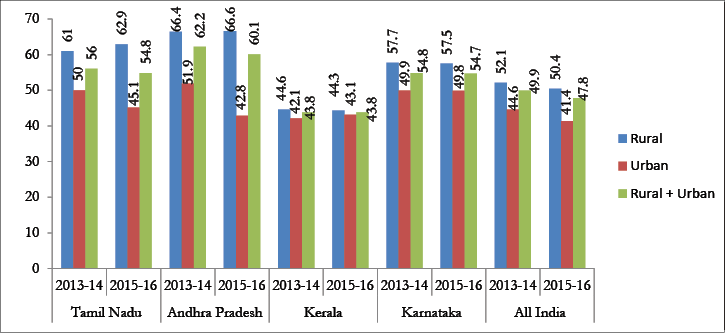
Worker Population Ratio (WPR) is an indicator used for analysing the employment situation and knowing the proportion of population actively contributing to the production of goods and services in the economy. The 5thAnnual Employment & Unemployment Survey of Labour Bureau, Ministry of Labour,Government of India shows a declining trend in WPR. Along with national average, the WPR is declining among the southern states. The WPR in Kerala is 43.8 per cent as against the all India average of 47.8 per cent. Among the southern states, performance of Andhra Pradesh is admirable at 60.1 per cent followed by Tamil Nadu and Karnataka at 54.8 and 54.7 per cent respectively. In rural Kerala, the WPR is reported as 44.3 per cent against 66.6 and 62.9 per cent of Andhra Pradesh and Tamil Nadu. Figure 3.27 shows the trend of WPR in Kerala and other southern states.
Figure 3.27
WPR for persons aged above 15 as per Usual Principal Status
Source: Labour Bureau, Ministry of Labour, GoI
Self Employed Persons in Labour Force
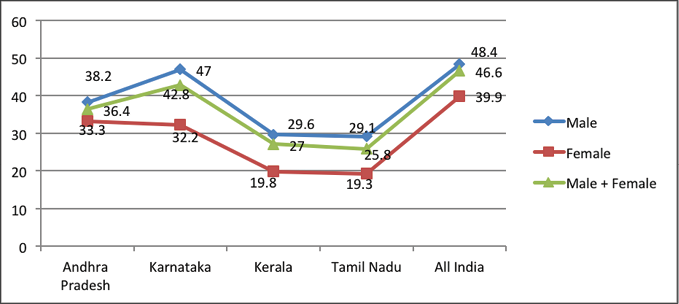
Labour force engaged in self-employment in the state is 27 per cent which is 19.6 per cent lower than the national average. Male female gap in self-employment labour force in the state is 9.8 per cent which is 1.3 per cent higher than the national average of 8.5 per cent.Even if self-employment among the labour force is high in Karnataka, the difference between male and female self-employed persons is high at 14.8 per cent. In Andhra Pradesh this gender gap is low at 4.9 per cent. Figure 3.28 shows the percentage of self-employed persons in labour force and gender gap in Kerala and other states.
Figure 3.28
Percentage of Self Employed persons in Labour Force
Source: Labour Bureau,Ministry of Labour andEmployment,GoI
Casual Workers in the Labour Force
Casual workers are employees who do not have regular or systematic hours of work or an expectation of continuing work. A typical casual employee is employed on a daily basis when the need arises. Percentage of casual workers among the labour force in the state is 43.8 percent which is 11 percent higher than the national average of 32.8 percent. Among the southern states, Andhra Pradesh and Tamil Nadu have the highest level of casual workers in labour force at 48.4 and 47.2 percent respectively. (Figure 3.29)
Figure 3.29
Percentage of Casual Workers in Labour Force

Source: Labour Bureau,Ministry of Labour and Employment,GoI
Concepts & Measurement of Labour Force
1. Labour Force Participation Rate: - Labour Force Participation Rate (LFPR) is defined as the number of persons in the labour force per 1000 persons.
LFPR= |
no of employed + no of unemployed persons |
X100 |
total persons |
2. Worker Population Ratio: - Worker Population Ratio (WPR) is defined as the number of persons employed per 1000 persons.
WPR= |
no of employed persons |
X100 |
total persons |
Measurement of Labour Force
In a country where majority of the workers are employed in the unorganized sector and pursuing multiple activities, estimating labour force and its derivatives by a single approach is a difficult task. In such cases no single measure is appropriate to estimate the labour force parameters precisely. As per International practice, Labour Force related parameters can be estimated for both longer reference period and current or shorter reference periods. Accordingly, based on longer reference period, Labour Force related parameters may be derived by the following two different approaches.
i) Usual Principal Status (UPS) Approach: - The major time criterion based on the 365 days is used to determine the activity pursued by a person under the usual principal status approach. Accordingly, the major time spent by a person (183 days or more) is used to determine whether the person is in the labourforce or out of labour force. A person found unemployed under this approach reflects the chronic unemployment. The usual principal status approach estimates are derived for a moving reference period of last twelve months.
ii) Usual Principal and Subsidiary Status (UPSS) Approach: - The other important approach to measure the labour force parameters is the usual principal & subsidiary status approach. This approach is a hybrid one which takes into consideration both the major time criterion and shorter time period (30 days or more in any economic activity). Thus a person who has worked even for 30 days or more in any economic activity during the reference period of last twelve months is considered as employed under this approach. In this approach, the reference period is same as taken in the usual principal status approach (UPS). This approach is also called the usual status approach.
Source:5th Annual Employment and Unemployment Survey of Labour Bureau
Workers available and actually worked
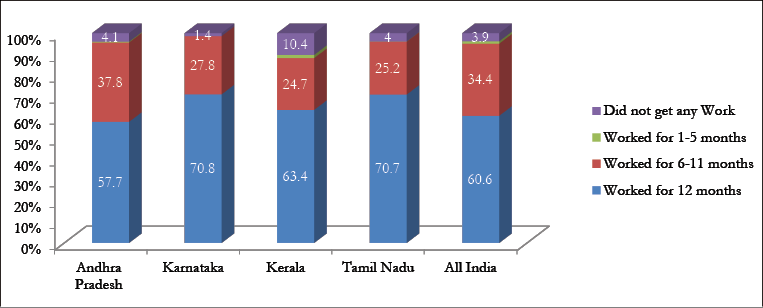
Out of the total workforce available for 12 months the actual percentage of workers engaged in work for 12 months is 63.4 in Kerala. In Karnataka and Tamil Nadu this status is 70.8 and 70.7 respectively. Period wise classification in Kerala shows that 24.7 percent of the workers are engaged in work for a period 6 to 11 months and 10.4 percent of workers are engaged in work for 1 to 5 months. Figure 3.30 shows the details of workers available for 12 months but actually worked in Kerala and other southern states.
Figure 3.30
Workers available for 12 months but actually worked in percentage
Source: Labour Bureau,Ministry of Labour and Employment,GoI.
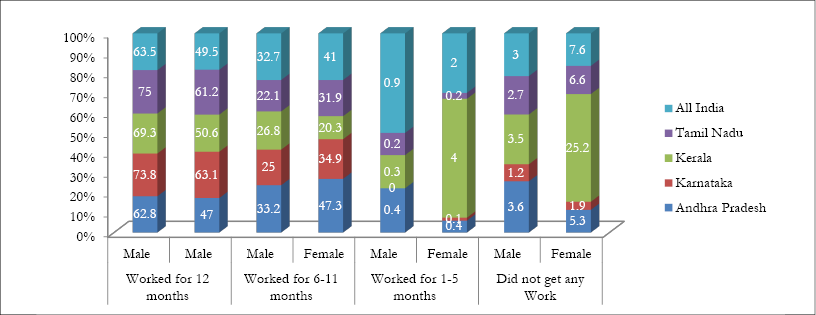
Gender wise classification shows that male workers actually engaged in works available for 12 months is 69.3 percent and female workers for the same period is 50.6 percent in Kerala. Generally, male workers have more days actually worked than the female workers. Male – Female difference for the workers available for 12 months and actually worked in Kerala is 18.7 per cent which is 8 per cent higher than Karnataka, 4.9 per cent than Tamil Nadu and 4.7 per cent than all India average of 14 per cent. Figure 3.31.shows the male female workers available for 12 months but actually worked in Kerala and other southern states.
Figure 3.31
Male – Female workers available for 12 months but actually worked, in per cent
Source: Labour Bureau,Ministry of Labour and Employment,GoI.
Workers availing Social Security
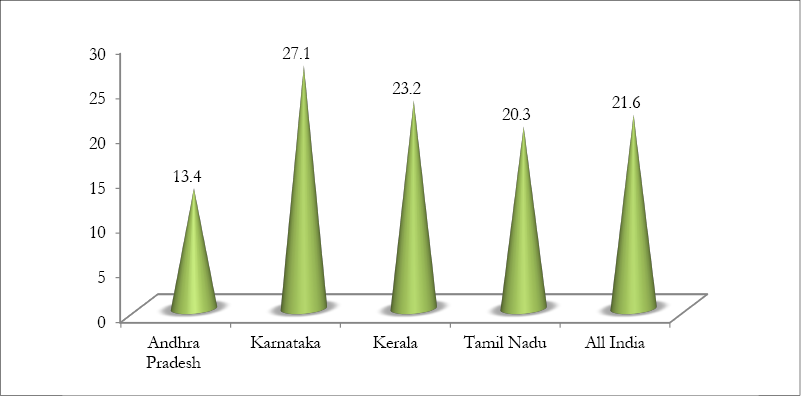
Workman social security plays a vital role in economic and social livelihood of every worker. A worker in Kerala is relatively protected than other parts of the country. As per the report of 5th Annual Employment and Unemployment survey, the percentage of workers except self- employed who availing social security in Kerala is 23.2 which is 1.6 percent higher than national level and 9.8 higher than Andhra Pradesh and 2.9 percent than Tamil Nadu. Among the southern states, Karnataka provides social security to 27.1 percent of the workers except self-employed which is 3.9 percent higher than Kerala. Figure 3.32 shows the details of workers except self-employed availing social security in Kerala and other parts of southern India.
Figure 3.32
Workers except self-employed who availing social security
Source: Labour Bureau,Ministry of Labour and Employment,GoI
Workers received paid leave
Paid leave will enable workers to meet the needs of their families and of the firms they work for in better and more productive ways. The percentage of workers except self-employed who received paid leave in Kerala is 23.9 per cent which is 3.3 per cent higher than national average and 14.6 than Andhra Pradesh and 4.9 per cent than Tamil Nadu. Figure 3.33 shows the details of paid leave for workers except self-employed in Kerala and other southern states.
Figure 3.33
Workers except self-employed received paid leave in percentage

Source: Labour Bureau,Ministry of Labour and Employment,GoI.
Social security & cpaid leave for Casual workers
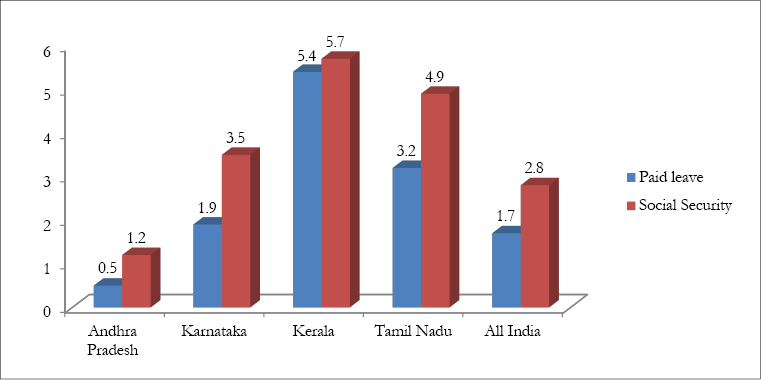
Casual workers are not part of the permanent workforce, but they supply services on an irregular or flexible basis, often to meet a fluctuating demand for work. Level of benefits received by the casual workers is the symbol of labour friendly approach of the society. Relatively, benefits received by casual workers in Kerala are much better than other states of the country. The casual workers who receive social security in Kerala is 5.7 percent which is 2.9 percent higher than the national average. In case of paid leave, 5.4 percent of the casual workers in Kerala received the benefit which is 3.7 per cent higher than the national average and 4.9 per cent higher than Andhra Pradesh and 3.5 per cent than Karnataka. Figure 3.34 shows the percentage of casual workers received paid leave and social security in Kerala and other parts of the south India.
Figure 3.34
Casual workers received Paid Leave and Social Security in percentage
Source: Labour Bureau,Ministry of Labour and Employment,GoI.
Daily Wage Rate
As compared to other parts of the country, reported wage rate of workers in both agricultural and non-agricultural sectors of Kerala is high. Average daily wage rate of agricultural and non-agricultural workers in India published by Labour Bureau, Government of India shows that for male general agricultural workers in rural Kerala it is 590 as on June 2015.The national average of the wage rate for this category of workers is only 232.The wage rate in Kerala is over 150 percent higher. Figure 3.35 shows the wage rate of male agricultural workers in rural area in Kerala vis-a-visthe national average and the southern states.
Figure 3.35
Average Daily Wage Rate of Male Agricultural Workers in Rural Kerala*

Source: Labour Bureau,Ministry of Labour and Employment,GoI.
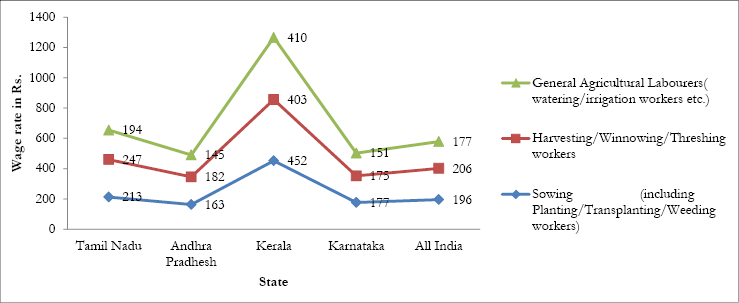
For female agricultural workers in rural Kerala, 410 is the average daily wage rate compared to the national average of 177. For sowing and harvesting workers, the wage rate in Kerala are 452 and 403 compared to the national average of 196 and 206 respectively. A comparison of daily wage rates of female agricultural workers in southern states is given in the Figure 3.36
Figure 3.36
Average Daily Wage Rate of Female Agricultural Workers in Rural Kerala*
Source: Labour Bureau,Ministry of Labour and Employment,GoI.
*As on June 2015
Even though the wage rates of agricultural labourers in rural Kerala are higher than the wages in other parts of the country, the wage disparity among the male and female workers is noticeable. The male-female wage gap among the rural workers engaged in harvesting/winnowing/threshing is 33 per cent that is female worker wage rate is equal to 67 per cent of male workers’ wage rate.Table 3.16 shows the male-female difference of agricultural workers in Kerala and other southern states of India.
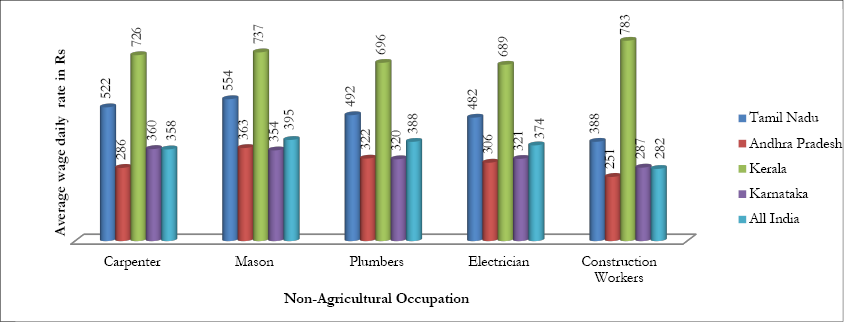
Similar to agricultural workers, the wage rate for non agricultural labourers in rural Kerala is also higher than those in other parts of the country. Figure 3.37 shows the average daily wage rates of the non agricultural workers engaged in different occupations in Kerala. The daily wage rate of a carpenter in Kerala is 726, which is 102 per cent higher than the national average of 358. Likewise, the average daily wage rate of a mason in Kerala is 737 which is 86 per cent higher than the national average of .395.
Table 3.16
Wage difference among male and female agricultural workers in Kerala
| State | Sowing (including Planting / Transplanting / Weeding workers) | Harvesting / Winnowing / Threshing workers | General Agricultural Labourers | |||
| Wage rate (Female) | per cent of women wage rate to men | Wage rate (Female) | per cent of women wage rate to men | Female wage rate | per cent of women wage rate to men | |
| Tamil Nadu | 213 | 66 | 247 | 65 | 194 | 56 |
| Andhra Pradhesh | 163 | 73 | 182 | 80 | 145 | 69 |
| Kerala | 452 | 69 | 403 | 67 | 410 | 70 |
| Karnataka | 177 | 74 | 175 | 70 | 151 | 71 |
| All India | 196 | 80 | 206 | 84 | 177 | 76 |
Source : Compiled data from Labour Bureau, Ministry of Labour and Employment,GoI
Figure 3.37
Average Daily Wage Rate of non-agricultural workers in rural Kerala
Source: Labour Bureau, Ministry of Labour and Employment, GoI
The average daily wage rates are much higher in Kerala that attracts in-migrants into the state, especially where wage rates are very low. Further, the wide disparity in male-female wage rates is an indication of the fact that the perception of gender equality is far away from reality.
Composition of Workers
The labour community in Kerala mainly consists of those who are engaged in the informal sector (loading & unloading, casual work, construction work, brick making self employment), traditional industries (coir, cashew, handloom, beedi , manufacturing sector (small, medium and large industries), IT industry, units in export promotion zones and those who are seasonally employed.
Industrial Relations
Healthy relation between employer and employee is the key to sustained industrial development. The responsibility of the Labour Department is to aid and maintain a harmonious balance between the labourers and management to maintain conducive atmosphere for achieving the objective of industrial growth and prosperity in the state.
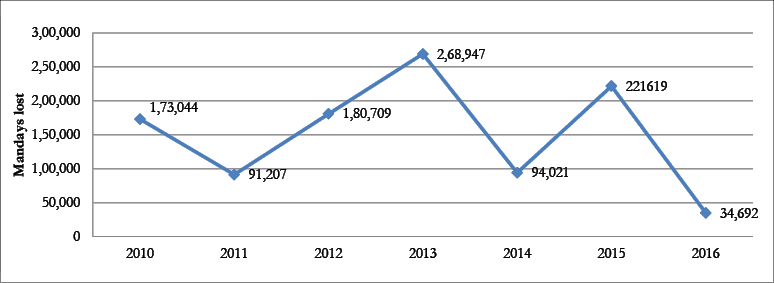
The man-days lost due to strikes in the state for the year 2016 (upto October) is 34 thousand as against 2.68 lakh in the year 2013. Figure 3.38 shows the man days lost due to strikes in Kerala. (Appendix 3.51).
Figure 3.38
Mandays lost due to strikes
Source : Ministry of Labour and Employment, Government of India
* Upto October 31, 2016
Man days lost due to lock out
However, man days lost due to lock out shows an increasing trend over the last two years. During the year 2014, total man days lost due to lock out is 2.91 lakh, which increased to 4.69 lakh in 2016 (upto October 31, 2016). Figure 3.39 shows the trend of man days lost due to lock out in Kerala (Appendix 3.52).
Figure 3.39
Mandays lost due to lock out in Kerala

Source:Labour Commissionerate
* Upto October 31, 2016
Man days lost due to Lay off
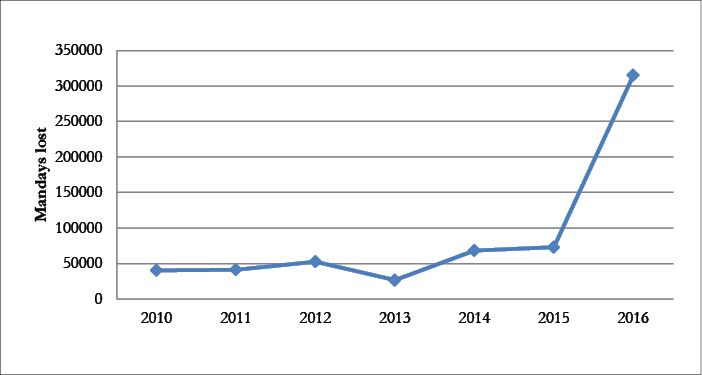
Likewise, mandays lost due to lay off is 68.33 thousand in 2014 which increased to 3.15 lakh in 2016 (October 31, 2016). Figure 3.40 shows the trend of mandays lost due to lay off in Kerala. (Appendix 3.53.)
Figure 3.40
Man days lost due to lay off
Source: Labour Commissionerate,GoK.
* Upto October 31, 2016
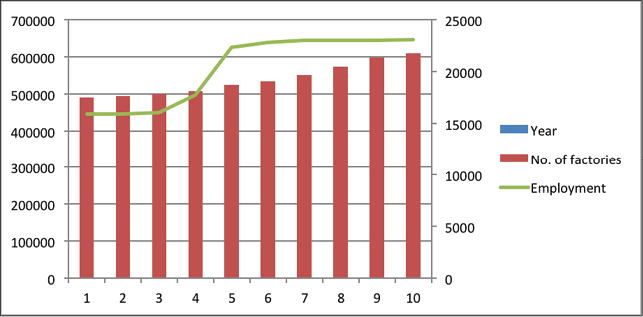
This is despite the fact that for the last ten years, the number of working factories in the state has steadily increased.
Number of factories working in the state during 2005 was 17641, which has increased to 22834 by 2016.Subsequently the average daily employment creation in these factories increased from 4.46 lakh in 2005 to 7.02 lakh in 2016. Figure 3.41 shows number of working factories and employment details in Kerala.
Figure 3.41
Number of Working Factories in Kerala
Source: Factories and Boilers Department, GoK
Industrial Disputes
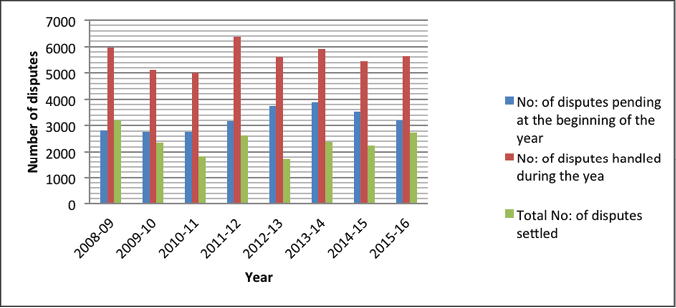
Providing a platform for raising grievances and settlement of the issues between employee and employer is an essential requirement for ensuring harmonious labour relations in the state. Industrial Disputes Act of 1947 provides the legal framework for the same though it applies only to the organised sector. It also regulates lay off and retrenchment. Number of disputes pending at the beginning of the year decreased from 3890 in 2012-13 to 2913 in 2015-16.There is an improvement in settlement rate of disputes as well. The total disputes handled during 2013-14 was 5909 and the disputes settled for the same period was 2384 which is 40.3 percent of the disputes handled. In 2015-16 number of disputes handled is 5642 and settled is 2729 which is 48 percent of the disputes handled. Details of number of disputes in Kerala are given in the Figure3.42. (Appendix 3.54)
Figure 3.42
Industrial Disputes Details, in number
Source: Labour Commissionerate,GoK
Concepts as defined in Industrial Disputes Act, 1947
Strike :-Section 2(q) of the Act defines the term ‘strike’ as cessation of work by a body of persons employed in any industry acting in combination or a concerted refusal, or a refusal under a common understanding of any number of persons who are or have been so employed to continue to work or to accept employment.
Lockout:-Lockout as defined in section 2(1) means the temporary closing of a place of employment, or the suspension of work, or the refusal by an employer to continue to employ any number of person employed by him.
Layoff :-As per section 2(KKK) of the Act, ‘Lay Offs’ means the failure , refusal or inability of an employer on account of shortage of coal, power or raw materials or the accumulation of stocks or the breakdown of machinery or natural calamity or for any other connected reason to give employment to a workman whose name is borne on muster rolls of his industrial establishment and who has not been retrenched.
Source: Statistics on Industrial Disputes, closure, retrenchments and lay-offs in India during the year2013, Labour Bureau, Ministry of Labour,GoI
Safety of the Factory Workers
The Department of Factories and Boilers is the statutory authority to ensure safety, health and welfare of all workers in factories and the general public, living in the vicinity of factories through implementing various laws. The department carries out various programmes for the safety of the workers. During 2016-17(upto October 31, 2016), 84 priority inspections have been done for Major Accident Hazard (MAH) factories, 125 air monitoring studies were completed in hazardous factories,1232 medical examination of crusher factory workers and 47 inspections of hazardous factories other than MAH factories were conducted . The Department has been conducting training programmes not only for factory workers and employees but also for school children and general public near factory premises. (Appendix 3.55, Appendix 3.56, Appendix 3.57).
Rashtriya Swasthya BeemaYojana (RSBY)
Rashtriya Swasthya BeemaYojana (RSBY) is a Health Insurance Scheme for BPL workers and their families in the unorganized sector. This was introduced during 2008-2009 in all the 14 districts of Kerala. The annual insurance cover or in-patient treatment benefit is for a maximum amount of Rs. 30,000/- for a family of 5 members including the worker, spouse, children and dependent parents (if included in the BPL family list). The annual insurance premium is fixed through a tender process. The State Government provides 40 per cent of the premium and administrative cost. The Central Government provides 60 per cent of the premium (including cost of smart card) directly to the implementing agency, CHIAK (Comprehensive Health Insurance Agency, Kerala).The beneficiaries need to pay only 30/- as registration fee. The scheme has been implemented in the state since October, 2008. (Appendix 3.58)
Comprehensive Health Insurance Scheme (CHIS)
Comprehensive Health Insurance Scheme (CHIS) extends to all families other than the BPL families as per the guidelines of Government of India. The non-RSBY population is divided into two categories: (a) those belonging to the BPL (poor) list of the State government but not to the list as defined by the Government of India and (b) APL families that belong neither to the State Government list nor to the list prepared as per the guidelines of Government of India.In the case of the families belonging to the category (a), the beneficiaries will have to pay 30/- per annum per family as beneficiary contribution Smart Card. Under CHIS, a family can avail in-patient benefit and for upto 30,000/ as in the case of RSBY. Government and private hospital wise details of utilisation of the scheme is given under the health section in Chapter 4. Given the fact that only the empanelled hospitals (Public, Private and co-operative hospitals) are allowed to extend the RSBY/CHIS benefits, the quality and services is assured. Further, the coverage is likely to be increased to 1,00,000/-. In addition to RSBY and CHIS, the state government has also introduced another scheme called CHIS Plus. Under this scheme, the RSBY-CHIS BPL families are eligible for an additional 70,000/- treatment benefit for patients of cardiology, neurology,and oncology .
Aam Admi Bima Yojana campaign
Government of India has launched a new insurance scheme called Aam Admi BimaYojana(AABY) covering 48 categories of households in the country. This has been implemented in the State since 2007-08. As per the scheme, the head of rural landless families or one earning member in each such family will be insured. This scheme is also implemented through CHIAK. The premium under the scheme will be 200/-. Out of which,50 per cent shall be subsidy from the fund created for this purpose by Central Government and remaining 50 per cent will be contributed by the State Government.
Employees State Insurance Scheme
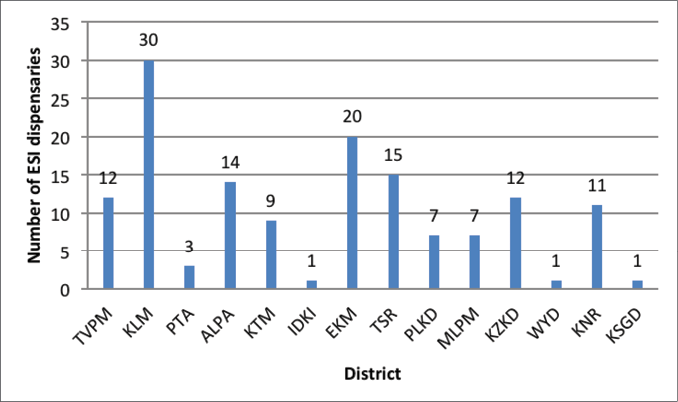
The Employees’ State Insurance Scheme (ESI Scheme) of the Indian Government aims at protecting ‘employees’ against the hazards of sickness, maternity, disablement and death due to employment injury and to provide medical care to insured persons and their families. The comprehensive social security provisions are based on the ESI Act 1948.This scheme covers all the employees working in factories running on non-seasonal power that employ 10 or more persons, and factories not using power that employ 20 or more persons. It also includes those working in shops, hotels, restaurants, cinemas, road motor transport undertakings and newspaper establishments. Each insured employee and their employer are required to contribute a certain percentage of their wages to the ESIC every month. The ceiling wage rates are revised from time to time. The ESI Scheme runs like most of the social security schemes. It is a self-financing health insurance scheme and the contributions are raised from covered employees and their employers as a fixed percentage of wages. The payments are to be made on a monthly basis. An employee covered under the scheme has to contribute 1.75 per cent of the wages whereas the employer contributes 4.75 per cent of the wages payable to an employee. The total contribution in respect of an employee thus works out to 6.5 per cent of the wages payable. However, employees earning less than 50 a day are exempted from making the contribution. All insured persons and dependants are entitled to free, full and comprehensive medical care under the scheme. This medical care is provided through a network of ESI dispensaries, empanelled clinics, diagnostic centres and ESI hospitals. Super speciality facilities are also offered through empanelled advanced medical institutions. Currently, six types of benefits are provided. These are medical, sickness, maternity, disablement, dependants’ and funeral expenses. In Kerala there are 143 dispensaries whose distribution across the state is given in Figure 3.43.
Figure 3.43
District wise ESI Dispensaries in Kerala, in number
Source: Directorate of Insurance Medical Services, TVPM
Migrant Labour
The recent trend in the employment sector in the State shows a large inflow of migrant workers from other states such as West Bengal, Bihar, Odisha, Uttar Pradesh, Chhattisgarh,and Jharkhand besides the neighbouring states. Working conditions of the inter-state migrant workmen are dealt under the Inter State Migrant Workmen Regulation of Employment and Conditions of Service Act,1979. As per the provisions of the Act, the contractor has to obtain a recruitment license from the state from where the workers are recruited (Original State) and an employment license from the state where they are employed (Recipient State).Accordingly the contractor and the principal employer become liable for ensuring the provisions envisaged in the enactment as an immediate employer and the principal employer respectively. But usually these workers cannot be brought under the purview of the enactment due to lack of statutory ingredients required to attract the ambit of the enactment such as an intermediary third party/contractor between the principal employer and the workmen. These workers are compelled to live in groups in unhygienic conditions near their working place without proper health facilities.
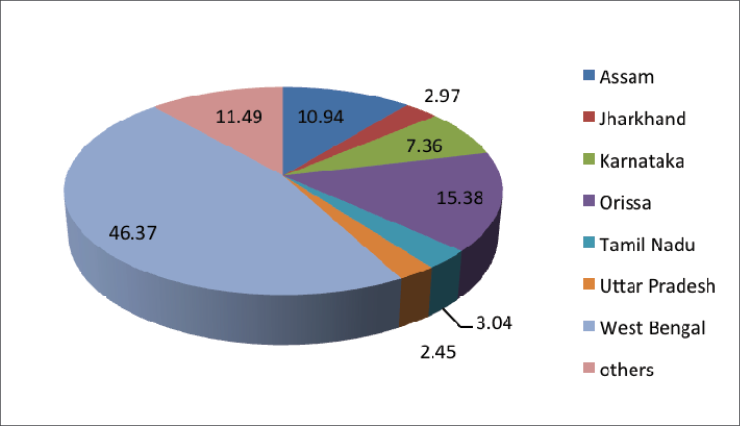
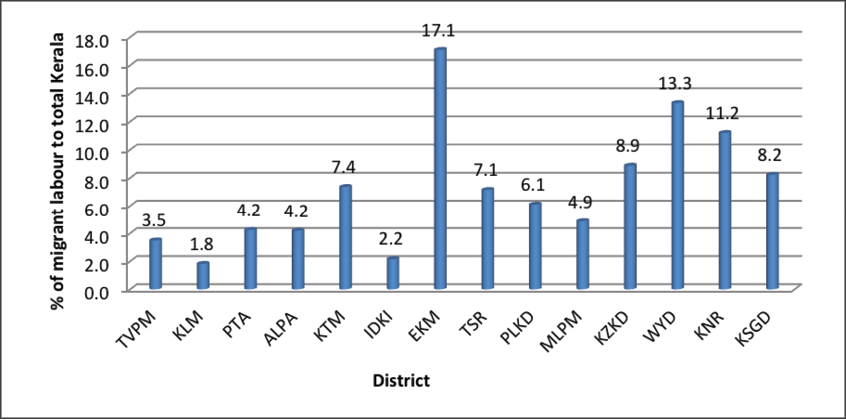
The distribution of migrant workers from different states is given below. As may be seen, out of the total ISM workers 46 per cent are from West Bengal followed by Orissa (15%) and Assam (11%).The origin-wise inter-state migrant workers are given in the Figure 3.44.The distribution of district wise migrated workers in the state shows that Ernakulam has the highest proportion of 17 per cent followed by Wayanad 13 per cent and Kannur 11 per cent. Figure 3.45 presents districtwise ISM workers in Kerala.
Figure 3.44
Origin wise Inter State Migrant Workers in Kerala
Source: Labour Commissionerate, GoK
Figure 3.45
District Wise ISM Workers in Kerala, in per cent
Source: Labour Commissionerate
These ISM workers are engaged in different areas such as agriculture, construction, hotel and restaurant, manufacturing and trade. It is seen that 60 per cent of the migrant workers are engaged in the construction sectors,8 per cent in manufacturing, 7 per cent under hotels and restaurants, 2 per cent each under trade and agriculture and the remaining 21 per cent engaged under other activities.
Due to high human development, Kerala has potential for productive labourforce. Providing opportunity for this productive labour force is the prerequisite of the state. Our social responsibility is to create a model state for labour which can be replicated in other States. Ideally every workman (including migrants)must be ensured with opportunities for work that is to be productive and delivers a fair income, security in the workplace and social protection for families, better prospects for personal development and social integration, freedom to express their concerns, organize and participate in the decisions. These are the integral elements of the ILO’s Decent Work agenda. The functional structure of the Labour Department needs to be restructured to ensure that the Departmental offers effective protection of labour rights for a decent life.

