
Page 262 - economic review
P. 262
INFRASTRUCTURE234
Fig 5.7
Total Installed Capacity
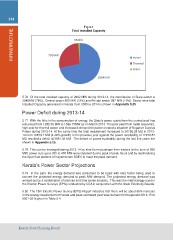
5.76 Of the total installed capacity of 2892 MW during 2013-14, the contribution of State sector is
2245MW (78%), Central sector 360 MW (12%) and Private sector 287 MW (10%). Sector wise total
Installed Capacity generated in Kerala from 2009 to 2014 is shown in Appendix 5.25
Power Deficit during 2013-14
5.77 With the hike in the consumption of energy, the State’s power quota from the central pool has
enhanced from 1292.06 MW to 1536.15MW as on March 2013. The poor yield from hydel reservoirs,
high cost for thermal power and increased demand for power created a situation of Negative Surplus
Power during 2013-14. At the same time the total requirement increased to 20758.29 MU in 2013-
14 from 19879.7 MU (4.42% growth) in the previous year against the power availability of 17876.87
MU resulted a deficit of 2881.42 MU. The details of power availability during the last five years are
shown in Appendix 5.26.
5.78 This can be managed during 2013-14 by short term purchase from traders to the tune of 300
MW, power cuts up to 350 to 400 MW were imposed during peak of peak hours and by rescheduling
the liquid fuel stations of Kayamkulam BSES to meet the peak demand.
Kerala’s Power Sector Projections
5.79 In the past, the energy demand was presumed to be basis with load factor being used to
convert the projected energy demand to peak MW demand. The projected energy demand was
worked out by a combination of end use and time series analysis. This was the methodology used in
the Electric Power Surveys (EPS) conducted by CEA in conjunction with the State Electricity Boards.
5.80 The 18th Electric Power Survey (EPS) Report indicates that there will be about 65% increase
in the energy requirement of Kerala and peak estimated year wise demand for the period 2014-15 to
2021-22 is given in Table 5.4
Kerala State Planning Board