
Page 46 - economic review
P. 46
MACRO ECONOMIC PROFILE18
non-realization of revenue at the estimated level. This shortfall was natural fallout in the context of
persistent macro-economic pressures. There has been considerable shortfall in the level of buoyancy
of State taxes as well as share of Central taxes. The pressure on State finances is further aggravated
by increased expenditure committed by the State in social and developmental activities. A shrinking
tax base particularly in the commodities sector, especially rubber which had been the mainstay of
the economy in the regions of the State producing that commodity contributed detrimentally to the
State’s efforts to mitigate the effects of economic slowdown.
1.46 In the years following the enactment of Kerala Fiscal Responsibility Act, there has been an
improvement in key fiscal indicators. However the State’s fiscal consolidation efforts were affected
adversely in recent years due to various external and domestic compulsions. The revenue deficit
which was 4.37 per cent of GSDP in 2002-03 came down to 1.39 per cent in 2010-11. In 2013-14
revenue deficit was 2.81 percent of GSDP against 2.68 percentage of 2012-13. Fiscal Deficit which
stood at 5.29 per cent of GSDP in 2002-03 significantly improved to 2.93 per cent in 2010-11. Fiscal
deficit GSDP proportion during 2013-14 was 4.20 percent whereas it was 4.29 percent in 2012-13.
1.47 During this period committed expenditure on account of salaries, pensions, and debt charges
increased considerably owing to inflationary pressures. Increased devolution to LSGs and enhanced
payments for welfare schemes and subsidies has also added strain on State’s finances. Fiscal
constraints created by rise in revenue deficit impacted growth in capital expenditure during 2013-14.
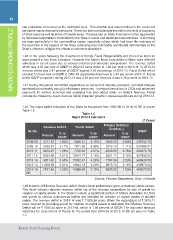
1.48 The major deficit indicators of the State for the period from 2008-09 to 2014-15 BE is shown
Table 1.6
Table 1.6
Major Deficit Indicators (` Crore)
Revenue Deficit Fiscal Deficit Primary Deficit(-)/
Surplus(+)
Sl. No. GSDP
% to % to % to
Amount GSDP Amount GSDP Amount GSDP
2008-09 3711.67 1.83% 6346.21 3.13% -1686.52 -0.83% 202782.79
2009-10 5022.97 2.17% 7871.60 3.39% -2579.12 -1.11% 231998.67
2010-11 3673.87 1.36% 7730.46 2.87% -2040.80 -0.76% 269473.79
2011-12 8034.26 2.61% 12814.77 4.16% -6521.17 -2.12% 307906.00
2012-13 9351.45 2.68% 15002.47 4.29% 7797.66 2.23% 349338.00
2013-14 11308.56 2.81% 16944.13 4.20% 8678.74 2.15% 402973.00
2014-15 7131.69 1.53% 14398.46 3.10% 4800.32 1.03% 465073.00
BE
Source: Finance Department, Govt. of Kerala
1.49 In terms of Effective Revenue deficit, State’s fiscal performance gives a relatively stable picture.
This fiscal indicator denotes revenue deficit net of the revenue expenditure by way of grants for
creation of capital assets. In the State’s context, a significant portion of State’s devolution to LSGs
and grants to various autonomous bodies are intended for creation of capital assets of durable
nature. The revenue deficit in 2013-14 was ` 11308.56 crore. When the expenditure of ` 3815.11
crore incurred for providing grants for creation of capital assets is deducted, the Effective Revenue
Deficit will be ` 7493.44 crore in 2013-14, which is 1.86 percent of GSDP. The important financial
indicators for Government of Kerala for the period from 2004-05 to 2013-14 BE are given in Table
1.7.
Kerala State Planning Board