
Page 51 - economic review
P. 51
23
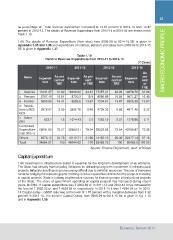
as percentage of total revenue expenditure increased to 13.67 percent in 2013-14 from 13.47 MACRO ECONOMIC PROFILE
percent in 2012-13. The details of Revenue Expenditure from 2010-11 to 2013-14 are shown in the
Table 1.10.
1.65 The details of Revenue Expenditure (item wise) from 2008-09 to 2014-15 BE is given in
Appendix 1.35 and 1.36 and expenditure on interest, pension and salary from 2008-09 to 2014-15
BE is given in Appendix 1.37.
Table 1.10
Trend in Revenue Expenditure from 2010-11 to 2013-14
(` Crore)
2010-11 2011-12 2012-13 2013-14
Items Expendi- As per Expendi- As per Expendi- As per Expendi- As
ture cent of ture cent ture cent of ture per
i. Salaries cent
ii. Pension TRE of TRE TRE of
iii. Interest TRE
iv. Devolu- 11031.97 31.82 16028.82 34.81 17257.41 32.26 19279.78
tions to0LS- 5767.49 16.64 8700.3 18.9 8866.89 16.58 9971.27 31.88
GDs 5689.66 16.41 6293.6 13.47 8265.38
v. Subsi- 13.67 7204.81 16.49
dies
Committed 13.67
Expenditure
total (i0to v) 2978.87 8.59 3896.76 8.46 4739.33 8.86 4971.48 8.22
Others
Total 623.7 1.8 1014.43 2.2 1265.19 2.37 1278.96 2.11
26091.69 75.27 35933.91 78.04 39333.63 73.54 43766.87 72.36
8573.12 24.73 10110.71 21.96 14155.12 26.46 22477.14 37.16
34664.81 100 46044.62 100 53488.75 100 60485.5 100.00
Source: Finance Department, Govt. of Kerala
Capital Expenditure
1.66 Investment in infrastructure sector is essential for the long term development of an economy.
The State has already framed policy initiatives for attracting long term investment in infrastructural
projects. Infrastructure financing is becoming difficult due to deficit in resources. The use of borrowed
funds for bridging the resource gap for meeting revenue expenditure diminishes the scope of investing
in capital projects. State is looking at alternative sources for financing major infrastructural projects
of the State. The share of government spending on capital projects has increased during recent
years. In 2010-11 capital expenditure was ` 3363.69 cr. In 2011-12 and 2012-13 it has increased to
the level of ` 3852.92 cr. and ` 4603.29 cr. respectively. In 2013-14 it was ` 4294.34 cr. In 2013-
14 Capital outlay - GSDP ratio was at the level of 1.07 percent with a marginal decrease from 1.32
percent in 2012-13. The trend in Capital Outlay, from 2008-09 to 2014-15 BE is given in Fig. 1.10
and in Appendix 1.38.
Economic Review 2014