
Page 44 - economic review
P. 44
MACRO ECONOMIC PROFILE16
Price Index in the state during 2013-14 was 7.85 against 14.69 during 2012-13.Centre wise analysis
revealed that, CPI of Thiruvananthapuram reached 266 during 2014 from 143 in 2007. Year wise
analysis shows that CPI in Thiruvananthapuram has increased by 22 basis points in 2014 over
the previous year. (9.02 percent which was higher than the state average of 7.85 percent)In Kollam,
the inflation was 8.57 in 2014. Pathanamthitta registered highest rate of inflation in Kerala, where
CPI registered at 142 in 2007 and it jumped to 259 in 2013 and it hiked to 281 in 2014. On the
other hand, Meppady (Wayanad) registered lowest CPI at 245 in 2014. Inflaction is relatively low in
Thrissur where CPI was 198, 228 and 246 in 2012,2013 and 2014 respectively. Ernakulam, Thrissur,
Palakkad, Malappuram, Kozhikode, Meppady and Kannur has recorded price increase lower than
the state average (Appendix1.25).
1.39 On an average, from January 2014 to October 2014 and compared with previous year, prices
of essential commodities went up considerably. Price of green gram has increased 25 percent in
October 2014 over corresponding period of previous year. Moreover, price of black gram and coconut
oil have also increased about 36 percent and 62 percent respectively on October 2014 in compared
with the same month of last year (Appendix 1.26).
1.40 Wholesale Price Index of Agricultural Commodities in Kerala increased by 1543 points from
6099.12 in Sept.2013 to 7642.59 in Sept.2014. It is observed that wholesale price index went up
about 25 percent during the period of 2014. Altogether wholesale price of the food crops increased
by 13.2 percent as on Sept.2014. (Appendix 1.27).Among the food crops, prices of condiments and
spices showed an all time increase by 55.2 percent during the year 2014. As far as whole sale price
of Non- food crops is concerned, price increased about 59 per cent as on Sept.2014 compared to
the same period of the previous year. Exorbitant price rise of Oil and Oil seeds was the main factor
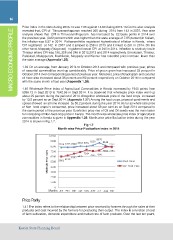
for increasing of Non-food crop price in Kerala. The month-wise wholesale price index of agricultural
commodities in Kerala is given in Appendix 1.28. Month wise price fluctuation index during the year
2014 is shown in Fig.1.7.
Fig 1.7
Month wise Price Fluctuation Index in 2014
Months
Price Parity
1.41 The index refers to the relationship between price received by farmers through the sales of their
products and cost incurred by the farmers for producing their output. The index is a function of cost
of farm cultivation, domestic expenditure and market rate of farm products. Over the last ten years,
Kerala State Planning Board