Foreword
Tourism
Recent Trends in Domestic Tourist Arrivals
The analysis of the domestic tourist arrivals data is also important as foreign tourist arrivals. Unlike international tourism, the domestic tourism in a country is characterised by three factors. They include knowledge, proximity of destinations and lower cost of transport. Certain categories like families, children, teenagers, senior citizens, disabled persons and households with modest incomes are much more represented in domestic tourism than in international tourism. This social diversity gives rise to a large diversity in the demand, in terms of accommodation and tourism products as well as activities and destinations.
In 2015, the number of domestic tourist visits (DTV) to the States/UTs was 1432 million as compared to 1282.8 million in 2014 registering a growth of 11.63 per cent over 2014. The top ten States in terms of number of domestic tourist visits, during 2015, were Tamil Nadu (333.5 million), Uttar Pradesh (204.9 million), Andhra Pradesh (121.6 million), Karnataka (119.9 million), Maharashtra (103.4 million), Telangana (94.5 million), Madhya Pradesh (78 million), West Bengal (70.2 million), Gujarat (36.3 million) and Rajasthan (35.2 million). The contribution of the top 10 States was about 83.62 per cent to the total number of domestic tourist visits during 2015. Tamil Nadu and Uttar Pradesh have maintained the first and second ranks respectively in terms of DTVs in 2015. Andhra Pradesh has gained the third position leaving Karnataka and Maharashtra at the succeeding fourth and fifth positions respectively. Appendix 9.4
The domestic tourist visits in the state marked an annual growth rate of 6.59 per cent with 11.69 million tourists in 2014 to 12.46 million during the year 2015. A marginal decline in the growth rate is noticed when compared with the previous year of 2014. The past ten years data of the growth rate on the domestic tourist arrivals for the state shows that the state has achieved a double digit growth during the year 2008. By 2009, it dropped to 4.25 per cent and then gathered momentum in the succeeding two years. During the years 2012, 2013 and 2014 the rate was stable with an annual rate of 7.41 per cent, 7.75 per cent and 7.71 per cent respectively. Figure 9.5 portrays the growth rate of Domestic Tourists Visits in India and Kerala.
Figure 9.5
Growth rate of Domestic Tourists Visits in India and Kerala, in per cent
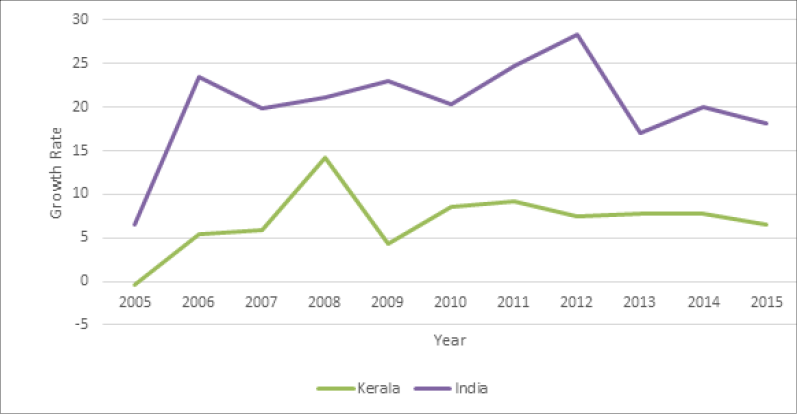
Source: Department of Tourism, Government of Kerala
A comparison with the national data shows that the growth in Kerala’s domestic tourist flow was consistently lower than the national average growth during the last ten years. As per the national tourism statistics of 2014, Kerala occupied 19th rank with respect to Domestic Tourist Visits among the Indian States. On the other hand, the position of the state with respect to Foreign Tourist Arrivals is much better at 7th position among the top ten states in the country.
Month-wise arrival of Domestic Tourists in Kerala
The month-wise data on the arrival of domestic tourists in Kerala shows that the highest inflow of tourists was for the month of December and the lowest was for the month of June. A similar trend is visible for the past five years in the domestic tourist arrival statistics of the State. Here, destinations like Sabarimala and other temple/pilgrimage tourism points (Guruvayoor, Thiruvananthapuram, etc.) are not included. The common practice is to combine pilgrimage with pleasure. Figure 9.6 exhibits the month-wise arrival of domestic tourist traffic from 2010 to 2015.
Figure 9.6
Month-wise arrival of Domestic Tourist in Kerala from 2010 to 2015, in number
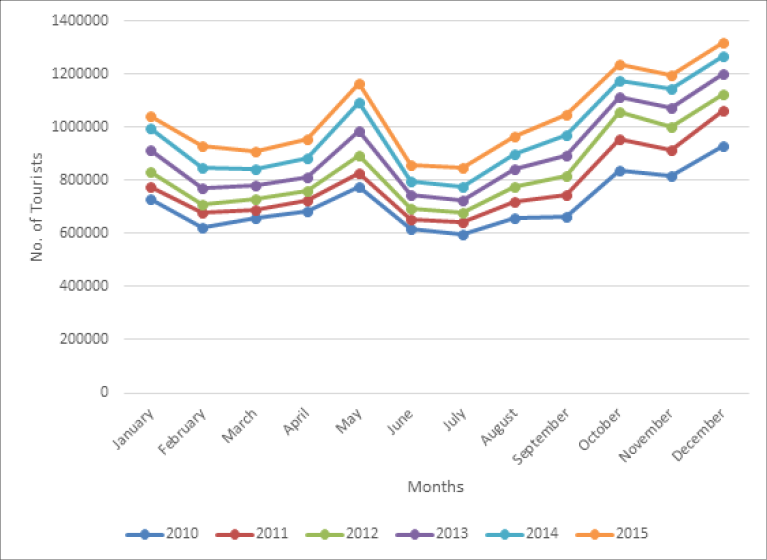
Source: Department of Tourism, Government of Kerala
Source of Domestic Tourists
The statistics on the distribution of domestic tourist visits in Kerala by state of origin during 2015 reveals that about 75.7 per cent originates within the state. With respect to the distribution of other states, Tamil Nadu ranks 1st with a share of 8.02 per cent of domestic tourist visits. Karnataka (4.61 per cent), Maharashtra (2.8 per cent) and Andhra Pradesh (1.83 per cent) were the other important States. The share of northern States was negligible. Appendix 9.5
District-wise arrival of domestic tourists in Kerala
The status of the domestic tourist visits in various districts in the State is slightly different from that of the foreign tourist arrivals. Ernakulam records the top share (23.2 per cent) in receiving domestic tourists followed by Thrissur (21.3 per cent). Thiruvananthapuram occupied the third position (14.9 per cent) and Kozhikode (6.5 per cent) was positioned in the fifth place. Pathanamthitta and Kasaragod were the least-preferred districts among domestic travellers. Since most of the domestic visitors originate from within the State, regional disparity as in the case of foreign tourist arrivals is not visible. The region-wise data during 2015 reveals that domestic tourist visits were high in central Kerala with a share of about 54 per cent followed by northern Kerala (26 per cent) and southern Kerala (20 per cent). Appendix 9.6
Figure 9.7
Region-wise share of domestic tourists in Kerala, in per cent
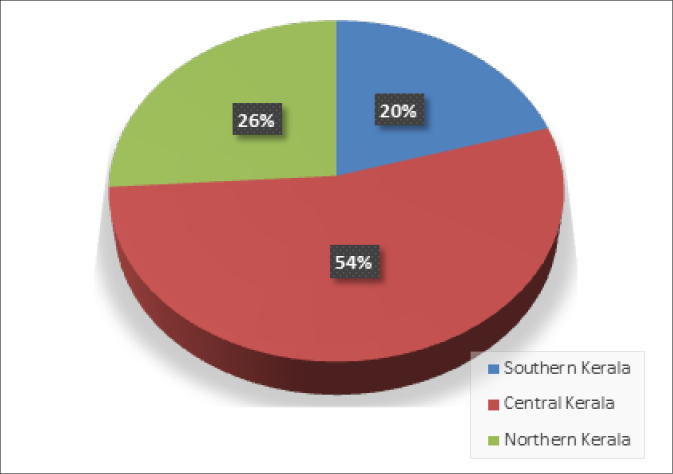
Source: Department of Tourism, Government of Kerala
Status of Accommodation Facilities in Kerala
The data on the availability of accommodation facilities in classified hotels in Kerala during the year 2015 showed a decline in the number of hotels and rooms. The number of hotels declined from 409 in 2014 to 334 by 2015. Consequently, the number of rooms available also declined from 11,387 in 2014 to 9,224 by 2015. The details on the availability of accommodation in classified hotels in Kerala are provided in Appendix 9.7