Foreword
Tourism
The Economic Impact of Tourism
According to the 2016 "Report on the Economic Impact of Travel and Tourism Industry” at the global level by the World Travel and Tourism Council, the total contribution of the sector to the global economy in 2015 was US$7.2 trillion (at 2015 prices) and 9.8 per cent of the world GDP. In GDP growth terms, the Travel and Tourism sector outperformed several other major economic sectors, including manufacturing and retail with annual growth rate of 3.1 per cent in 2015. In terms of employment, in 2015, the Travel and Tourism sector supported 284 million jobs, or 1 in 11 of all jobs in the world. In employment growth terms, the Travel and Tourism sector surpassed various other select industries in 2015, including the financial services, education and health care sectors. The total contribution of Travel and Tourism to employment grew by 2.6 per cent in 2015 registering the creation of 7.2 million new jobs through direct, indirect and induced activities.
All global sub-regions experienced growth in total Travel and Tourism GDP in 2015, with Southeast Asia experiencing the strongest growth at 7.9 per cent, ahead of South Asia (7.4 per cent). They were followed by the Middle East (5.9 per cent), Caribbean (5.1 per cent), Sub-Saharan Africa (3.3 per cent), North America (3.1 per cent), Europe (2.5 per cent), Northeast Asia (2.1 per cent), Latin America (1.5 per cent) and North Africa (1.4 per cent).
According to the World Travel and Tourism Council (WTTC) report, the contribution of travel and tourism sector to the GDP of India was Rs. 8309.4 billion in 2015 (6.3 per cent of GDP). The total contribution of Travel and Tourism to employment was 37,315,000 jobs in 2015 (8.7 per cent of total employment). About 83.2 per cent of the direct contribution to the GDP in the sector was generated by leisure travel spending whereas business spending constituted the balance share of 16.8 per cent. The share of domestic travel spending to the GDP was about 82.5 per cent and the corresponding figure for foreign visitor spending was 17.5 per cent. India occupied the 12th position in the world ranking of travel and tourism’s total contribution to GDP and with respect to employment contribution to the sector, the country was positioned next to China holding 2nd rank at the global level. The report envisages that India’s strong forecast growth will propel it into the top ten Travel and Tourism economies by 2026, moving from 12th in 2015 up to 7th by 2026 in terms of total Travel and Tourism GDP.
Kerala Economy and Tourism
Tourism is an important contributor to the growth of service sector in Kerala. The total revenue (including direct and indirect means) generated from tourism during the year 2015 comes to
26,689.63 crores showing an increase of 7.25 per cent over the last year. During the last decade, the total revenue from tourism registered a compound annual growth rate (CAGR) of 11.33 per cent. It grew from 7,738 crores in 2005 to 26,689.63 crores by 2015. The annual growth rate of income from tourism reveals a fluctuating trend between 2005 and 2015. Between 2013 and 2015, a declining tendency of the growth rate was noticed: from 12.22 per cent in 2013 to 7.25 per cent by 2015.
Foreign Exchange Earnings
The foreign exchange earnings from tourism increased from 1552.31 crores in 2005 to 6949.88 crores by 2015 registering a CAGR of 14.6 per cent. The earnings from foreign tourism showed a steady increase over the years, except for the year 2009 when the global financial crisis affected the flow of foreign tourist Arrivals and led to a decline in foreign exchange earnings. Figure 9.8 captures the data on foreign exchange earnings of Kerala over the last ten years.
Figure 9.8
Trends in foreign exchange earnings of Kerala from 2005 to 2015, in crore
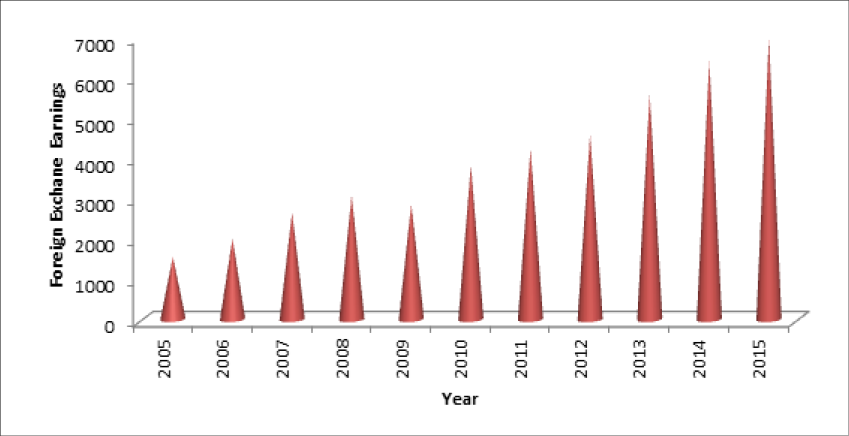
Source: Department of Tourism, Government of Kerala
While analysing the data on the annual growth of foreign exchange earnings, a declining trend in the growth rate has been noticed over the last three years. Figure 9.9 shows the annual growth rate of foreign tourist earnings from 2005 to 2015.
Figure 9.9
Trends in foreign exchange earnings of Kerala from 2005 to 2015, in per cent
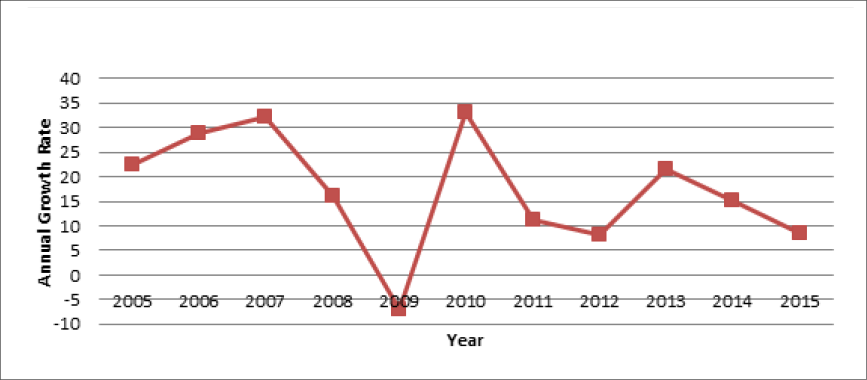
Source: Department of Tourism, Government of Kerala
Domestic Tourism Earnings
The domestic tourist earnings increased from
12981.91 crore in 2014 to 13836.78 crore by 2015. The CAGR of domestic tourist earnings over the last ten years was 11.25 per cent. The domestic earnings from tourism during the year 2005 was 4281.42 crores which rose to 13836.78 crores by 2015. Appendix 9.8 shows the foreign exchange earnings and domestic tourist earnings including revenues from indirect sources from 2005 to 2015.
Tourism and Employment
The contribution of tourism to total employment has direct, indirect and induced impacts. Jobs generated by tourism are spread across the economy directly in tourism sectors like travel agencies, accommodation sector, and airlines and indirectly to retail, construction, manufacturing and telecommunications.
According to a study "Regional Tourism Satellite Account for Kerala and Madhya Pradesh 2009-10”, commissioned by the Ministry of Tourism, Government of India, the tourism sector has generated over 14 lakh jobs in Kerala. The total number of jobs created directly and indirectly by the sector between 2009 and 2012 turned out to be 23.52 per cent of the total employment in Kerala. (Table 9.1)
Table 9.1
Contribution of Tourism Sector to Total Employment between 2009 and 2012, in per cent
| Share in Employment (in per cent) | |||
| Country/ State | Direct Impact | Indirect + Induced Impact | Total Impact |
| India | 4.4 | 5.8 | 10.2 |
| Kerala | 9.9 | 13.6 | 23.5 |
Source: Ministry of Tourism, Government of India
STATE GOVERNMENT SPENDING ON TOURISM SECTOR
Tourism Under Five Year Plans
Tourism sector was brought under the purview of Five Year Plans since the second Five Year Plan onwards. Till the end of the Fifth Plan, the sector had not received much attention. The Sixth Five Year Plan (1980-85) gave due emphasis for increasing the State’s share of international tourist traffic to India while at the same time providing convenient packages of facilities for domestic tourists visiting Kerala from all over the country. The Plan envisaged the pooling of resources not only of the central and state governments, but also from the private sector in achieving the plan objectives. The Government of Kerala declared tourism as an industry in July 1986.
The overall plan outlay to the sector has been increasing over the years but the share of tourism sector in the total state plan outlay is negligible. The allocation to the tourism sector has not been above one per cent except during the ninth plan period. Table 9.2 illustrates the outlay to tourism sector and the share of tourism in total outlay over various plan periods.
Table 9. 2
Allocation and Expenditure on Tourism in the State Plan over Various Plan Periods, in lakh
| Period | Total Plan Outlay | Outlay for Tourism | Percentage share of Tourism | Actual Expenditure |
| I Plan | 3003 | -- | -- | -- |
| II Plan | 8701 | 13.00 | 0.15 | 8.00 |
| III Plan | 17000 | 50.00 | 0.29 | 22.00 |
| Annual Plan | 14254 | 31.00 | 0.22 | 19.00 |
| IV Plan | 25840 | 50.00 | 0.19 | 55.00 |
| V Plan | 56896 | 71.00 | 0.12 | 79.00 |
| Annual Plan | 39296 | 130.00 | 0.33 | 132.27 |
| VI Plan | 148755 | 672.00 | 0.45 | 556.80 |
| VII Plan | 221100 | 850.00 | 0.38 | 833.69 |
| Annual Plan | 144200 | 650.00 | 0.45 | 816.95 |
| VIII Plan | 687648 | 5301.00 | 0.77 | 5707.85 |
| IX Plan | 1575500 | 19266.00 | 1.22 | 17397.81 |
| X Plan | 2522643 | 2777.00 | 0.11 | 2487.68 |
| XI Plan | 4560547 | 48873.00 | 0.15 | 61774 |
| XII Plan | 10200000 | 110140.00 | 0.29 | 67506.24* |
*Expenditure status upto October 31, 2016
Source: Plan Outlay and Expenditure, Kerala Vol 1 and 2, Kerala State Planning Board.
A significant increase in allocation is noticed during the Ninth Plan as the outlay was raised to 192.66 crores from 53.01 crores during the 8th plan period. However, during the 10th plan period, the outlay to the sector fell to 27.7 crore, which was subsequently increased during 11th and 12th Plan periods.
In terms of the percentage share of allocation of tourism sector in the total plan outlay, the share of the sector increased from 0.77 per cent in 8th plan to 1.22 per cent by the 9th plan period. But the momentum gathered by the sector during the 9th plan period did not last for long and the share of the tourism sector in the total plan outlay declined to 0.11 per cent in 10th Plan. It increased marginally to 0.15 per cent by 11th plan and to 0.29 per cent by the 12th Five Year Plan.
Swadesh Darshan Scheme
This Scheme is proposed to be implemented in a Mission Mode. The main Mission objectives and strategy are as under:-
Mission Objectives
- Develop circuits having tourist potential in a planned and prioritized manner
- Integrated development of infrastructure in theme based circuits;
- Promote cultural and heritage value of the country;
- Provide complete tourism experience with varied thematic circuits;
- Enhancing the tourist attractiveness in a sustainable manner by developing world class infrastructure in the circuit destination
- Follow community based development and pro-poor tourism approach
- Creating awareness among the local communities about the importance of tourism for them in terms of increase in source of income, improved living standards and overall development of the area;
- Promote local arts, cultural, handicrafts, cuisine etc to generate livelihoods in the identified regions
- Harness tourism potential for its direct and multiplier effects in employment generation and economic development;
- Leverage public capital and expertise;
Mission Strategy
- To identify themes based circuits that have potential to be showcased as world class tourism products in consultation with the stakeholders;
- To ensure that the development of theme based circuits adhere to the sustainability and carrying capacities of the destinations;
- To create a framework for classifying infrastructural gaps in the identified circuits that have been major roadblocks in unlocking the potential of these circuits;
- To plan in an integrated manner the development of these circuits in a specific timeframe ensuring full convergence of state and central government schemes as well as private sector investments
- To follow a comprehensive area development approach for ensuring all the facilities required by the tourists in the identified circuits.
State and Central Government Plan Allocation
In addition to the State Plan Allocation, the Ministry of Tourism, Government of India has also been earmarking funds for tourism projects in the State. Table 9.3 shows the funding of State and Union Governments to Kerala Tourism since 2011-12. State funds include supplementary allocation over and above the budgetary allocation.
During 2015-16, the State has received an amount of 99.34 crores from the Central Government under the scheme Swadesh Darshan for integrated infrastructure development of theme based tourist circuits. Under the 13 identified tourism circuits all over India, the state has received the above grant for the development of Pathanamthitta- Gavi-Vagamon-Thekkady as Eco-Tourism Circuit in Idduki and Pahanamthitta Districts.
Out of the allotted amount (including SDG) of . 230.45 crores, the State has sanctioned programmes and projects for an amount of 158.68 crores during 2015-16. The important programmes/projects sanctioned by the state include:
- Science Park at Wandoor – 5.00 crores
- Hop on-Hop off bus services – 1.35 crores
- Take a break way side amenities (18 nos)- 8.68 crores
- Setting up of light and sound show and dynamic illumination at Bakel – 4.00 crores.
- Farm tourism development- Priyadarshini Tea Environs, Priyadrshini Estates, Pancharakolli, Wayanad- 1.00 crore.
- Development of Neyyar dam as a tourist destination – 4.65 crores.
- Development of Perumathura Beach in Trivandrum- . 3.00 crores
- Master plan for Modernisation and Tourism Development of Vilagankunnu – 2.00 crores.
- Construction of Yathri Nivas at Athirappalli- 5.00 crores
- Development of break water tourism at Thangasserry, Kollam- 2.5 crores
- Nilambur Tourist Hub- 2.00 crores
- Punyadarshana Complex at Sannidhanam- 7.5 crores
- Development of Tourism infrastructure at Kumarakom- 9.77 crores
- Folklore park at Thiruvegappuram, Palakkad district- 1.00 crores
- Clean Destination campaign- 3.69 crores
Table 9.3
Allocation and Expenditure on Tourism in the State Plan over Various Plan Periods, in lakhs
| Year | State Funding* | Union Funding | Total |
| 2011-12 | 182.49 | 23.75 | 206.24 |
| 2012-13 | 180.53 | 78.26 | 258.79 |
| 2013-14 | 214.89 | 34.67 | 249.56 |
| 2014-15 | 245.36 | 0.00 | 245.36 |
| 2015-16 | 230.45 | 99.34 | 329.79 |
*Source: Department of Tourism, Government of Kerala
* Plan outlay including SDG
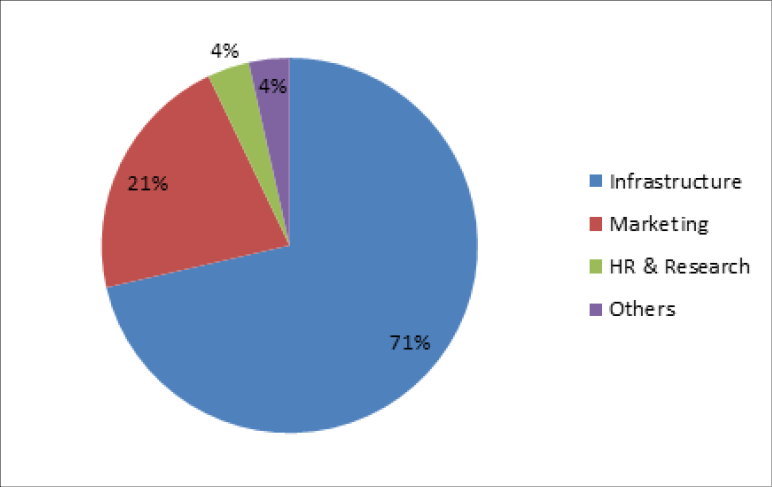
The major chunk of government spending has been on infrastructural projects like development of basic amenities in tourism destinations, beautifications, quality wayside and waterside amenities, state of the art information centres, visitor lounges, infrastructure for land and water based adventure tourism, erecting international quality tourism signage at destinations and en-route, tourism transportations and safety and security aspects of tourists.
The second focus area in government spending has been marketing. The government has succeeded in branding Kerala Tourism in international market with the title "God’s Own Country”. Quality human capital with labour standards is fundamental to tourism development in any region. Shortage of skilled manpower is a challenge to Indian Tourism. The State Government institutions like Kerala Institute of Tourism and Travel Studies (KITTS), State Institute of Hospitality Management (SIHM) and Food Craft Institutes (FCIs) have been creating quality manpower in travel, tourism and hospitality sectors. Figure 9.10 shows the pattern of government spending in 2016-17.
Kerala Island finds mention in Nat Geo’s best destinations list
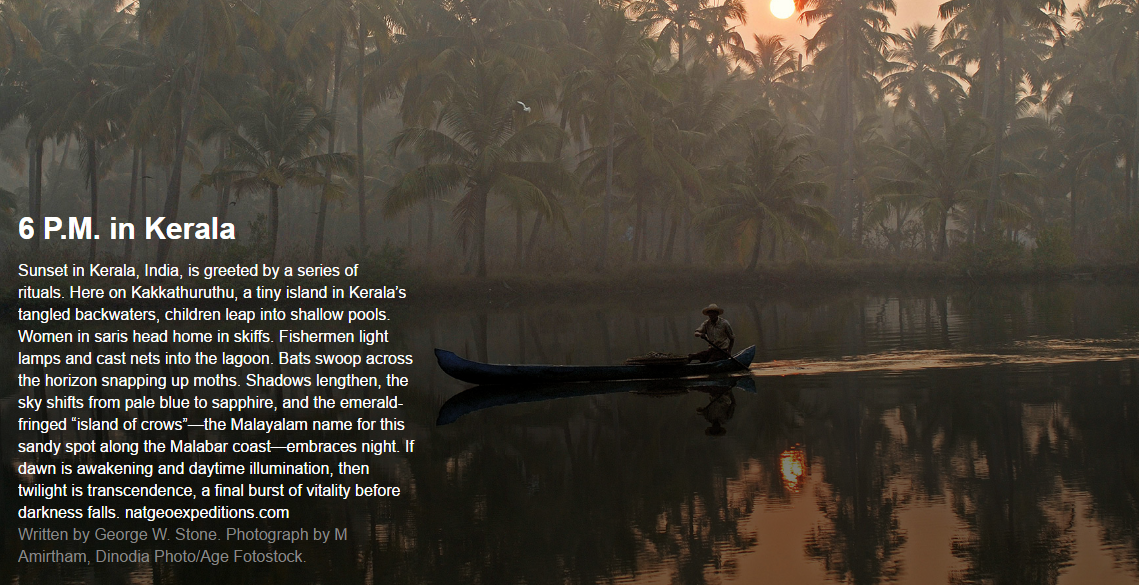
Beginning with hunting the aurora borealis in the northern lights zone in Norway at 12 am, the list includes photos of Hawaii at 5 am, Paris at 6 am, San Francisco at 7 am, Abu Dhabi at 8 am, Melbourne at 9 am, New York at 8 pm, Budapest (Hungary) at 10 pm and Kerala at 6 pm, among others, offering a peek into how different places in the world look like.
Figure 9. 10
Pattern of government spending in 2016-17