Chapter 1
MACRO ECONOMIC PROFILE
Introduction
The pace of growth in developing economies, including India, has slowed down in recent years due to weak external demand, uncertainty, loss of business confidence, high unemployment and fiscal austerity measures introduced in the European Union and USA, which are our major trade partners. The mid-year Economic Analysis 2012-13 (GOI, Ministry of Finance) has emphasized the role of both global and domestic factors in being responsible for the slowdown in India’s growth (5.4 per cent in the first half of 2012-13). The slowdown has been pervasive across all sectors and has been aggravated by high international price of crude oil, relatively tight monetary policy followed by RBI to control inflation, high cost of borrowing, failure of monsoons in June and July and an overall pessimism in investor sentiment. Kerala’s own well -being depends to a great extent on external factors as it is a net importing state for essential commodities and utilities like food, manufactured goods, electricity and other basic agricultural and industrial inputs. Kerala is also a large exporter of several commodities, which are affected by changes in global demand and global prices. Non -resident Keralites, through their inward remittances, are a major contributor to the level of consumption, savings and investment in the State. Hence there is a degree of vulnerability that is inevitable in Kerala’s development.
Kerala has the special distinction of following a model of development, which places it well above other Indian States in terms of key development indicators such as health, education, social welfare and participatory governance. In this chapter, recent trends in key macro aggregates such as Demography, State Domestic Product, Per capita Income, Poverty, Urbanization, Inflation, Banking and State Finances are discussed objectively to bring out the present conditions in Kerala. Subsequent chapters deal with thematic issues and supplement the information given in this chapter through a sectoral lens.
Demography
Although there are many factors which affect the development prospects of an economy, the size and quality of the population remains a major determinant of the potential of an economy. As per the provisional data published from the Directorate of Census, the population of Kerala at the ‘zero hours’ of March 1, 2011 was 3,33,87,677 persons. Out of this 1,60,21,290 ( 48.0 per cent) are males and 1,73,66,387 (52.0 per cent) are females. When the last census was taken in 2001, these figures were respectively 3,18,41,374 total, 1,54,68,614 (48.6 per cent) males and 1,63,72,760 (51.4 per cent) females. Children in the age group of 0 to 6 account for almost 10 per cent of the total population.
1.2 The growth rate of Kerala’s population during the last ten years is 4.9 per cent, one of the lowest rates among Indian States. This was much smaller than the 9.5 per cent growth in population during the decade ending 2001 (previous census). Fig. 1.1 shows that the national rate of growth during the last ten years was 17.6 per cent compared to the previous decade’s rate of 21.4 per cent for the nation. The details are at Appendix 1.1.
Fig. 1.1
Decadal Population Growth of India and Kerala 1901-2011
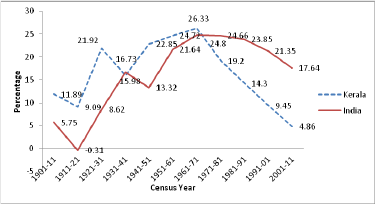
Source: Census of India 2011
1.3 The trend of population growth in the State shows a steady decline, and the coming decade may mark a negative growth rate for the State. Malappuram hased the highest population (12.3 percent) of the State. The lowest population is reported from Wayanad. The growth rate is also maximum (13.4 percent) in Malappuram district during the last decade. It is interesting to note that the growth rates reported for the two districts in Kerala, viz. Pathanamthitta and Idukki are negative. Details are given in the Table 1.1.
Table 1.1
Ranking of Districts by Population Size, 2001 and 2011
| Rank in 2011 | District | Population 2011 | Per cent to total | Population 2001 Rs | Growth Rate | Rank in 2011 |
| 1 | Malappuram | 41,10,956 | 12.31 | 36,25,471 | 13.39 | 1 |
| 2 | Thiruvananthapuram | 33,07,284 | 9.91 | 32,34,356 | 2.25 | 2 |
| 3 | Ernakulam | 32,79,860 | 9.82 | 31,05,798 | 5.60 | 3 |
| 4 | Thrissur | 31,10,327 | 9.32 | 29,74,232 | 4.58 | 4 |
| 5 | Kozhikode | 30,89,543 | 9.25 | 28,79,131 | 7.31 | 5 |
| 6 | Palakkad | 28,10,892 | 8.42 | 26,17,482 | 7.39 | 6 |
| 7 | Kollam | 26,29,703 | 7.88 | 25,85,208 | 1.72 | 7 |
| 8 | Kannur | 25,25,637 | 7.56 | 24,08,956 | 4.84 | 8 |
| 9 | Alappuzha | 21,21,943 | 6.36 | 21,09,160 | 0.61 | 9 |
| 10 | Kottayam | 19,79,384 | 5.93 | 19,53,646 | 1.32 | 10 |
| 11 | Kasaragod | 13,02,600 | 3.9 | 12,04,078 | 8.18 | 12 |
| 12 | Pathanamthitta | 11,95,537 | 3.58 | 12,34,016 | -3.12 | 11 |
| 13 | Idukki | 11,07,453 | 3.32 | 11,29,221 | -1.93 | 13 |
| 14 | Wayanad | 8,16,558 | 2.45 | 7,80,619 | 4.60 | 14 |
Source: Census of India 2011
Literacy:
1.4 Kerala still leads in the nation with 93.9 percent (leaving out the children below six years). In the last census, the rate was 90.9 percent. Among the districts, Pathanamthitta tops with 96.9 percent . Kottayam (96.4 percent) and Alappuzha (96.3 percent) were close behind. The Capital district Trivandrum has 92.7 percent literacy. Palakkad district has the least literacy (88.5 percent).
Sex Ratio:
1.5 Kerala has the highest sex ratio in the country with , 1084 women for 1000 men. This was 1058 during the last census. The all India figures are 933 and 940 respectively for the 2001 and 2011 census. District-wise, in Kerala, Kannur district tops the list with 1133 women for 1000 men, while the lowest is reported from Idukki district (1006). However, what is worrying is that the sex ratio of children below age six is falling from 960 per 1000 in 2001 census to 959 per 1000in 2011 census. While this is much better than the All India average of 912, this trend has to be watched and corrective action has to be taken if necessory.
Density of Population:
1.6 Density of population per sq. km. is 859 in Kerala which is much higher than India (382). Thiruvananthapuram district tops with 1,509 persons and Idukki recorded the lowest with 254 persons. Details are at Appendix 1.2
SECTION 2
Income
National Income
1.7 The Gross National Income (GNI) at factor cost at 2004-05 prices is estimated at र 5150686 crore during 2011-12, as against the previous year’s estimate of र 48,33,178 crore (Table 1.2). In terms of growth rates, the gross national income is estimated to rise by 6.6 per cent during 2010-11, in comparison to the growth rate of nearly 8 per cent in 2009-10. The GNI at factor cost at current prices is estimated at र 8148952 crore during 2011-12, as compared to र 70,78,512 crore during 2010-11, showing a rise of over 15 per cent. The Net National Income (NNI) at factor cost at current prices is estimated at र 7,284,523 crore during 2011-12, as compared to र 6,325,039 crore during 2010-11, showing a rise of 15.2 per cent.
1.8 GDP at factor cost at constant (2004-05) prices in the year 2011-12 is estimated at र 5202514 crore showing a growth rate of 6.5 per cent over the Estimates of GDP for the year 2010-11 of
र 48, 85,954 crore. The GDP at factor cost at current prices in the year 2011-12 is estimated at
र 8,232,652 crore showing a growth rate of 15 per cent over the estimates of GDP for the year 2010-11 of र 71,57,412 crore. The per capita income (per capita GDP at factor cost) in real terms, i.e. at 2004-05 prices, is estimated at र 43,282 for 2011-12 as against र 41,197 in 2010-11, registering an increase of over 5 per cent during the year. The per capita income at current prices is estimated at
र 68,491 in 2011-12 as against र 60,349 for the previous year depicting a growth of 13.5 per cent.
Table 1.2
National Income, Domestic Product & Per Capita Income at Factor Cost(All India)
( र crore)
Sl. No |
Item at factor cost |
At 2004-05 Prices | At Current Prices | ||||
| 2009-10 | 2010-11 (P) | 2011-12 (Q) | 2009-10 | 2010-11 (P) | 2011-12 (Q) | ||
| 1 | Gross National Income (GNI) |
4479973 | 4833178 (7.9) | 5150686 (6.6) | 6,053,585 | 7,078,512 (16.9) | 8,148,952 (15.1) |
| 2 | Net National Income (NNI) | 3959653 | 4268715 (7.8) | 4549652 (6.6) | 5,395,688 | 6,325,039 (17.2) | 7,284,523 (15.2) |
| 3 | Gross domestic product (GDP) | 4507637 | 4885954 (8.4) | 5202514 (6.5) |
6,091,485 | 7,157,412 (17.5) | 8,232,652 (15.0) |
| 4 | Net domestic product (NDP) | 3987317 | 4321491 (8.4) | 4601480 (6.5) | 5,433,588 | 6,403,939 (17.9) | 7,368,223 (15.1) |
| 5 | Per capita Gross domestic product (र) |
38,527 | 41,197 (6.93) | 43,282 (5.06) | 52,064 | 60,349 (15.91) | 68,491 (13.49) |
Source: Central Statistical Organisation.
Note: The figures in parenthesis shows the percentage change over previous year.
Q-Quick Estimate, P- Provisional Estimate
1.9 The details of GDP, NDP, GNI and NNI at current and constant (2004-05) prices from 2004-05 to 2011-12 with percentage change over previous year are given in Appendix 1.3 to 1.6. The sectoral distribution of GDP at constant (2004-05) prices and current prices with percentage change over previous year is given in Appendix 1.7 and Appendix 1.8
State Income
1.10 The quick estimate of Gross State Domestic Product (GSDP) at factor cost at constant (2004-05) prices is र 21010717 lakhs during 2011-12 as against the provisional estimate of र 19186676 lakhs during 2010-11, registering a growth rate of 9.5 percent in 2011-12 compared to just over 8 percent in 2010-11 (Fig. 1.2). At current prices the Gross State Domestic Product is estimated at र 31520567 lakhs (quick estimate) during 2011-12 as against the provisional estimate of
र 26947379 lakhs during 2010-11 showing a growth rate of nearly 17 per cent.
Fig. 1.2
Growth Rate of GSDP at Constant (2004-05) Prices - Kerala
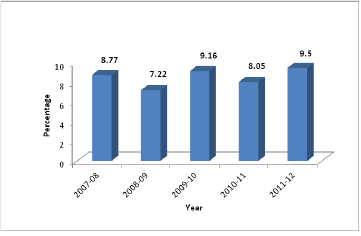
Source : Department of Economics and Statistics
1.11 The quick estimate of Net State Domestic Product (State Income) at factor cost at constant prices (2004-05) is र 18699759 lakhs during 2011-12 compared to the provisional estimate of र 17023691 lakhs during 2010-11, recording a growth rate of 9.9 percent in 2011-12. At current prices the State Income is estimated at र 28087084 lakhs (quick estimate) in 2011-12 compared to the provisional estimate of र 23942585 lakhs during 2010-11. The growth rate of State Income at current prices is 17.3 per cent in 2011-12 compared to 16.2 per cent in 2010-11 (Table 1.3).
Table 1.3
State Domestic Product and Per Capita Income of Kerala
Sl. No |
Item |
Income (र Lakhs) |
Growth Rate (Percent) |
|||
| 2009-10 | 2010-11 (P) | 2011-12 (Q) | 2010-11(P) | 2011-12 (Q) | ||
| 1 | Gross State Domestic Product |
|||||
| a) At Constant (2004-05) prices | 17757135 | 19186676 | 21010717 | 8.05 | 9.50 | |
| b) At Current prices | 23199867 | 26947379 | 31520567 | 16.15 | 16.97 | |
| 2 | Net State Domestic Product | |||||
| a) At Constant (2004-05) prices | 15712270 | 17023691 | 18699759 | 8.35 | 9.85 | |
| b) At Current prices | 20606979 | 23942585 | 28087084 | 16.19 | 17.31 | |
| 3 | Per Capita State Income ( र ) |
|||||
| a) At Constant (1999 2000) Prices | 51897 | 55667 | 60536 | 7.26 | 8.75 | |
| b) At Current Prices | 67804 | 78183 | 90816 | 15.31 | 16.16 | |
Source: Department of Economics and Statistics
P: Provisional Estimate, Q: Quick Estimate
Per Capita State Income
1.12 As per the quick estimates in 2011-12, the per capita Gross State Domestic Product at constant (2004-05) prices was र 60536 as against provisional estimate of र 55667 in 2010-11, recording a growth rate of 8.8 per cent in 2011-12. At current prices, the per capita GSDP in 2011-12 was र 90816 registering a growth rate of 16.2 per cent over the previous year’s estimate of र 78183. The Fig. 1.3 shows that during the period 2006-07 (the entire XIth Plan period) to 2011-12, the per capita state income at constant prices was higher than the per capita national income.
Fig. 1.3
Per Capita Income at Constant Price
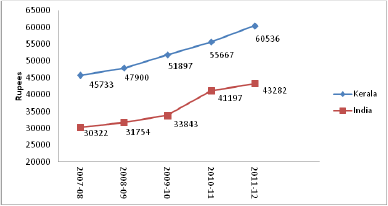
Source: Central Statistical Organization and Department of Economics and Statistics
Sectoral Distribution of Gross State Domestic Product
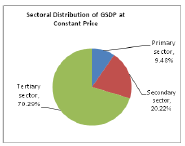
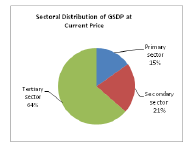
1.13 During 2011-12, the contribution from primary, secondary and tertiary sectors to the GSDP at constant prices (2004-05) was 9.5 per cent, 20.2 per cent and 70.2 per cent respectively. At current prices, the primary, secondary and tertiary sectors contributed 15.1 per cent, 21 per cent and 63.2 per cent respectively to the GSDP during 2011-12 (Fig. 1.4). This difference in sectoral share between constant and current prices shows that inflationary trends in the primary sectors are much higher than in the secondary and tertiary sector.
Fig. 1.4
Sectoral Distribution of GSDP
1.14 While analysing the sectoral distribution of state income it is seen that the contribution from primary sector is decreasing and tertiary sector is increasing. But secondary sector remains almost stagnant. The analysis of annual sectoral growth rate of Gross State Domestic Product shows that tertiary sector recorded the highest rate of growth 11.81 percent in 2011-12 at constant (2004-05) prices followed by secondary sector (7 percent) and primary sector showed a negative growth (-0.7 per cent). At current prices, the tertiary sector recorded a growth rate of nearly 18 percent, primary sector 15.5 percent and secondary sector with 15.2 percent in 2011-12. The details of sectoral distribution of GSDP with percentage during the last three years is given in Appendix 1.9 to 1.11 and the details of GSDP, NSDP at constant and current prices during 2004-05 to 2011-12 are given at Appendix 1.12 to 1.15.
District-wise Gross State Domestic Product
1.15 District wise distribution of Gross State Domestic Product at factor cost at current prices shows that Ernakulam District continues to have the highest income of र 44129.38 crore in 2011-12 as against र 37836.28 crore in 20101-11 registering a growth rate of 16.6 per cent . At constant (2004-05) prices, this amounts to र 30286.66 crore during 2011-12 compared to
र 27596.61 crore during 2010-11. The details are given in Table 1.4 below.
Table 1.4
District-wise Distribution of Gross State Domestic Product
(र Lakhs)
| Sl. No | District |
Gross State Domestic Product at Factor Cost | Growth Rate ( per cent) | ||||
At Current Prices |
At Constant Prices | At Current Prices |
At Constant Prices |
||||
| 2010-11 | 2011-12 | 2010-11 | 2011-12 | 2011-12 | 2011-12 | ||
| (P) | (Q) | (P) | (Q) | ||||
| 1 | Thiruvananthapuram | 2871463 | 3358011 | 2100157 | 2309934 | 16.94 | 9.79 |
| 2 | Kollam | 2041190 | 2385361 | 1427520 | 1559333 | 16.86 | 8.66 |
| 3 | Pathanamthitta | 1098843 | 1286345 | 785578 | 863525 | 17.06 | 10.08 |
| 4 | Alappuzha | 1723815 | 2015165 | 1241826 | 1361875 | 16.90 | 9.15 |
| 5 | Kottayam | 1880383 | 2202442 | 1324493 | 1450284 | 17.13 | 9.26 |
| 6 | Idukki | 1037411 |
1210983 | 667287 | 716116 | 16.73 | 7.66 |
| 7 | Eranakulam | 3783628 | 4412938 | 2759661 | 3028666 | 16.63 | 9.38 |
| 8 | Thrissur | 2570599 | 3010494 | 1889958 | 2082359 | 17.11 | 9.63 |
| 9 | Palakkad | 2082266 | 2433089 | 1453581 | 1582894 | 16.85 | 8.99 |
| 10 | Malappuram | 2152352 | 2519438 | 1491032 | 1624188 | 17.06 | 8.51 |
| 11 | Kozhikode | 2331326 | 2732062 | 1676121 | 1839750 | 17.19 | 8.82 |
| 12 | Wayanad | 537612 | 629425 | 362008 | 392695 | 17.08 | 8.48 |
| 13 | Kannur | 1956146 | 2293771 | 1394441 | 1528965 | 17.26 | 8.89 |
| 14 | Kasaragod | 880344 | 1031041 | 613013 | 670134 | 17.12 | 8.78 |
| GSDP | 26947379 | 31520567 | 19186676 | 21010717 | 16.97 | 9.50 | |
P - Provisional, Q - Quick Estimate
Source: Department of Economics & Statistics
District-wise Per Capita Income
1.16 Growth rate at current prices does not eliminate the inflationary impact. When district level growth rate at constant prices, we compared the “real” GSDP growth rate may be observed as the inflationary impact has been eliminated. Pathanamthitta, Thrissur and Thiruvananthapuram had higher real growth in GSDP than the State Average. Idukki had a much lower growth than other
districts.
1.17 The analysis of district wise per capita income shows that Ernakulam district stands first with the per capita income of र 89131 at constant (2004-05) prices in 2011-12 as against
र 81768 in 2010-11. The district wise per capita income with corresponding rank and growth rate is given in Table 1.5
Table 1.5
District-wise Per Capita Income at Constant (2004-05) Prices
SI No |
District | 2010-11 (P) र |
Rank | 2011-12 (Q) र |
Rank | Growth Rate ( per cent) 2010-11 |
| 1 | Thiruvananthapuram | 59885 | 4 | 65419 | 4 | 9.24 |
| 2 | Kollam | 51741 | 10 | 56132 | 10 | 8.49 |
| 3 | Pathanamthitta | 61325 | 3 | 66940 | 3 | 9.16 |
| 4 | Alappuzha | 56014 | 7 | 60989 | 6 | 8.88 |
| 5 | Kottayam | 63708 | 2 | 69259 | 2 | 8.71 |
| 6 | Idukki | 56406 | 6 | 60127 | 7 | 6.60 |
| 7 | Eranakulam | 81768 | 1 | 89131 | 1 | 9.00 |
| 8 | Thrissur | 59080 | 5 | 64629 | 5 | 9.39 |
| 9 | Palakkad | 51182 | 11 | 55365 | 11 | 8.17 |
| 10 | Malappuram | 36068 | 14 | 39005 | 14 | 8.15 |
| 11 | Kozhikode | 53670 | 9 | 58498 | 9 | 8.99 |
| 12 | Wayanad | 40997 | 13 | 44123 | 13 | 7.62 |
| 13 | Kannur | 54492 | 8 | 59354 | 8 | 8.92 |
| 14 | Kasaragod | 46161 | 12 | 50122 | 12 | 8.58 |
| STATE | 55667 | 60536 |
8.75 |
P: Provisional Q:Quick
Source: Department of Economics & Statistics
1.18 Table.1.5 shows that in 2010-11, the districts of Thrissur, Thiruvananthapuram, Pathanamthitta and Ernakulam had a much higher growth rate than the average growth in per capita income. Idukki and Wayanad showed much lower growth in per capita income than the state average.
1.19 District wise and sectorwise analysis of GSDP reveals that Ernakulam district contributions in all the these sectors are highest. District-wise sectoral distribution of Gross State Domestic Product from 2009-10 to 2011-12 at current and constant (2004-2005) prices are given in Appendix 1.16 to Appendix 1.21
GSDP - Southern States of India
1.20 In 2011-2012, Kerala recorded 9.5 percent economic growth rate, the highest among Southern States and much above the national average. Karnataka posted 6.4 percent growth rate; Andhra Pradesh 6.8 per cent and Tamil Nadu 9.4 percent. The all-India average was 6.5 percent, according to provisional figures available with the Central authorities (see Table 1.6). It may be seen that only Kerala, has shown a higher growth in 2011 - 12 than in the previous year.
Table 1.6
GSDP of Southern State of India at constant (2004-05) Prices
र In Crores
| State Name | 2009-10 | 2010-11 | 2011-12 | Growth Rate 2009-10 & 2010-11 | Growth Rate 2010-11 & 2011-12 |
| ANDHRA PRADESH | 347344 | 381942 | 407949 | 9.96 | 6.81 |
| KARNATAKA | 257125 | 279932 | 297964 | 8.87 | 6.44 |
| KERALA | 177571 | 191867 | 210107 | 8.05 | 9.51 |
| TAMIL NADU | 350258 | 391372 | 428109 | 11.74 | 9.39 |
Source: Hand Book of Statistics RBI (2011-12)
1.21 An analysis of the growth pattern reveals that the Services sector continues to dominate the economy. Segments such as financial services, real estate and hotels performed relatively well. Compared to 2010-2011, the secondary sector recovered marginally in 2011-12. Tamil Nadu’s primary sector’s performance (2.7 percent) was the best among the Southern States, though it did not touch the targeted mark of four percent.
SECTION 3
Poverty
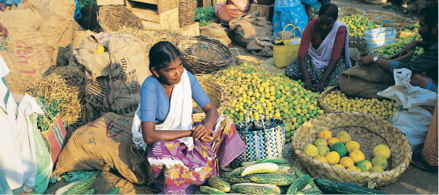
1.22 Poverty may be defined as the inability to attain the minimum standard of living in a society. The poor are those who are unable to achieve basic facilities like food, safe drinking water and shelter, access to information, education, health care, social status, political power or even the opportunity to develop meaningful connections with other people in the society. This condition is absolute poverty. Relative poverty is the condition of having fewer resources or less income than others within a society or country or compared to world wide averages.
1.23. The existing poverty measure of Planning Commission of India is based on the recommended nutritional requirements of 2400 calories/person/day in rural areas and 2100 calories/person/day in urban areas. The official percentage of population below poverty line is estimated based on the household consumer expenditure survey carried out by National Sample Survey Organization (NSSO). Former methods of poverty estimation viz; URP method of estimation and MRP method of estimation have been replaced by Tendulkar method of estimation from NSSO 66th round onwards.
1.24. The state specific poverty line 2009-10 for Kerala is fixed at monthly per capita income of
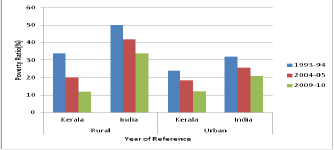
र 775.30 which is above the poverty line fixed by 23 other states. The corresponding figures for Karnataka, Tamil Nadu and Andhra Pradesh are र 629.4, र 639 and र 693.8 respectively. The poverty ratios for the period 1993-94, 2004-05 and 2009-10 based on Tendulker methodology of estimation, pertaining to Kerala and other Southern States and All India are given in Table 1.7 below.
Table 1.7
Poverty Ratio of Southern States ( per cent)
| Sl. No. | Category | Name of State | 1993-94 | 2004-05 | 2009-10 |
| 1 | Rural | Kerala | 33.9 | 20.20 | 12 |
| Tamil Nadu | 51 | 37.50 | 21.20 | ||
| Andhra Pradesh | 48.10 | 32.30 | 22.80 | ||
| Karnataka | 56.60 | 37.50 | 26.10 | ||
| All India | 50.10 | 41.80 | 33.80 | ||
| Urban | Kerala | 23.9 | 18.4 | 12.1 | |
| Tamil Nadu | 33.7 | 19.7 | 12.8 | ||
| Andhra Pradesh | 35.2 | 23.4 | 17.7 | ||
| Karnataka | 34.2 | 25.9 | 19.6 | ||
| All India | 31.8 | 25.7 | 20.9 |
(Source: GOI, 2011-12 “ Economic Survey”, www.mospi.gov.in. NSSO 66th round)
1.25 The poverty ratios of Kerala, (Fig. 1.5) whether rural or urban, were the least in 1993-94 compared to other Southern States as well as All India level. The same status was maintained during 2004-05 and 2009-10. Moreover the trends in Table 1.7 shows that the number of persons below poverty line for Kerala is exhibiting a downward trend. It is possible to acheive a zero poverty State in Kerala.
Fig 1.5
Rural Urban Distribution Of Poverty Ratio India-Kerala in Percentages
1.26 Poverty Index: Every two years, a survey is conducted for assessing the urban poor by Community Development Societies using the poverty index following non-economic criteria with nine risk factors reflecting the poverty situations of families. The neighbourhood community verifies these factors with the identified families. The nine risk factors of the poverty index are furnished below.
• Less than 5 cents of land/no land
• Dilapidated house/no house
• No sanitary latrine
• No access to safe drinking water within 150 meters
• Women headed household
• No regular employed person in the family
• Socially disadvantaged groups SC/ST
• Mentally retarded/disabled/chronically ill member in the family
• Families without colour TV
Any family having 4 or more such risk factors is classified as family at risk of poverty.
1.27 The magnitude of urban poverty has been increasing due to stagnation in manufacturing industry resulting in lower income for urban dwellers. Due to rapid increase in land price and construction costs, a good number of the urban people in Kerala are forced to live in slums. Availability of drinking water and sanitation facilities is grossly inadequate. Urbanization is an important aspect in the process of economic and social development and is associated with many problems such as migration from villages to towns, relative cost of providing economic and social services in the towns of varying sizes, provision of housing for different sections of the people, provision of facilities like water supply, sanitation, transport and power, pattern of economic development, location and dispersal of industries, civic administration etc. Several schemes are being implemented by the Department of Urban Affairs/municipalities/corporations to provide urban infrastructures.
1.28 Only one-fourth of households in slums have electricity. The composition of the poor has been changing. While rural poverty is getting concentrated in the agricultural labour and artisan household, urban poverty results in casual labour households
1.29 Various poverty alleviation programmes both rural and urban sectors that are being implemented are given in other chapters of the review. There are many agencies and Government Departments whose mandate is to eradicate poverty in Kerala.
Kudumbashree Mission and Alleviation of Poverty
1.30 This Community Based Organisation is a three-tiered structure with its apex tier anchored in the local self governments. Neighbourhood Groups (NHGs) comprising of 10-20 women, Area Development Societies (ADS) within wards of LSGs and Community Development Societies (CDS) – Registered Society as the Federation of ADS within the LSGIs form the three tiers.
Poverty reduction is targetted through various initiatives, some of which are:
Linkage Banking
1.31 Neighbour Hood Group (NHG) – Bank linkage scheme is a Flagship Programmes of Kudumba shree Mission. National Bank for Agricultural and Rural Development (NABARD) Bank linkage grading procedures are applied while selecting eligible NHGs for availing loan. Banks will provide loans to those NHGs who acquire 80 per cent marks in grading. The cumulative amount that has been lent to NHGs through linkage banking is र1380 crore as on 30thSeptember 2012. The number of NHGs availed bank linkage was 97993. The details of Linkge Banking is given in Appendix 1.22
Micro Enterprises
1.32 Rural Micro Enterprises helps women to set up individual and group enterprises. Through Yuvasree unemployed youth are helped to start enterprises. A Revolving Fund for meeting urgent requirements of working capital to available. During 2011-12, 72 individual enterprises and 739 group enterprises were started as a whole in the state.
Ashraya
1.33 This project rehabilitates destitute families and integrate them with mainstream of the civil society. The specific objectives include provision of food for starving, shelter to the homeless, infrastructure to support for the destitute through medical and care service, educational and pension support and income generation activities. The cumulative number of destitute families assisted under the programme till September 2012 was 78417 spread over 1005 LSGIs.
SECTION 4
Urbanization in Kerala
1.34 The urban sector in Kerala comprises of 5 Municipal Corporations and 60 Municipalities. As per the 2011 census, 47.7 percent of the population lives in urban areas. This is higher than the National average of 31.2 percent. However, unlike the other parts of the country urbanization in Kerala is not limited to designated cities and towns. Barring a few Panchayats in the hilly tracts and a few isolated areas, the entire State is an urban rural continuum. The Kerala society by and large can be termed as urbanized. Details of urban and rural population in Kerala are given in Appendix 1.23.
1.35 Ottappalam (UA), Chalakkudy (UA), Kothamangalam (UA), Changanassery (UA) and Kayamkulam (UA) are the five new Urban Agglomerations for 2011 census. The Urban Agglomeration of Vadakara (UA), 2001 census has being merged with Kozhikode (UA) for 2011 census. Similary Kodungalloor (UA) Guruvayoor (UA) are merged with Thrissur (UA) for 2011 census.
1.36 Among the districts, the percentage of Urbanization has varied from nearly 4 per cent in Wayanad to 68% in Ernakulam. Thrissur and Kozhikode districts follow Ernakulam with Urban content of around 67% each. In six districts viz, Ernakulam, Kozhikode, Thrissur, Kannur, Alappuzha and Thiruvananthapuram the percentage of urban population is higher than the state average. In the Districts of Waynad and Iddukki the Urban population is less than 10%
SECTION 5
Prices
1.37 Kerala is a high consumption economy, which is dependent on cross border trade for consumption of several food articles and manufactured goods. Inflation in Kerala is due to both cost-push factors
(high land, labour and interest cost) and demand pull (high consumption levels). Hence price
fluctuation can be due to a variety of reasons including changes in production cost due to higher input costs and transport cost.
Consumer Price Index
1.38 Consumer Price Index for the agricultural and industrial workers in Kerala went up by 13 points (base 1998-99 = 100) in 2012 compared to the corresponding period of 2011. The percentage increase in consumer price inflation was 8.7 in August 2010, which increased by 9.7 in August 2011 and further increased by 6.6 in August 2012. Hence during the period August 2010 to August 2011 there was a reduction in the rate of increase in inflation. The inflationary hike is shown in (Fig. 1.6).
Fig. 1.6
Consumer Price Index (CPI)of Agricultural and Industrial workers in Kerala
(Base 1998-99 = 100).
1.39 Centre wise analysis of indexes of the 17 centres during 2012 shows that Pathanamthitta recorded the highest price index (220) while Thrissur had the lowest (194) (Appendix 1.24). Looking at the year on year inflation growth, the state average was 6.5 per cent and six centres namely Thiruvananthapuram, Punalur, Kottayam, Eranakulam, Chalakudy and Thrissur experienced a price increase that was lower than the state average (Table 1.8). The trends in CPI over the 11th Plan period indicate that Mundakayam had maximum inflationary pressure, while Thrissur had the least.
Table 1.8
Annual Average Consumer Price Index of Agricultural and Industrial Workers of Selected Centres in Kerala 2008 & 2012.
| Centres | 2008 | 2012 | per cent increase in 2012 over 2008 |
| Thiruvananthapuram | 159 | 212 | 33.33 |
| Kollam | 158 | 215 | 36.07 |
| Punalur | 152 | 211 | 38.8 |
| Pathanamthitta | 159 | 220 | 38.36 |
| Alappuzha | 151 | 212 | 40.39 |
| Kottayam | 151 | 209 | 38.41 |
| Mundakayam | 150 | 217 | 44.6 |
| Munnar | 144 | 202 | 40.27 |
| Eranakulam | 150 | 202 | 34.66 |
| Chalakudy | 152 | 203 | 33.55 |
| Thrissur | 148 | 194 | 31.08 |
| Palakkad | 155 | 212 | 36.77 |
| Malapuram | 153 | 204 | 33.33 |
| Kozhikode | 148 | 202 | 36.48 |
| Meppady | 148 | 197 | 33.10 |
| Kannur | 146 | 204 | 39.72 |
| Kasargod | 148 | 204 | 37.85 |
| State Average | 151 | 207.058 | 37.12 |
Source: Directorate of Economics and Statistics
1.40 The average retail prices of almost all essential commodities, rose considerably during January - October 2012, while the prices of coconut & coconut oil and spices declined, indicating that stringent measures are required for stabilising the prices of essential commodities (Appendix 1.25). Vegetable Prices also showed an upward spiral.
Wholesale Price Index
1.41 Wholesale price index of agricultural commodities declined by 492 points in Kerala 2012 (upto March) compared to the corresponding period of 2011. The weighted contribution of important agricultural commodities to WPI inflation has declined by 8.8 per cent in 2012, compared to the corresponding period in 2011 (Appendix 1.26). The reason for this decline was that the price hike in most commodities during 2011 was very high compared to 2010. Hence this decline is mainly due to the high base effect.
1.42 Among food crops, price rise is seen for condiments and spices (28 per cent) and molasses (16 per cent). The price of non food crops remained relatively lower (18,.4 percent) compared to food crops, but was still high. Efforts are required to be made for ensuring moderation in food inflation by promoting domestic cultivation of food crops, especially vegetables and increasing production of milk and eggs. In this context it is important to introduce new ways of improving medium term
supply responses in agriculture and making structural improvements in supply chains and
infrastructure. The month wise wholesale price index of agricultural commodities in Kerala is given in Appendix 1.27.
Price Parity
1.43 Price fluctuations has been disadvantageous to farmers over the years. Prices paid by farmers constantly increased ever since 2003, (Appendix 1.28) whereas the prices received for their produce fell well below what they paid, thus affecting farm viability. Hence market interventions are needed to protect the interest of cultivators.
Factor Prices
1.44 Land is a scarce commodity in Kerala due to its dense population and urban continuum. Land Prices in Kerala are high. As far as wages are concerned, the wages of both skilled and unskilled workers in Kerala almost doubled over the past five years. The average daily wage rate of skilled workers increased by nearly 94 per cent for carpenters and 95 per cent for masons (Appendix.1.29(a)). Similiarly while there is a hike in the average daily wage rates of unskilled workers in the Agricultural sector over the years, it may be noted from Appendix 1.29(b) that some gender disparity exists in payment of wages to paddy field workers in Kerala. While the average wage rate of a male worker was र 373, it was only र 273 for a female worker during 2012. The per day wage increased by 90 per cent for male workers and by 99 per cent for female workers in 2012 compared to 2008 but the wage disparity continues.
1.45 A well planned strategy to reduce supply constraints both in the factor market and the product market and sustained improvements in infrastructure and logistics are required to ensure price stabilization in Kerala.
SECTION 6
State Finances
1.46 There is an increasing awareness globally that Government has a critical role to play in shaping the economy by providing adequate public goods and services, where market failure is likely. In Kerala, Public Expenditure in social development has earned major social dividends over the years. Further, Public expenditure in infrastructure, institutions and state public sector enterprises, has “crowded in” private investment in all sectors of the economy. While accepting the critical role of Public Investment and Public Expenditure, there is a need for increasing sources of tax and non tax revenue and curtailing unproductive expenditure so that the State does not have to rely on huge borrowings, which will have to be paid back by future generations. Various institutional reforms introduced by Kerala include enactment of the Fiscal Reform Legislation in August 2003, the implementation of VAT in April 2005, imposition of a ceiling on guarantees and setting up of a Consolidated Sinking Fund to repay debt. Such reform measures encourage better control of State Finances.
1.47 The Fiscal Responsibility Act is as an effective tool to enhance the quality of deficit in State’s finances. As per the Kerala Fiscal Responsibility (Amendment Act) 2011, the State Government has committed to achieve a Revenue Deficit target of 1.4 percent of GSDP, a Fiscal Deficit target of 3.5 percent and to restrict State’s total debt liability to 32.3 percent of GSDP in 2011-12. The targets set by the Budget 2012-13 indicate that considerable fiscal consolidation has taken place in Kerala but there are still some challenges. Table 1.9 give a comparitive picture of critical fiscal indicators of neighboring states as well as the all states Average position. Important financial indicators for Government of Kerala for the period from 2002-03 to 2012-13 BE are given in Appendix 1.30.
Table 1.9
State-wise Per Capita Income at constant (2004-05) Prices
Sl. No |
Items |
Kerala |
Karnataka |
Tamil Nadu |
Andhra Pradesh |
All States |
1 |
RR/GSDP |
12.3 |
15.6 |
14.6 |
15.1 |
13.1 |
2 |
OTR/GSDP |
8.2 |
10.0 |
10.3 |
8.5 |
6.3 |
3 |
ONTR/GSDP |
0.9 |
0.6 |
0.9 |
1.8 |
1.2 |
4 |
RE/GSDP |
13.2 |
15.5 |
14.2 |
14.5 |
12.7 |
5 |
DRE/GSDP |
6.8 |
9.8 |
8.2 |
10.1 |
7.8 |
6 |
NDRE/GSDP |
5.3 |
4.6 |
4.7 |
4.4 |
4.5 |
7 |
IP/GSDP |
1.8 |
1.4 |
1.5 |
1.6 |
1.5 |
8 |
PN/GSDP |
2.1 |
1.3 |
2.0 |
1.5 |
1.7 |
9 |
RD/GSDP |
0.9 |
-0.2 |
-0.3 |
-0.6 |
-0.4 |
10 |
FD/GSDP |
2.7 |
2.9 |
2.9 |
2.6 |
2.1 |
11 |
Debt/GSDP |
27 |
22.3 |
21.7 |
22.4 |
21.9 |
Source: RBI State Finances A Study of Budgets 2012-13
RR = Revenue Receipt
OTR = Own Tax Revenue
ONTR = Own Non Tax Revenue
RE = Revenue Expenditure
DRE = Development Revenue Expenditure
NDRE = Non Development Revenue Expenditure
IP = Interest Payments
PN = Pension Payments
RD = Revenue Deficit
FD = Fiscal Deficit
GSDP = Gross Domestic State Product
1.48 The three pillars of State Finances are (1) Revenue (2) Expenditure and (3) Debt.
2. Revenue Receipts
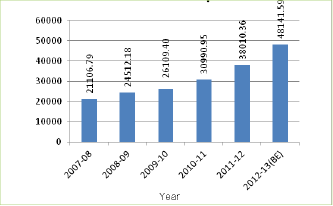
1.49 Revenue receipts consist of State’s own tax and non-tax revenues, Central tax transfers and grants-in-aid from Centre. State’s Revenue Receipts grew by nearly 23 percent in 2011-12 compared to the previous year. In 2011-12 State’s Revenue Receipts reached the level of र 38010 crore, of which the contribution on of State’s own tax was र 25719 crore (67 percent), and the non tax revenue was र2592 crore (7 percent). The share of Central taxes was र 5990 crore (16percent) and Central grants accounted for र 3709 crore (10percent). Actual Revenue Receipts in 2011-12 constituted more than 96 percent of the budget target. The growth of Revenue Receipts dropped sharply to 6.5 percent in 2009-10 from the much higher growth rate of around 16 percent in 2007-08 and 2009-10, due to the adverse impact of economic slowdown, which reduced taxable income. The ratio of revenue receipts to GSDP declined from 12 percent in 2008-09 to 11.2 percent in 2010-11 but registered a slight improvement to 11.6 percent in 2011-12. The buoyancy of revenue receipts came down from 1.5 in 2006-07 to 0.5 in 2009-10. Since then it improved to almost 1 in 2010-11 and further to 1.3 in 2011-12. Revenue buoyancy (rate of growth of revenue receipts / rate of growth of GSDP) should be at least one or more than one since an increase in GSDP increases the ability of the Government to raise revenue. However the state has control only on Own Tax and Non tax Revenue. Other Central transfers are based on certain formulae either recommended by the Finance Commission or Planning Commission or in the case of grants, are based on fulfilling conditionalities imposed by the Central Government. The trend in Revenue Receipts from 2007-08 to 2012-13 BE is given in Fig. 1.7. The details of Revenue Receipt from 2002-03 to 2012-13 BE is given in Appendix 1.31.
Fig 1.7
Revenue Receipts
1.50 Compared to neighboring states as well as all states average, Kerala had lower revenue receipts targeted in BE 2012-13 compared to GSDP (Table 1) There is potential to increase the tax rate or tax base or both.
(i) State’s Own Tax Revenue
1.51 The main sources of State’s Own Tax Revenue (SOTR) are Sales Tax including Value Added Tax (VAT), Stamps and Registration fees, State Excise Duties, Motor Vehicle Tax and Land Revenue tax. The trend in the growth rate of State’ Own Tax Revenue has been fluctuating since 2006-07. State’s Own Tax Revenue recorded a growth of more than 18 percent in 2011-12 ie; from र 21722 crore in 2010-11 to र 25719 crore in 2011-12. The rate of growth of SOTR in 2011-12 over the previous year (2010-11) was above 18 percent. Against the budget estimate of र 26641 crore, the actual realization of tax revenue during 2011-12 was र 25719 crore which is above 96 percent of the targeted revenue. The State taxes - GSDP ratio was showing upward trend during 2006-07 (7.8 percent) and 2008-09 (7.9 percent). However, it dropped to below 8 percent in 2009-10 and improved in subsequent years to reach to nearly 8 percent in 2011-12. Sales Tax and VAT contributed 74 percent of the total SOTR in 2011-12, followed by Stamps and Registration fees (12 percent), State Excise duties (7 percent), Taxes on Vehicles (6 percent), Land revenue (0.2 percent) and others (0.8 percent). The details of State’s Own Tax Revenue from 2002-03 to 2012-13 (BE) is given in Appendix 1.32.
1.52 Compared to other southern states, Kerala’s BE target of Own Tax Revenue in 2012-13, as a percent of GSDP was lower, but it was higher than the all states average (Table 1.9). Karnataka and Tamil Nadu targeted a much higher percent of their GSDP as Own Taxes in BE 2012-13; Andhra Pradesh was just a little more with OTR being 8.5 per cent of GSDP compared to Kerala’s 8.2 per cent.
(ii) State’s Own Non-Tax Revenue
1.53 The major contributors of State’s Non-Tax Revenue are State Lotteries, Forest Revenues and receipts under various social developmental services. There was commendable growth in the State’s Own Non Tax Revenue (SONTR) during 2011-12 (34.3 percent). This could be owing to the reforms initiated by the administration of State Lotteries, which increased revenue receipts. The total SONTR of the State increased to र 2592 crore in 2011-12 from र1931crore in 2010-11 showing a growth of more than 34 percent. Gross receipts from lotteries rose sharply to र 1283 crore in 2011-12 from
र 571 crore in 2010-11, registering an increase of nearly 125 percent. Receipts from State Lotteries constituted nearly 50 percent of the total SONTR of र 2592 crore. This was followed by र 415.9 crore from Social Developmental Services, र 220.5 crore from Forest and र136.5 crore from debt services.
1.54 The ratio of State’s non-tax revenue to GSDP hovered between 0.6 percent and 0.7 percent during 2006-07 to 2010-11 and it improved to 0.8 percent in 2011-12. The non-tax revenue buoyancy for 2011-12 also improved significantly to 1.9 from 0.2 in 2010-11.The actual receipt of र 2592 crore of State Non Tax Revenue exceeded the estimated target of र 2531crore by 2.4 percent in 2011-12. This trend of increased growth in Non Tax Revenue is visible in 2012-13 also, as almost 70 percent of the targeted collection could be achieved in the first three quarters itself. The details of State’s Own Non Tax Revenue from 2002-03 to 2012-13 (BE) is given in Appendix 1.33.Component wise realization of own Non Tax Revenue of Kerala and all States from 2009-10 to 2011-12 (BE) is given in Appendix 1.34
1.55 A comparative position of non-tax revenue with the neighboring States during 2011-12 (B.E) is given in Appendix 1.35. It reveals that the non-tax revenue realized by Andhra Pradesh, Karnataka and Tamil Nadu are 12.7 percent, 5.7 percent and 5.9 percent respectively to their total revenue expenditure whereas for Kerala it is 5.6 percent. Similarly the ratios of non tax revenue to the revenue receipts for Andhra Pradesh, Karnataka and Tamil Nadu are 12.2 percent, 5.5 percent and 5.9 percent respectively and for Kerala it is 6.4 percent. In BE 2012-13, Kerala had a lower target of Own Non Tax Revenue as a percent of GSDP compared to All States average, and to Andhra Pradesh. It was however on par with Tamil Nadu and higher than Karnataka (Table 1.9).
13th Finance Commission Award:
1.56 13th Finance Commission has recommended, among other things, grants aggregating to
र 6371.5 crore for the State for the award period 2010-15. The State Level Empowered Committee (SLEC) and High Level Monitoring Committee (HLMC), constituted as per the stipulations in the guidelines issued by Government of India (GoI), have already approved the Perspective Action Plans for 2010-15 and Annual Action Plans for the years 2010-11 and 2011-12 in most of the cases enabling the implementing Departments to take up and complete the projects within the stipulated time frame. There is reduction in the share of taxes awarded by the 13the Finance Commission when compared to the previous Finance Commission’s award. For instance, the 13th Finance Commission awarded 2.3 percent to Kerala as share of taxes from the divisible pool whereas it was 2.7 percent and 3.1 percent respectively in the 12th and 11th Finance Commissions. Similarly, there has been consistent decline in the share of total transfers to Kerala, which includes share of taxes and grants, from 2.8 percent, 2.6 percent and 2.4 percent respectively by the 11th, 12th and 13th Finance Commissions awards. The scheme wise details of 13th Finance Commission award to the State are given in Appendix 1.36.
(iii) Central Transfers
1.57 Central Transfers comprises of share in central taxes and grants in aid from Centre. The share of States in net proceeds of shareable central taxes during the 13th FC period from 2010-11 to 2014-15 is 32 per cent. Out of this, Kerala’s share is 2.3 per cent. The growth of Central Transfers has not been in favor of Kerala in recent years. The growth rate of Central Transfers in 2007-08 and 2008-09 was 17.4 percent and 11.8 percent respectively, while in 2009-10 it was negative (- 4.8 per cent). However it registered an upward growth of 10.7 percent in 2010-11. The annual growth of 32.2 percent in 2011-12 was remarkable, compared to the poor growth trends in past years. The share of Central transfers in total revenue receipts, which has been declining persistently, since 2007-08 improved to 25.5 percent in 2011-12 from 23.7 per cent in 2010-11. Central transfers as percent of GSDP have also been consistently declining since 2007-08. It decreased from 3.6 percentage in 2007-08 to 2.7 percent in 2010-11. In 2011-12, it improved slightly to 3 percent. Against the estimated target of
र 10255 crore, the actual central transfer received in 2011-12 was र 9700 crore (94.6 percent). Out of this, the receipts from share in central taxes and central grants from the Centre were र 5990 crore and
र 3709 crore respectively. In the fiscal year 2012-13, central transfers to the tune of र 6543 crore being 52 percent of the targeted receipts, has been received by the State till the end of December 2012.The details of Central Transfers from 2007-08 to 2012-13 are given in Table 1.10
Table 1.10
Central Transfers: 2007-08 to 2012-13 (BE)
(र in Crore)
Year |
Share in Central Taxes & Duties |
Annual Growth Rate |
Grant-in-aid and other receipts from Centre for plan and non-plan |
Annual Growth Rate |
Total transfers |
Annual Growth Rate |
2007-08 |
4051.70 |
26.14 |
2176.59 |
3.88 |
6228.29 |
17.35 |
2008-09 |
4275.52 |
5.52 |
2687.19 |
23.46 |
6962.71 |
11.79 |
2009-10 |
4398.78 |
2.88 |
2233.38 |
-16.89 |
6632.16 |
-4.75 |
2010-11 |
5141.85 |
16.89 |
2196.62 |
-1.65 |
7338.47 |
10.65 |
2011-12 |
5990.36 |
16.50 |
3709.22 |
68.86 |
9699.58 |
32.17 |
2012-13 (BE) |
7103.46 |
18.58 |
5420.51 |
46.14 |
12523.97 |
29.12 |
1.58 Regarding Central Transfers to States, Kerala’s position is the lowest (2.1 percent). Andhra Pradesh is at the top position getting 6.7 percent of the total transfers followed by Tamil Nadu (4.4 per cent) and Karnataka (3.9 percent). Central transfers in Kerala and neighboring states during 2011-12 (B E) are given in Appendix 1.37 While Central transfers are formula based and cannot be increased by the State, more effective tapping of available grants by fulfilling conditionalities attached would help increase grants to the State.
Revenue Expenditure
1.59 The performance of the State on the Revenue expenditure front is in accordance with the expenditure projected in the annual budget, which is invariably of a recurring nature. The major items of expenditure under Revenue Account are Pension, Interest payments and Salaries and devolutions to the Local Bodies. It includes the charges on account of the working expenses and maintenance of completed assets. Grants in aid given to local bodies are presently classified under State’s revenue account. A major portion of this fund is used for the creation of capital assets. Though this fund adds to the capital assets of the respective local body, the expenditure met by the State Government on this account is classified under State’s revenue expenditure. Similarly, significant sums provided to other institutions such as universities, autonomous bodies, etc. for asset creation are also classified under State’s Revenue Expenditure. This unnecessarily inflates the figure for revenue expenditure and revenue deficit. In this context Government of India has introduced a new fiscal indicator, viz. “Effective Revenue Deficit” in the Central Budget in 2011-12, which is defined as the Revenue Deficit net of the Revenue Expenditure by way of grants for creation of capital assets. Subsequently, the State Government has also introduced this concept in the budget from 2012-13. The effective Revenue Deficit for 2011-12 is 1.6 percent of GSDP and in real terms it is र 5306 crore. Out of the Revenue Deficit of र 3464 crore in 2012-13, the Effective Revenue Deficit of the State is projected to be र 190 crore and it is 0.05 percent of GSDP.
1.60 The combined expenditure of Social and Economic Services under Revenue Account constitutes the Developmental Expenditure. The expenditure on expansion and development funds and maintenance given to LSGD is also considered as developmental expenditure. Expenditure on interest charges, Pension charges, Administrative Services, Police, etc. are the main components under non- developmental revenue expenditure. In 2011-12, revenue expenditure increased to
र 46045 crore (32.8 percent from र 34665 crore in 2010-11. The hike in both plan and non-plan revenue expenditure during 2011-12 was very large compared to the prevailing trend. The plan revenue expenditure increased to र 5327 crore in 2011-12 (27 percent from र 4195 crore in 2010-11. The non-plan revenue expenditure increased to र 40717 crore in 2011-12 (33.6 percent) from र 30469 crore in 2010-11. The actual revenue expenditure of र 46045 crore in 2011-12 exceeded the budget estimates of
र 44961crore by 2.4 percent. The ratio of revenue expenditure relative to GSDP declined persistently from 14.2 percent in 2007 to 12.5 percent 2010-11. But the trend reversed and it increased to 14.1 percent in 2011-12, mainly due to the expenditure on salary and pension, which increased substantially in 2011-12 due to revisions announced. Similarly, arrear liability on pay and pension revisions relating to 2009-10 and 2010-11 were also absorbed during 2010-11. As a result, the percentage of increase in salary and pension expenditure in 2011-12 over 2010-11 was 45.3 and 50.8 respectively.
1.61The share of Developmental Expenditure in Total Revenue Expenditure improved marginally to 55.3 percent in 2011-12 from 54.6 percent in 2010-11. Developmental Expenditure estimated in BE 2012-13 contributes 59 percent of the Total Revenue Expenditure. The trend in Revenue Expenditure from 2007-08 to 2012-13 BE is given in Fig.1.8
Fig. 1.8
Revenue Expenditure
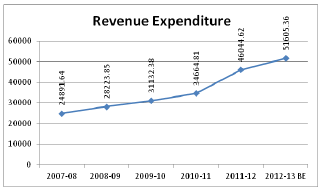
1.62 The combined expenditure on interest, pension and salaries contributed 67.4 per cent of the total revenue expenditure in 2011-12, compared to 62.4 per cent of the total revenue expenditure in 2011-12. Out of the total projected estimates of र51605 crore in 2012-13 (BE) on interest, pension and salaries, the combined expenditure of र32178 crore accounts for 62.4 percent. On the other hand, the expenditure on committed liabilities constitutes 78 percent of revenue expenditure and consumed 95 percent of revenue receipts of the state during 2011-12. Committed expenditure mainly consists of interest, pension, salaries, subsidies and devolutions to LSGIs, for which payments are obligatory.
1.63 There has been sharp increase in payment of subsidies for the last five years. It increased from र 202 crore in 2007-08 to र 1014 crore in 2011-12 (400%) increase. In 2011-12 the payment of subsidies increased by 62 percent over the previous year. The main reason for this huge increase is the increase in payments to Food Corporation of India towards reimbursement of price difference of ration rice and wheat (र 650 crore) and on account of Special Support Scheme for farm sector (र108 crore). The details of Revenue Expenditure (item wise) from 2002-03 to 2012-13 BE is given in Appendix 1.38 and expenditure on interest, pension and salary from 2002-03 to 2012-13 BE is given in Appendix 1.39.
1.64 Compared to other southern states and All states average (in BE 2012-13), (Table 1) Kerala had a lower RE /GSDP than Karnataka, Tamil Nadu and Andhra Pradesh but had a higher RE/GSDP ratio than the all states average. Kerala had lower developmental revenue expenditure than all the southern states and was even lower than the all states average. This is because non developmental revenue expenditure especially interest payments and pension payments in Kerala are much higher as a percent of GSDP than other Southern States or the all States average. Committed expenditure reduces the amount available with the Government for productive and developmental purposes.
Capital Expenditure
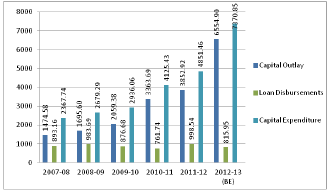
1.65 The share of capital outlay in total expenditure has been marginal in past years despite consistent efforts to provide adequate funds for creation of capital assets. The capital outlay increased from र1475 crore in 2007-08 to र 2060 crore (39.7 percent) in 2009-10 and र 3364 crore (63.3 percent) in 2010-11. It increased to र 3853 crore in 2011-12 (14.5 percent) and further to र 6555 crore (70 percent) in 2012-13(BE). The ratio of capital outlay to GSDP that stood below 1 per cent in some of the preceding years advanced to 1.2 per cent in 2010-11. This trend continued in 2011-12 also with a ratio of capital expenditure to GSDP prevailing around 1.2 percent. The ratio of capital outlay to GSDP as per the budget estimate for 2012-13 is almost 1.7 percent. The actual expenditure of र 3853 crore on capital outlay in 2011-12 exceeded the budget estimates of र 3835 crore by र 18.2 crore. As in the previous years, Public Works continued to absorb a major segment of capital outlay. During 2011-12 the allocation to Public works constituted above 47 percent (र1820 crore) of total capital outlay. Sector- wise allocation of capital outlay in 2011-12 to sectors like irrigation, agriculture and allied activities and industries was in the order of र 247 crore (6.4 percent), र311crore (8 percent) and र 314.5crore (8.2 percent ) respectively. As regards loan disbursements, the trend shows consistent decline for the last five years. It declined from र 984 crore in 2008-09 to र 762 crore in 2010-11. However, this trend changed in 2011-12 consequent to the increase in the disbursement of loan, which rose to र 999 crore in 2011-12, with an increase of र 237 crore over 2010-11. The trend in Capital Outlay, Loan Disbursement and Capital Expenditure from 2007-08 to 2012-13 BE is given in Fig 1.9. The trend in Capital Outlay (sector wise) from 2002-03 to 2012-13 BE is given in Appendix 1.40
Fig 1.9
Capital Expenditure
(र Crores)
1.66 In the expenditure basket, development expenditure, which includes social sector expenditure is considered to be good quality expenditure as it builds social assets and improves the Human Development Index. Similarly capital outlay is considered to be high quality expenditure as it builds physical assets. Table 1.11 indicates that as a percent of GSDP, in BE 20123-13 Kerala had a lower quality of expenditure than the Southern States, as well as the All States average.
Table 1.11
Development of Expenditure - Comparison of Select States 2012-13 BE
Sl.No |
Item |
Kerala |
Karnataka |
TN |
AP |
All States |
1 |
Development Expenditure/GSDP |
8.7 |
12.9 |
12.6 |
13.2 |
10.2 |
2 |
Social Sector Expenditure/GSDP |
5.5 |
7.4 |
8.3 |
7.6 |
6.4 |
3 |
Capital Outlay/GSDP |
1.7 |
2.8 |
2.4 |
2.6 |
2.3 |
Source: RBI State Finances A Study of Budgets 2012-13.
Note: Social Sector Expenditure consists of social services, along with warehousing and food storage and rural development heads under economic services. Development expenditure includes social sector expenditure, economic sector expenditure and devolution to local bodies.
Debt Profile
1.67 The gap between revenue receipts and total expenditure of the state is bridged through borrowings, which constitutes the stock of debt for the state. Debt of the State includes borrowing on account of internal debt, loans and advances from GOI and liabilities in respect of Small Savings PF. Debt reached र 89418 crore at the end of the financial year 2011-12. The annual growth rate of debt increased by 13.7 per cent in 2011-12 against 10.9 per cent in 2010-11.The debt of the State from 2007-08 to 2012-13 BE is given in Table 1.12
Table 1.12
Debt of the State
(र in Crore)
Year |
Internal Debt |
Small Savings, Provident Fund, Others |
Loans and advances from Central Government |
Total |
| 2007-08 | 34019.00 (61%) | 15858.00 (29%) | 5533.00 (10%) | 55410.00 (100) |
| 2008-09 | 38814.00 (61%) | 18447.00 (29%) | 6009.00 (10%) | 63270.00 (100) |
| 2009-10 | 43368.00 (61%) | 21296.00 (30%) | 6305.00 (9%) | 70969.00 (100) |
| 2010-11 | 48528.10 (62%) | 23786.06 (30%) | 6359.08 (8%) | 78673.24 (100) |
| 2011-12 | 55397.39 (62%) | 27625.10 (31%) | 6395.69 (7%) | 89418.18 (100) |
| 2012-13 (BE) | 66626.49 (66%) | 27413.78 (27%) | 7138.90 (7%) | 101179.17 (100) |
( ) indicates percentage share
1.68 Table 1.12 indicates that in recent years there is a higher proportion of internal debt in the total debt basket.
1.69 The consistent decline of the ratio of debt to GSDP continued in 2011-12 also. It came down to 27.4 per cent in 2011-12. It is estimated to come down further to 25.9 per cent in 2012-13 (BE). The ratio of debt outstanding to revenue receipts has been falling consistently and dropped to 235 percent in 2011-12 and it is projected to come down further in 2012-13. Public debt constituted around 69 percent of total debt outstanding in 2011-12. Liabilities under public debt increased to
र 61793 crore in 2011-12 from र 54887 crore in 2010-11 with showing a growth of 12.6 percent. The increase in the liabilities under small savings, PF, etc. in 2011-12 over 2010-11 was 16 percent. From र 23786 crore in 2010-11, the liabilities under small savings, PF, etc. increased to र 27625 crore in 2011-12. The repayment of past debt together with its interest charges always consumes a major portion of the debt receipts. Out of the total debt of र 32781 crore availed in 2011-12, र 22036 crore was expended for the repayment of debt while र 6294 crore was used for payment of interest on outstanding liabilities. The repayment of past debt together with interest charges, amounting to र 28330 crore, constituted 86.4 percent of the total debt receipt of र 32781 crore in 2011-12. This means that only a small fraction of funds borrowed in 2011-12 was available after servicing past debt obligations. The Debt profile of the State from 2002-03 to 2012-13 BE is given in Appendix 1.41.
1.70 The per capita debt of Kerala which was र15700 in 2007 increased to र19900 in 2009 and र 24600 in 2011(BE). A comparison of debt / GSDP ratio as well as per capita debt liability of Kerala with neighboring states is shown in Appendix 1.42.
1.71 A look at the BE target of debt – GSDP ratio indicates that Kerala has a much higher debt – GSDP ratio than southern states and the all States average.
1.72 RBI has created a matrix (Box 1.1) to show the debt stress of various states in the pre consolidation period (period before Debt Swap Scheme and Debt Consolidation and Relief Facility Scheme of Central Government) and the post consolidation period (after Central loans were consolidated). It may be noted that in both the periods, Kerala is placed under high vulnerability because of its high debt to GSDP ratio as well as its high ratio of interest payments to revenue receipts.
Box 1.1
States Vulnerability Matrix
Debt/GSDP
IP/RR |
Debt GSDP Ratios | |||
High (30-50%) |
Medium (20-30%) |
|||
| Ratio of Interest payments to Revenue Receipts | Very High (Above 25%) | Pre-consolidation | Odisha Punjab Uttar Pradesh West Bengal |
|
| Post consolidation | West Bengal | |||
| High (15-25%) | Pre-consolidation | Bihar Kerala Rajasthan
|
Andhra Pradesh Chhattisgarh Gujarat Haryana Madhya Pradesh Maharashtra |
|
| Post consolidation | Bihar Goa Kerala Odisha Punjab Rajasthan Uttar Pradesh |
Andhra Pradesh Gujarat Haryana Maharashtra
|
||
| Medium (10-15%) | Pre-consolidation | Goa | Jharkhand Karnataka Tamil Nadu |
|
| Post consolidation | Madhya Pradesh | Jharkhand Karnataka Tamil Nadu |
||
| Low (10%) | Pre-consolidation | |||
| Chhattisgarh | ||||
Source: RBI State Finances A study of Budgets 2012-13.
Note: Pre-debt consolidation refers to the period 1992-93 to 2001-02 and post debt consolidation
period refers to the period 2002-03 to 2011-12
1.73 At the end of March 2013, according to RBI Kerala will have 27 per cent of its GSDP as outstanding liabilities compared to the All States average of 22 per cent, and around 22 per cent in the case of other Southern States (Table VI.3 RBI State Finances, A study of Budgets of 2012-13).
Table 1.13
Ratio of Debt and Consolidated Debt as percentage of Revenue Receipts
(for various years)
Period/Item |
Consolidated Debt/ Revenue receipts |
2007-08 |
262.52 |
2008-09 |
258.11 |
2009-10 |
271.8 |
2010-11 |
243.77 |
2011-12 |
230.59 |
Source: RBI State Finances A study of Budgets 2012-13
1.74 While consolidated debt/revenue receipts is coming down steadily, the interest payment to revenue receipts ratio is still on the higher side (See Tables 1.13 and 1.14).
Table 1.14
Interest payment as percentage of Total
Revenue Receipts
Year/tem |
Interest Payment /TRR |
2007-08 |
20.51 |
2008-09 |
19.01 |
2009-10 |
20.27 |
2010-11(RE) |
17.18 |
2011-12 (BE) |
16.23 |
Source: Budget in Brief (various years)
1.75 Debt management of the Government also has to be improved to deliver a debt package at the lowest feasible cost. Costly sources of debt like NSSF funds (which seems to be still the second largest source of internal debt) or those from NCDC have to be kept at the minimum feasible level, relying as much as possible on cheaper debt such as market borrowings. Kerala also has its own indigenous public instrument of Treasury Deposits, which appears to be a cheap source of funds, helping to keep the cost of debt lower than what it would be otherwise (Working Paper : 449,CDS,Tvpm,2012).
Contingent Liabilities
1.76 The outstanding guarantees of the State Government from 2007-08 to 2011-12 are shown in Table 1.15. Contingent liabilities can also become the debt obligations of the state in the event of default by borrowing public sector units for which Government is a guarantor. The Outstanding Guarantees during 2011-12 is र 11332 crore.
Table 1.15
Outstanding Guarantees
(र in Crore)
| Year | Maximum Amount Guaranteed | Amount outstanding | ||
| Principal | Interest | Total | ||
| 2007-08 | 14871.08 | 7575.28 | 742.06 | 8317.34 |
| 2008-09 | 11385.54 | 6912.65 | 690.67 | 7603.32 |
| 2009-10 | 10225.78 | 6889.22 | 605.78 | 7495.00 |
| 2010-11 | 12625.07 | - | - | 7425.79 |
| 2011-12 | 11332.11 | - | - | 8277.44 |
1.77 There is scope to increase revenue for the state by encouraging industries as it is the secondary sector that is more likely to contribute to the exchequer. Similarly judicious use of user fees for use of select or specialized infrastructure facilities may also be required. As more production and services shift from the un-organized to the organized sector, they are likely to come within the tax net. A destination based Goods and Service Tax (GST) in the place of origin-based elements like the central sales tax would be highly advantageous for a net importing state like Kerala and has the potential to raise revenues. Unproductive revenue expenditure should be reduced and capital expenditure, which is likely to yield future revenue streams, should be encouraged. A zero revenue balance, if not a revenue surplus should be targeted so that borrowed funds are used only for asset creation. Prudent debt management will be necessary as Kerala is more vulnerable to indebtedness than many other states in the country.
SECTION 7
Banking
1.78 Availability of adequate and affordable finance is a key determinant for the performance of an economy. Despite being a small state, Kerala has an extensive bank network and accounts for 4.2 per cent of the total Scheduled Commercial Banks operating in the country on par with larger states like Bihar and Punjab (Appendix 1.43). At the end of March 2012, Kerala had 4783 branches and there was an increase of 256 branches compared to March 2011. Kerala has 3.1 percent of the total advances financed by Scheduled Commercial Banks, on par with Haryana and much higher than states like Assam, Punjab, Rajasthan and Bihar (Appendix 1.44) .All leading commercial banks have their presence in Kerala , with State Bank of India and State Bank of Travancore being the most dominant players.
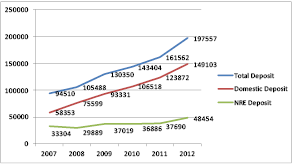
1.79 Increase in deposits depend on the level of income and the propensity to save. In March 2012, deposits in Kerala banks accounted for 3.3 percent of the total deposits in Scheduled Commercial Banks in the country (Appendix 1.45). Total deposits in Kerala grew by 22 percent in 2012 over the previous year, with NRE deposits growing at nearly 29 percent and domestic deposits growing by 20 percent (Appendix 1.46). A unique feature of Kerala is the large proportion of NRE deposits, which was over 34 percent of the total deposits in private sector banks in March 2012 (Appendix 1.47). NRE deposits accounted for around 25 percent of the total bank deposits in Kerala (Appendix 1.46) and Fig. 1.10.
Fig:1.10
Growth of Bank Deposit in Kerala ( र in crore)
1.80 People borrow from banks mainly for asset creation or investment. High rates of interest are a deterrent only if the expectation of financial return is low. In public sector banks, Kerala has a relatively low credit deposit ratio compared to neighbouring states of Tamil Nadu and Andhra Pradesh. It however, has a higher credit deposit ratio than Karnataka and the All India average (Appendix 1.48). However, the credit deposit ratio has increased significantly from just over 69 percent in March 2010 to 80.5 percent in March 2012, showing that credit growth is increasing at a higher rate than deposit growth. However, as long as the ratio is less than one, banks are likely to have idle funds, which need to be productively tapped. Appendix 1.49 indicates that the CD ratio in public sector banks in Kerala is much higher than in private banks.
Housing Loans
1.81 During 2011-12, banks in Kerala including Private Sector Banks sanctioned an amount of र 23191.79 crore to 653165 beneficiaries as housing loan against र 18531.91 crore to 596934 beneficiaries during 2010-11 (SLBC: 2012) showing more than 25 per cent growth in total housing loan sanctioned.
Educational Loans
1.82 All major banks in Kerala now sanction education loan to deserving students as per the direction of the Ministry of Finance, Govt. of India. It is observed that, at the end of March 2012, र 7210.63 crore was sanctioned to 359013 students and the percentage increase of education loan and beneficiaries during March 2011 was nearly 30 and 20 percent respectively over the last year (SLBC:2012)
Advances to Weaker Sections and SC/STs
1.83 During 2011-12, an amount of र 29658.12 crore has been disbursed to 3590688 beneficiaries of weaker sections in the state. Corresponding figures in 2010-11 was र 23186.37 crore to 3841112 beneficiaries indicating nearly 28 per cent of growth in the amount sanctioned. During 2011-12 the advances to SC/STs was र 3672.87 crore to 311892 beneficiaries against र 3654.72 crore to 329107 beneficiaries in the previous year.
Micro finance
1.84 Microfinance provides high quality financial services to the poor, either individual or as part of a group, with the aim of helping them out of poverty. It includes microcredit (also known as microloans), which is the provision of credit in small amounts to those who could previously not afford them due to the high cost of such services. It is a boon for those who do not have access to regular banking services. In Kerala More than 4 lakh Self Help Groups (SHG) maintaining their savings bank accounts with र 625.49 crore in various banks as on March 2012. (SLBC:2012).
District –wise Analysis of Banking Statistics
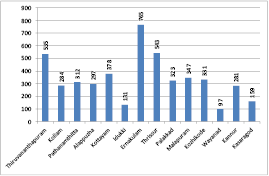
1.85 The District-wise details of banking statistics in Kerala reveals that Ernakulam district with 765 branches holds the largest number followed by Thrissur with 543 branches and Thiruvananthapuram 535 branches. (Fig.1.11). In Ernakulam, Wayanad and Idukki districts, the credit intake exceeded considerably against the deposits (Appendix.1.50). The disbursement of credit against deposit in Pathanamthitta district was very low with the C.D ratio of 30.6 percent.
Fig 1.11
District wise distribution of number of bank branches in Kerala
Financial Inclusion:
1.86 Financial inclusion means the provision of affordable financial services, (viz., access to payments and remittance facilities, savings, loans and insurance services) by the formal financial system to those who tend to be excluded either because they are poor or because they are uneducated or because they live in remote areas or for any such reason. Meaningful Financial Inclusion involves ensuring that per family minimum one operating account is opened and people are persuaded to route their savings through their accounts. This will help them to develop better banking habit. They may provided with small credits if found genuine, and in emergencies. The ultimate aim is to liberate the poor from the clutches of private money lenders and to have a decent banking culture among them so that banks will not be hesitant to extend their services.
BOX 1.2
Meaningful Financial Inclusion for Ernakulum District
Ernakulam district which was the very first district in the country to achieve financial literacy as early as 1990, achieved Meaningful Financial Inclusion in line with national scenario. For achieving this task, the following efforts have been made.
• A baseline survey covering all households was conducted through Kudumbasree.
• Bank branches conducted campaigns in different locations to open the bank
account among the poor.
• Effective publicity was taken to achieve the objectives.
• Steps were taken for linkage of bank accounts with AADHAAR number.
• During the period, out of the three unbanked villages, branches were opened in two villages and Ultra Small Branch in the third one.
• The survey showed that 81% of the families in the District were having bank accounts and 1.28 lakh households without bank accounts. Out of 26.36 lakh adult population 15.78 lakh (60%) were without bank accounts.
• Five Financial Literacy Centres are functioning in the district.
• As Lead Bank, Union Bank of India took initiative in all these activities.
Source: Union Bank of India
1.87 Details on Agricultural finance and Co-operative Credit are avaliable in Chapter 2. Similarly details on industrial credit, Housing Loans and Loans for specific purposes/specific target groups are given in subsequent chapters.
Macro Economic Outlook for Kerala
1.88 Kerala’s fundamental advantages, other than the high quality of the population, are : higher GSDP and per capita income growth compared to national averages, relatively low poverty, excellent banking network and high financial literacy. However, these advantages are not uniform across the state and special attention is being given through various schemes ( targeting development of Idukki, Wayanad, Kuttanad, Palakkad, coastal areas, hill areas, remote areas and so on ) to reduce variations in development indicators across districts/regions so that there is balanced intra-state regional development. At the macro level, Kerala’s challenges are: lack of adequate urban infrastructure (especially transport, energy, housing and waste management) to cater to the growing urban population, high inflationary trends in all factors of production (land, labour and capital), high cost of food and manufactured items (Kerala being a net importing state) and the difficulty faced by the Government to balance revenue and expenditure, without resorting to high levels of borrowing. Keeping unproductive revenue expenditure in check, reducing subsidies by effective targeting of the genuinely needy groups and increasing capital expenditure by better use of all sources available, including Central Assistance and Private Investment will improve the quality of public expenditure. Simultaneously, greater efforts to increase revenue through both tax and non tax revenue sources, considering people in Kerala have a relatively high disposable income, could reduce the dependence on debt, which will have to be paid by future generations. Kerala’s approach to development in the XIIth Plan is based on care and compassion for all groups of people and systems are being put in place to ensure even better standards of living for all.