
Page 300 - economic review
P. 300
272
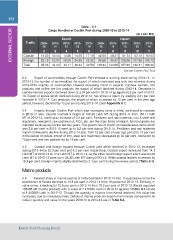
EXTERNAL SECTOR Table – 6.1
Cargo Handled at Cochin Port during 2009-10 to 2013-14
(In Lakh MT)
Export Import
Traffic 2009- 2010- 2011- 2012- 2013- 2009- 2010- 2011- 2012- 2013-
10 11 12 13 14 10 11 12 13 14
1
Coastal 2 3 4 5 6 7 8 9 10 11
Foreign
Total 12.83 12.04 14.86 14.05 17.18 42.65 48.21 51.74 52.12 60.63
23.13 22.00 28.25 24.29 25.32 95.68 96.47 106.06 107.99 105.73
35.96 34.04 43.11 38.34 42.50 138.33 144.68 157.80 160.11 166.36
Source: Cochin Port Trust
6.3 Export of commodities through Cochin Port showed a reviving trend during 2013-14. In
2012-13 the number of commodities the export of which increased was only two whereas during
2013-2014 majority of commodities showed increasing trend in exports. Cashew kernels, coir
products and coffee are the products the export of which declined during 2013-14. Decrease in
cashew kernels exports narrowed down to 3.24 per cent in 2013-14 as against 5.8 per cent of 2012-
13. Export of spices which declined during 2012-13, has shown a return by marking 3.21 per cent
increase in 2013-14. Coir products, the export of which increased by 15 per cent in the year ago
period, however, declined by 12 per cent during 2013-14. (See Appendix 6.1)
6.4 Imports through Cochin Port which was increasing since a while, continued to increase
in 2013-14 also. Imports touched a height of 166.36 Lakh MT during 2013-14 from 160.11 lakh
MT of 2012-13, marking an increase of 3.9 per cent. Fertilizers and raw materials, iron & steel and
machinery, newsprint, raw cashew nut, P.O.L etc. are the main items of import. No food grains are
imported continuously for the last two years. The growth rate of import of miscellaneous items which
was 2.5 per cent in 2012-13 went up to 5.2 per cent during 2013-14. Fertilizers and raw materials
import continued to decline during 2013-14 also, from 18 per cent of year ago period to 13 per cent
in the period of review. Import of iron, steel and machinery decreased by 32 per cent, newsprint by
73 per cent and raw cashew nut by 19 per cent.
6.5 Coastal and foreign exports through Cochin port which declined in 2012-13, increased
during 2013-14 by 22.3 per cent and 4.2 per cent respectively. Coastal export increased from 14.1
Lakh MT of 2012-13 to 17.2 Lakh MT in 2013-14, on the other hand foreign export which was 24.29
Lakh MT in 2012-13 went up to 25.32 Lakh MT during 2013-14. While coastal imports increased by
16.3 per cent, foreign imports slightly declined by 2.1 per cent during the review period. (Table.6.1)
Marine products
6.6 Kerala’s share in marine exports of India declined in 2013-14 also. In quantitative terms the
contribution of Kerala declined to 16.8 per cent in 2013-14 from 18 percent of 2012-13. Similarly, in
value terms, it declined to 15.6 per cent in 2013-14 from 18.2 per cent of 2012-13. Kerala exported
165698 MT marine products with a value of ` 470636 Lakh in 2013-14 against 166399 MT valued
at ` 343585 Lakh in 2012-13. Though the quantity of exports from Kerala declined, the value has
increased, due to increased prices. Details of marine products exports from Kerala compared to all
India in quantity and value for the years 2009-10 to 2013-14 are in Table 6.2.
Kerala State Planning Board