
Page 302 - economic review
P. 302
EXTERNAL SECTOR274
6.11 Import of raw cashew nut through Cochin Port during 2013-14 was 201955 MT, showing a
decline of 19 per cent over 2012-13 quantity of 249755 MT. (Appendix-6.2)
Coffee
6.12 Export of coffee from India during 2013-14 was reported as 298206 MT (provisional) with a
value of ` 4533.9 Crore. There is a decline of 0.36 per cent in quantity and 0.41 percent in value over
the previous year in which export was 299287 MT valued at ` 4552.8 Crore.
6.13 Export from Kerala through Cochin Port during 2013-14 was 75631 MT with a value of ` 872.0
Crore, showing a decline of 6.3 per cent in export during 2013-14 vis-à-vis the quantity of 80674 MT
of 2012-13. In value terms the decline was 3.3 per cent, the export value of 2012-13 being ` 902.2
Crore.
Tea
6.14 The quantity of export of tea through Cochin Port during 2013-2014 was 96681 MT valued at
` 511.7 Crore. This shows an increase of 2.7 per cent in quantity, but a decline of 0.84 per cent in
value, the quantity of export during 2012-13 being 94165 MT and value ` 516.0 Crore.
Coir and Coir Products
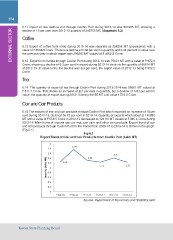
6.15 The exports of coir and coir products through Cochin Port which recorded an increase of 15 per
cent during 2012-13, declined by 12 per cent in 2013-14. Quantity of exports which stood at 140882
MT with a value of ` 556.5 Crore in 2012-13 decreased to 124116 MT valued at ` 385.4 Crore during
2013-14. Main items of exports are coir mat, coir yarn and other coir products. Export trend of coir
and coir products through Cochin Port for the Period from 2009-10 to 2013-14 is shown in the graph.
(Fig.6.1)
Fig 6.1
Export Trend of Coir and Coir Products from Cochin Port (Lakh MT)
Source: Department of Economics and Statistics,GoK
Kerala State Planning Board