
Page 301 - economic review
P. 301
273
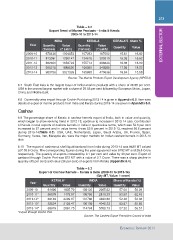
Table – 6.2 EXTERNAL SECTOR
Export Trend of Marine Products – India & Kerala
2009-10 to 2013-14
INDIA KERALA KERALA’S share %
Quantity Value Quantity Value
Year (Tonnes) (` Lakh) (Tonnes) (` Lakh) Quantity Value
2009-10 678436 1004853 107293 167002 15.81 16.62
2010-11 813091 1290147 124615 200210 15.33 15.52
2011-12 862021 1659723 155714 298833 18.06 18.00
2012-13 928215 1885626 166399 343585 17.93 18.22
2013-14 983756 3021326 165698 470636 16.84 15.58
Source: The Marine Products Export Development Agency (MPEDA)
6.7 South East Asia is the largest buyer of Indian marine products with a share of 26.38 per cent.
USA is the second largest market with a share of 25.68 per cent followed by European Union, Japan,
China and Middle East.
6.8 Commodity wise import through Cochin Port during 2013-14 is given in Appendix 6.2. Item wise
details of export of marine products from India and Kerala during 2013-14 are given in Appendix 6.3.
Cashew
6.9 The percentage share of Kerala in cashew kernels export of India, both in value and quantity,
which began to show reviving trend in 2012-13, continue to increase in 2013-14 also. Contribution
of Kerala in total exports of cashew kernels in India in quantitative terms, which was 53.6 per cent
increased to 57 percent and in value terms it was 52.9 percent in 2012-13, reached 56.6 percent
during 2013-14(Table 6.3). USA, UAE, Netherlands, Japan, Saudi Arabia, UK, France, Spain,
Germany, Korea, Iran, Malaysia etc. were the major markets for Indian cashew kernels in 2013-14
also.
6.10 The export of cashewnut shell liquid/cardanol from India during 2013-14 was 9480 MT valued
at ` 38.6 Crore. The corresponding figures during the year ago period was 9192 MT and 29.8 Crore
respectively. The quantity of exports increased by 3.1 per cent and value by 30 per cent. Export of
cardanol through Cochin Port was 872 MT with a value of 2.7 Crore. There was a sharp decline in
quantity (45 per cent) and value (36 per cent) of exports from Kerala (Appendix 6.4).
Table – 6.3
Export of Cashew Kernels – Kerala & India (2009-10 to 2013-14)
(Qty:MT, Value: ` crore)
Year KERALA* INDIA Share of Kerala (%)
Quantity Value Quantity Value Quantity Value
2009-10 61698 1635.79 108120 2905.82 57.06 56.29
2010-11* 56578 1478.67 105755 2819.39 53.50 52.45
2011-12* 69149 2299.67 131760 4390.68 52.48 52.38
2012-13* 53624 2138.47 100105 4046.23 53.57 52.85
2013-14* 65679 2861.75 114791 5058.73 57.22 56.57
*Export through Cochin Port.
Source: The Cashew Export Promotion Council of India
Economic Review 2014