
Page 335 - economic review
P. 335
307
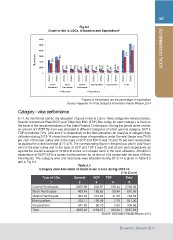
Rs in Crore Fig.8.2 3870.32 LOCAL GOVERNMENTS
Grant-in-Aid to LSGs, Allocation and Expenditure* (71)
6000 5057.59
5000 (77)
4000
3000
2000
1000
0
2176.69 2012-13 322.62 438.36
(73) (57) (59)
2765.37
(81)
466.24
(84)
607.96
(91)
493.05
(64)
704.52
(66)
411.17
(62)
541.36
(73)
2012-13 2013-14 2012-13
2013-14 2013-14
2012-13
2013-14
2012-13
2013-14
2012-13
2013-14
Grama Block District Muncipalities Corporations Total
Panchayats Panchayats
Panchayats
Allocation
Expenditure
*Figures in Parenthesis are the percentage of expenditure
Source: Appendix IV of the Budget & Information Kerala Mission,2014
Category - wise performance
8.14 As mentioned earlier, the allocation of grant-in-aid to LGs in three categories-General Sector,
Special Component Plan (SCP) and Tribal Sub Plan (TSP).The outlay for each category is fixed on
the basis of the recommendations of the State Finance Commission. During the period under review,
an amount of ` 5057.59 crore was allocated to different categories of which general category, SCP &
TSP constituted 72%, 24% and 4 % respectively to the total allocation. An analysis of category wise
utilization during 2013-14 shows that the percentage of expenditure under General Sector was 79.09
per cent of the plan outlay and in the case of SCP and TSP it was 73 and 75 per cent respectively
as against the overall average of 77.47%.The corresponding figure in the previous year it was75 per
cent of the plan outlay and in the case of SCP and TSP it was 62 and 63 per cent respectively as
against the overall average of 70.84%.It shows an increase trend in the fund utilisation. Shortfall in
expenditure of SCP/TSP is a common phenomenon for all tiers of LGs except with the case of Block
Panchayats. The category wise and local body wise allocation during 2013-14 is given in Table 8.2
and in Fig 8.3.
Table 8.2
Category wise Allocation of Grant-in-aid to LGs during 2013-14
(` in Crore)
Type of LGs General SCP TSP Total
1 2 345
Grama Panchayats 2022.96 632.97 109.44 2765.38
Block Panchayats 409.49 168.63 29.84 607.96
District Panchayats 453.24 210.23 41.05 704.53
Municipalities 432.11 106.49 2.76 541.36
Corporations 347.60 90.75 0.85 438.36
Total 3665.40 1209.07 183.94 5057.59
Source: Information Kerala Mission-2014
Economic Review 2014