
Page 337 - economic review
P. 337
309
Productive Sector LOCAL GOVERNMENTS
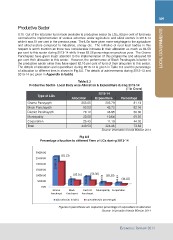
8.16 Out of the total plan fund made available to productive sector by LGs, 83 per cent of fund was
earmarked to implementation of various schemes under agriculture and allied sectors in 2013-14
while it was 81 per cent in the previous year. The LGs have given more weightage to the agriculture
and allied sectors compared to industries, energy etc. The initiative of rural local bodies in this
respect is worth mention as there was considerable increase in their allocation as much as 84.59
per cent to this sector during 2013-14 while it was 83.26 percentage on previous year. The Grama
Panchayats have given major attention to the implementation of this programme and allocated 89
per cent their allocation to this sector. However, the performance of Block Panchayats is better in
the productive sector since they have spent 82.16 per cent of fund of their allocation to this sector.
The details of allocation and expenditure during 2013-14 is given in Table 8.3 and the percentage
of allocation to different tiers is shown in Fig.8.5. The details of achievements during 2012-13 and
2013-14 are given in Appendix 8.4(a&b)
Table 8.3
Productive Sector- Local Body wise Allocation & Expenditure during 2013-14
(` in Crore)
Type of LGs Allocation 2013-14 Percentage
Expenditure
Grama Pancyayth 253.65 205.79 81.13
Block Panchayath 53.23 43.73 82.16
District Panchayath 78.12 43.98 56.30
Municipality 30.08 19.64 65.30
Corporation 25.43 11.19 44.02
Total 440.53 324.36 73.63
Source: Information Kerala Mission 2014
Fig 8.5
Percentage allocation to different Tiers of LGs during 2013-14
30000.00 (81.13)
25000.00
20000.00 25365.59 (82.16) (56.30) (65.30)
15000.00 5323.27
10000.00 7812.35 (44.02)
3008.90
5000.00 2543.63
0.00
Grama Block Dostrict Municipality Corporation
Panchayat Panchayat Panchayat
Allocation(Rs in lakh) Expenditrue(in percentage)
Figures in parenthesis are respective percentage of expenditure to allocation
Source: Information Kerala Mission 2014
Economic Review 2014