Page 338 - economic review
P. 338

310

LOCAL GOVERNMENTS  Service Sector

                   8.17 Under Service Sector all LGs have given more attention to enhance the quality of basic services
                   given to public through welfare oriented programmes with special emphasis on health and education.
                   In utilizing fund, the service sector is seen better in spending than the productive and infrastructure
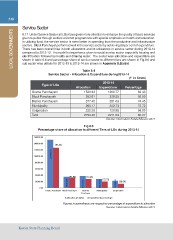
                   sectors. Block Panchayat performed well in the service sector by achieving 93 per cent of expenditure.
                   There has been overall hike in both allocations and its utilizations in service sector during 2013-14
                   compared to 2012-13. It reveals the importance given to social service sector especially housing and
                   electrification followed by health and drinking water. The sector wise allocation and expenditure are
                   shown in table 8.4 and percentage share of service sector to different tiers are shown in Fig.8.6 and
                   sub sector wise details for 2012-13 & 2013-14 are shown in Appendix 8.5(a&b)

                                                                    Table 8.4

                                 Service Sector - Allocation & Expenditure during2013-14

                   									                                                                                                                  (` in Crore)

                          Type of LGs                         Allocation                 2013-14                                     Percentage
                                                                                      Expenditure

                   Grama Panchayath                                         1520.83                 1268.77                                   83.43

                   Block Panchayath                                         353.61                  328.50                                    92.90

                   District Panchayath                                      377.45                  281.03                                    74.45

                   Municipality                                             280.17                  203.73                                    72.72

                   Corporation                                              222.39                  128.98                                    58.00

                   Total                                                    2754.46                 2211.03                                   80.27

                                                                                      Source: Information Kerala Mission 2014

                                                                Fig 8.6
                   Percentage share of allocation to different Tiers of LGs during 2013-14

                   160000.00

                   140000.00                (83.43)
                   120000.00
                                 152083.22
                   100000.00

                   80000.00

                   60000.00

                   40000.00                          (92.90)                ( 74.45)  (72.72)
                   20000.00
                                                     35361.36                                                                        (58.00)
                                                                            37745.71
                                                                                                    28017.15
                                                                                                                           22239.52
                          0.00
                                   Grama Panchayat Block Panchayat   Dostrict         Municipality     Corporation
                                                                    Panchayat

                                                     Allocation (in lakhs)  Expenditrue(in percentage

                                                     Figures in parenthesis are respective percentage of expenditure to allocation
                                                                                                     Source: Information Kerala Mission 2014

                   Kerala State Planning Board
   333   334   335   336   337   338   339   340   341   342   343