
Page 349 - economic review
P. 349
321
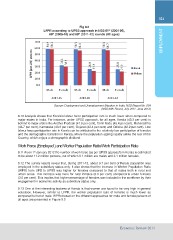
Fig 9.2 EMPLOYMENT
LFPR according to UPSS approach in NSS 61st (2004-05),
66th (2009-10) and 68th (2011-12) rounds (All ages)
Source: Employment and Unemployment Situation in India, NSS Report No. 554
(NSS 68th Round, July 2011- June 2012)
9.10 Analysis shows that Kerala’s labour force participation rate is much lower when compared to
major states in India. For instance, under UPSS approach, for all ages, Kerala (40.3 per cent) is
behind to major states like Andhra Pradesh (47.9 per cent), Tamil Nadu (45.4 per cent), Maharashtra
(43.7 per cent), Karnataka (43.0 per cent), Gujarat (42.4 per cent) and Odisha (42.2 per cent). Low
labour force participation rate in Kerala can be attributed to the relatively low participation of females
and the demographic transition in Kerala, where the population ageing rapidly unlike the rest of the
Country, which enjoys a demographic dividend.
Work Force (Employed ) and Worker Population Ratio/Work Participation Rate
9.11 As on 1st January 2012 the number of work force (as per UPSS approach) in Kerala is estimated
to be about 11.2 million persons, out of which 9.1 million are males and 2.1 million females.
9.12 The survey results reveal that, during 2011-12, about 3.7 per cent of Kerala population was
employed in the subsidiary status only. It also shows that the increase in Worker Population Ratio
(WPR) from UPS to UPSS was higher for females compared to that of males both in rural and
urban areas. This increase was more for rural females (6.0 per cent) compared to urban females
(3.0 per cent). This implies that higher percentage of females was included in the workforce by their
engagement in economic activity as subsidiary status only.
9.13 One of the interesting features of Kerala is that women are found to be very high in general
education. However, similar to LFPR, the worker population ratio of females is much lower as
compared to that of male. WPRs based on the different approaches for male and female persons of
all ages are presented in Figure 9.3
Economic Review 2014