
Page 351 - economic review
P. 351
323
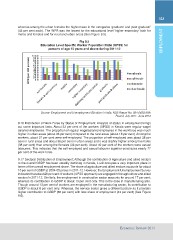
whereas among the urban females the highest was in the categories ‘graduate’ and ‘post graduate’ EMPLOYMENT
(43 per cent each). The WPR was the lowest for the educational level ‘higher secondary’ both for
males and females and for rural and urban areas (See Figure 9.5).
Fig 9.5
Education Level Specific Worker Population Ratio (UPSS) for
persons of age 15 years and above during 2011-12
Source: Employment and Unemployment Situation in India, NSS Report No. 554 (NSS 68th
Round, July 2011- June 2012
9.16 Distribution of Work Force by Status of Employment: Analysis of status in employment brings
out some important facts. About 23 per cent of the workers (UPSS) in Kerala were regular wage/
salaried employees. The proportion of regular wage/salaried employees in the workforce was much
higher in urban areas (about 36 per cent) compared to the rural areas (about 18 per cent). Among the
workers, about 37 per cent were self-employed. The proportion of self-employed was about 38 per
cent in rural areas and about 36 per cent in urban areas and it was slightly higher among the males
(38 per cent) than among the females (36 per cent). About 40 per cent of the workers were casual
labourers. This indicates that the self-employed and casual labourer together constitutes nearly 77
per cent of the work force.
9.17 Sectoral Distribution of Employment: Although the contribution of Agriculture and allied sectors
to the overall GSDP has been steadily declining in Kerala, it still occupies a very important place in
terms of the overall employment share. The share of agriculture and allied sectors accounts for about
10 per cent of GSDP at 2004-05 prices in 2011-12. However, the Employment-Unemployment Survey
indicates that about 26 per cent of workers (UPSS approach) are engaged in the agriculture and allied
sectors in 2011-12. Similarly, the employment in construction sector accounts for around 17 per cent;
whereas its contribution to GSDP is about 13 per cent only. This is the case in manufacturing also.
Though around 13 per cent of workers are employed in the manufacturing sector, its contribution to
GSDP is about 8 per cent only. Whereas, the service sector gives a different picture as it provides
higher contribution to GSDP (68 per cent) with less share of employment (43 per cent) (See Figure
9.6).
Economic Review 2014