
Page 350 - economic review
P. 350
EMPLOYMENT322
Fig 9.3
WPR in different approaches during 2011-12 (All ages)
Source: Employment and Unemployment Situation in India, NSS Report No. 554 (NSS 68th
Round, July 2011- June 2012)
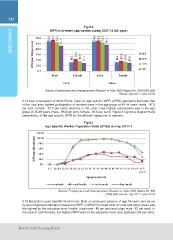
9.14 Age composition of Work Force: Data on age specific WPR (UPSS approach) indicates that
in the rural area highest participation of workers were in the age group of 40-44 years (male - 97.8
per cent, female - 47.0 per cent); whereas in the urban area highest participation was in the age
group of 35-39 years (male - 96.6 per cent, female - 39.6 per cent). Figure 9.4 gives a diagrammatic
presentation of the age specific WPR for the different categories of persons.
Fig 9.4
Age Specific Worker Population Ratio (UPSS) during 2011-12
Source: Employment and Unemployment Situation in India, NSS Report No. 554
(NSS 68th Round, July 2011- June 2012)
9.15 Education Level Specific Work Force: Data on employed persons of age 15 years and above
by level of general education shows that WPR in UPSS for males both for rural and urban areas was
the highest for the education level ‘middle’ (rural male - 86 per cent and urban male - 87 per cent). In
the case of rural females, the highest WPR was for the education level ‘post graduate’ (44 per cent);
Kerala State Planning Board