
Page 40 - economic review
P. 40
MACRO ECONOMIC PROFILE12
District-wise Per Capita Income
1.24 Growth rate at current prices does not eliminate the inflationary impact. When district level
growth rate at constant prices, is compared the “real” NSDP growth rate may be observed as the
inflationary impact has been eliminated. Table 1.5 reveals that the districts of Kasargod, Kozhikode,
Thrissur and all the southern districts viz. Thiruvananthapuram, Kollam, Pathanamthitta, Alappuzha
had higher real growth in NSDP than the State Average. However, the districts of Wayanad, Kollam,
Palakkad and Idukki showed lower growth in per capita income than the state average.
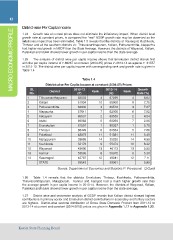
1.25 The analysis of district wise per capita income shows that Ernakulam district stands first
with the per capita income of ` 86267 at constant (2004-05) prices in 2013-14 as against ` 81557
in 2012-13. The district wise per capita income with corresponding rank and growth rate is given in
Table 1.4
Table 1.4
District-wise Per Capita Income at constant (2004-05) Prices
Sl. District 2012-13 Rank 2013-14 Rank Growth
No. (P) (Q) Rate (%)
1
2 Thiruvananthapuram 63003 4 67299 4 6.82
3 7.75
4 Kollam 51934 10 55960 9 7.07
5 7.02
6 Pathanamthitta 64930 3 69518 3 4.54
7 2.05
8 Alappuzha 57941 7 62006 6 5.78
9 7.06
10 Kottayam 66531 2 69555 2 5.49
11 4.59
12 Idukki 59058 5 60269 7 6.32
13 5.55
14 Eranakulam 81557 1 86267 1 5.30
7.11
Thrissur 58429 6 62554 5 5.96
Palakkad 48879 11 51561 11
Malappuram 33685 14 35230 14
Kozhikode 52176 9 55474 10
Wayanad 43690 13 46113 13
Kannur 53536 8 56372 8
Kasaragod 45787 12 49041 12
STATE 55643 58961
Source: Department of Economics and Statistics P: Provisional Q:Quick
1.26 Table 1.4 reveals that the districts Ernakulam, Thrissur, Kozhikode, Pathanamthitta,
Thiruvananthapuram, Malappuram, Kannur and Kasrgod had a much higher growth rate than
the average growth in per capita income in 2013-14. However, the districts of Wayanad, Kollam,
Palakkad and Idukki showed lower growth in per capita income than the state average.
1.27 District wise and sectorwise analysis of GSDP reveals that Kollam district showed highest
contributions in primary sector and Ernakulam district contributions in secondary and tertiary sectors
are highest. District-wise sectoral distribution of Gross State Domestic Product from 2011-12 to
2013-14 at current and constant (2004-2005) prices are given in Appendix 1.17 to Appendix 1.22.
Kerala State Planning Board