
Page 39 - economic review
P. 39
11
percent in 2013-14 at constant (2004-05) prices followed by secondary sector (1.34 percent) and MACRO ECONOMIC PROFILE
primary sector showed a negative growth rate of -1.36 per cent. The driving factor for the growth of
the tertiary sector is mainly the growth in the transport, storage and communication sector which is
showing an increase to 16.78 percent in 2013-14 from 12.69 percent in 2012-13. Negative growth in
agriculture is generally because of the decrease of production in some of the cash crops like pepper,
turmeric, cashew, tea and coffee. At current prices, the tertiary sector recorded a growth rate of
17.68 percent, secondary sector 17.68 percent and primary sector with 7.5 percent in 2013-14.
The details of sectoral distribution of GSDP with percentage during the last three years is given in
Appendix 1.10 to 1.12 and the details of GSDP, NSDP at constant and current prices during 2004-05
to 2012-13 are given at Appendix 1.13 to 1.16.
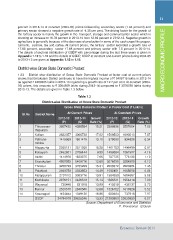
District-wise Gross State Domestic Product
1.23 District wise distribution of Gross State Domestic Product at factor cost at current prices
shows that Ernakulam District continues to have the highest income of ` 5409716 lakhs in 2013-14
as against ` 4800385 lakhs in 2012-13 registering a growth rate of 12.7 per cent. At constant (2004-
05) prices, this amounts to ` 3264509 lakhs during 2013-14 compared to ` 3076050 lakhs during
2012-13. The details are given in Table 1.3 below.
Table 1.3
District-wise Distribution of Gross State Domestic Product
Gross State Domestic Product at Factor Cost (` Lakhs)
Sl.No District Name At Current Prices At Constant Prices
1 Thiruvanan- 2012-13 2013-14 Growth 2012-13 2013-14 Growth
thapuram (P) (Q) Rate (%) (P) (Q) Rate (%)
2 Kollam
3 Pathana- 3807422 4386584 15.21 2389896 2557684 7.02
mthitta
4 Alappuzha 2622357 3068738 17.02 1569503 1693013 7.87
5 Kottayam 1415969 1601475 13.10 879090 934826 6.34
6 Idukki
7 Eranakulam 2265121 2611265 15.28 1401763 1499499 6.97
8 Thrissur
9 Palakkad 2462601 2706144 9.89 1499584 1561907 4.16
10 Malappuram
11 Kozhikode 1414976 1523375 7.66 767725 776133 1.10
12 Wayanad
13 Kannur 4800385 5409716 12.69 3076050 3264509 6.13
14 Kasaragod
GSDP 3256733 3755299 15.31 2066372 2220384 7.45
2649788 3033803 14.49 1592401 1688606 6.04
2707112 3083776 13.91 1594353 1684897 5.68
2976151 3426518 15.13 1826511 1954414 7.00
730448 831919 13.89 412519 436137 5.73
2520570 2840500 12.69 1526722 1610924 5.52
1154444 1349136 16.86 683464 737916 7.97
34784078 39628246 13.93 21285953 22620850 6.27
Source: Department of Economics and Statistics
P: Provisional Q:Quick
Economic Review 2014