
Page 52 - economic review
P. 52
24
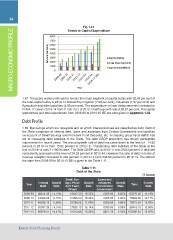
MACRO ECONOMIC PROFILE 8000 Fig 1.10
Amount (in Crore) 7000 Trends in Capital Expenditure
6000
5000 Capital Outlay
4000 Loan Disbursements
3000 Capital Expenditure
2000
1000
0
Year
1.67 The public works continued to remain the major segment of capital outlay with 32.68 per cent of
the total capital outlay in 2013-14 followed by Irrigation (7.98 per cent), Industries (7.97 per cent) and
Agriculture and allied activities (4.90 per cent). The expenditure on loan disbursements increased to
`1464.17 crore in 2013-14 from `1136.15 cr. of 2012-13 with a growth rate of 28.87 per cent. The capital
expenditure and total expenditure from 2008-09 to 2014-15 BE are also given in Appendix 1.39.
Debt Profile
1.68 Borrowings which are repayable and on which interest accrues are classified as debt. Debt of
the State comprises of internal debt, loans and advances from Central Government and liabilities
on account of Small Savings and Provident Fund Deposits, etc. Increasing gross fiscal deficit has
led to increasing debt liabilities of the State. The debt GSDP proportion has shown perceptible
improvement in recent years. The annual growth rate of debt has come down to the level of 14.92
percent in 2013-14 from 15.82 percent in 2012-13. Outstanding debt liabilities of the State at the
end of 2013-14 was ` 119009 crore. The Debt-GSDP ratio in 2010-11 was 29.83 percent. It declined
consistently and reached the level of 29.53 percent in 2013-14. However the ratio of debt-in terms of
revenue receipts increased to 242 percent in 2013-14 from 234.63 percent in 2012-13. The debt of
the state from 2008-09 to 2014-15 BE is given in the Table 1.11.
Table 1.11
Debt of the State
(` Crore)
Year Internal Growth Small Sav- Growth Loans and Growth Total Growth
ings, Provi- Rate advances Rate Rate
2008-09 Debt Rate dent Fund, from Central
2009-10 Government
2010-11 Others
2011-12
2012-13 38814.00 14.10% 18447.00 16.33% 6009.00 8.60% 63270.00 14.19%
43368.00 11.73%
48528.10 11.90% 21296.00 15.44% 6305.00 4.93% 70969.00 12.17%
55397.39 14.16%
65628.41 18.47% 23786.06 11.69% 6359.08 0.86% 78673.24 10.86%
27625.10 16.14% 6395.69 0.58% 89418.18 13.66%
31310.65 13.34% 6621.78 3.54% 103560.84 15.82%
Kerala State Planning Board