
Page 53 - economic review
P. 53
25
2013-14 76804.35 17.03% 35542.51 13.52% 6662.21 0.61% 119009.07 14.92% MACRO ECONOMIC PROFILE
90023.00 17.21% 33763.00 -5.01% 7793.00 16.97% 131579.00 10.56%
2014-15
(BE)
Source: Finance Department, Govt. of Kerala
1.69 Market borrowings and loans from financial institutions mainly constitute the internal debt of
the State and it constitutes major share of the State’s debt liabilities. Central government loans and
accruals from State Provident fund deposits are the other sources of State’s debt. The share of
internal debt in the total debt liabilities of the State comes to 65 per cent in 2013-14. The growth
rate of internal debt in 2013-14 was 17.03 per cent. Outstanding debt under internal debt increased
to ` 76804.35 crore in 2013-14 from ` 65628.41 cr. in 2012-13. The liabilities under small savings,
PF, etc. comes to around 30 per cent of the total liabilities. The liabilities under Small savings, PF,
etc at the end of 2013-14 was ` 35542.51 cr. It showed an increase of ` 4231.86 cr. over 2012-13.
The outstanding liabilities under Loans and Advances from the Centre at the end of 2013-14 were
` 6662.21 cr. The gross and net retention of debt in 2013-14 was `15448.24 cr and 7154.66 cr
respectively. The debt profile of the state from 2008-09 to 2014-15 BE is given in Appendix 1.40.
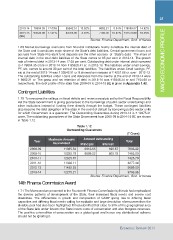
Contingent Liabilities
1.70 To overcome the ceilings on fiscal deficits and revenue receipts set by the Fiscal Responsibility
Act the State Government is giving guarantees to the borrowings of public sector undertakings and
other institutions instead of funding them directly through the budget. These contingent liabilities
also become the debt obligation of the state in the event of default by borrowing public sector units
for which Government is a guarantor. The Outstanding Guarantees during 2013-14 is ` 12275.21
crore. The outstanding guarantees of the State Government from 2008-09 to 2014-15 BE are shown
in Table 1.12.
Table 1.12 (` Crore)
Outstanding Guarantees
Year Maximum Amount Amount outstanding Total
Guaranteed
2008-09 Principal Interest 7603.32
2009-10 11385.54 6912.65 690.67 7495.00
2010-11 10225.78 6889.22 605.78 7425.79
12625.07
2011-12 11332.11 8277.44
2012-13 11482.25 9099.50
2013-14 12275.21 9763.36
Source: Finance Department, Govt. of Kerala
14th Finance Commission Award
1.71 The Memorandum presented to the Fourteenth Finance Commission by Kerala had emphasized
the diverse patterns of development of the State, their increased fiscal needs and severe cost
disabilities. The differentials in growth and composition of GSDP giving rise to differing fiscal
capacities and differing fiscal needs calling for equitable and large devolution of resources from the
divisible pool had also been highlighted. It had submitted that close to 30% of the geographical area
of the State falls under forests; the State incurs costs of conservation and also foregoes revenues.
The positive externalities of conservation are a global good and hence any distributional scheme
should not be ignoring it.
Economic Review 2014