
Page 66 - economic review
P. 66
38
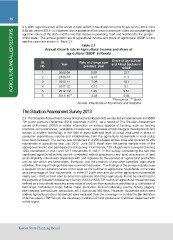
AGRICULTURE AND ALLIED SECTORS 2.3 With regard to share of the sector in total GSDP, it has declined from 9.51 per cent in 2012-13 to
8.83 per cent in 2013-14. However, the importance of the sector cannot be ruled out considering the
agrarian nature of the state and the role that it plays in providing food and livelihood to the people
of the state. The annual growth rate of agricultural income and share of agricultural GSDP for the
last five years are shown in Table 2.1.
Table 2.1
Annual Growth rate in Agricultural Income and share of
agricultural GSDP in Kerala
Sl. Year Rate of change over Share of Agriculture
No. previous year and Allied Sectors in
GSDP
1 2008-09 2.08 12.7
2 2009-10 -3.01 11.5
3 2010-11 -7.28 10.1
4 2011-12 -0.15 9.1
5 2012-13* 1.46 9.51
6 2013-14** -2.88 8.83
*Provisional ** Quick
Source: Directorate of Economics and Statistics
The Situation Assessment Survey 2013
2.4 The Situation Assessment survey of Agricultural Households conducted at national level in NSSO
70th round (January-December 2013) published in 2014, as a repeat of The Situation Assessment
survey of Farmers (2003) to collect information on various aspects of farming, such as farming
practices and preferences, availability of resources, awareness of technological developments and
access to modern technology in the field of agriculture and level of living( measured in terms of
consumer expenditure, income and indebtedness from the agricultural households in rural India)
have been released .The survey was conducted in 4,259 villages across India and covered 35,200
households in agricultural year July 2012- June 2013. Apart from the central sample most of the
state governments also participated in this survey. From Kerala, 159 villages were surveyed covering
1236 households in visit I and 1217 households in visit II. In this survey, considering the fact that
significant agricultural activity can be conducted without possessing any land, possession of land
as an eligibility criteria was dispensed with and replaced by the concept of ‘agricultural production
unit’ as one which produces crops , livestock and the products of any other specified agricultural
activities. The major findings have been summarized below . The findings of the survey actually pose
a question on the agrarian nature of the state as the number of agricultural households in the state
as a percentage of rural households is mere 27.3 per cent and out of the agricultural households
nearly two – third of them earn income from activities other than agriculture. It is to be noted that for
the purpose of Situation Assessment Survey (SAS) of NSS 70th round, an agricultural household was
defined as a household receiving some value of produce from agriculture activities (e.g. cultivation of
field crops, horticultural crops, fodder crops, plantation, animal husbandry, poultry, fishery, piggery,
bee-keeping, vermiculture, sericulture, etc.,) during last 365 days. However, household which were
entirely agricultural labour household were excluded from the coverage. In contrast to the definition
of farmer used in 59th Round, the necessary condition of ‘land possession’ had been dispensed with
in this round.
Kerala State Planning Board