
Page 70 - economic review
P. 70
42
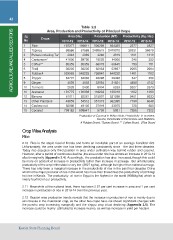
AGRICULTURE AND ALLIED SECTORS Table 2.2
Area, Production and Productivity of Principal Crops
Sl. Crops Area (Ha.) Production (MT) Productivity (Kg./Ha.)
No.
2012-13 2013-14 2012-13 2013-14 2012-13 2013-14
1 Rice 197277 199611 508299 564325 2577 2827
2 Tapioca 69586 67589 2458515 2479070 35331 36679
3 Pulses including Tur 2948 2989 3246 3019 1101 1010
4 Cardamom* 41600 39730 10222 14000 246 352
5 Coffee** 85359 85359 68175 66645 799 781
6 Tea$ 30205 30205 62963 62937 2085 2084
7 Rubber# 539565 548225 798940 648220 1481 1182
8 Pepper 84707 84065 46298 29408 547 350
9 Ginger 4505 4538 22064 21521 4898 4742
10 Turmeric 2628 2430 6904 6253 2627 2573
11 Arecanut 101775 100008 118233 100018 1162 1000
12 Banana 61011 62261 515607 531299 8451 8533
13 Other Plantains 48859 54512 351315 362395 7190 6648
14 Cashew nut 52086 49105 37919 33375 728 680
15 Coconut 798162 808647 5799 5921 7265 7322
Production of Coconut in Million Nuts, Productivity in numbers.
Source; Directorate of Economics and Statistics.
Crop Wise Analysis
# Rubber Board, *Spices Board .** Coffee Board . $Tea Board
Rice
2.10 Rice is the staple food of Kerala and forms an inevitable part of an average Keralites’ diet.
Unfortunately, the area under rice has been declining consistently since the last three decades.
Today rice occupies only third position in area under cultivation way behind rubber and coconut.
However, after a period of continuous decline ,the area under rice has shown an increase in 2013-14
albeit marginally (Appendix 2.4). Accordingly, the production has also increased,though this could
be more on account of increase in productivity rather than increase in acreage. But unfortunately,
productivity of the crop in the state is very low (2827 kg/ha), although its higher than national average.
There has only been a marginal increase in the productivity of rice in the past four decades China
which is the major producer of rice in the world has more than three times the productivity of (6744kg/
ha) rice in Kerala. The productivity of rice in Egypt is the highest in the world (9088kg/ha) which is
nearly fourfold of our productivity.
2.11 Meanwhile at the national level, there has been 2.57 per cent increase in area and 1 per cent
increase in production of rice in 2013-14 over the previous year.
2.12 Season wise production trends reveals that the increase in production of rice is mainly due to
an increase in the mundakan crop, as the other two crops have not shown significant changes with
the puncha crop increasing marginally and the virippu crop infact declining (Appendix 2.5). The
increase could be mainly attributed to increase in area as well as increase in yield per hectare.
Kerala State Planning Board