
Page 69 - economic review
P. 69
41
Land Use Pattern AGRICULTURE AND ALLIED SECTORS
2.8 Kerala is one of those states in India where land resources are put to more intensive use than
anywhere else, mainly because of the low percapita availability of land in the state. Data on land use
pattern for the year 2013-14 is given in Appendix 2.2. Out of a total geographical area of 38.86 lakh
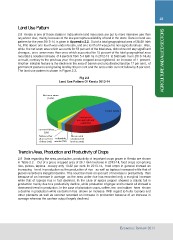
ha, little above one fourth was under forests, and one tenth of it was put to non agricultural use. Also,
while the net sown area which accounts for 53 percent of the total area, did not record any significant
changes , area sown more than once which accounted for 15 percent of the total geographical area
recorded a notable increase of 4 percent from 5.4 lakh ha in 2012-13 to 5.65 lakh ha in 2013-14. As
a result, contrary to the previous year the gross cropped area registered an increase of 1 percent.
Another notable feature is the decline in the area of barren and uncultivated land by 17 per cent, of
permanent pastures and grazing land by 93 per cent and the area under current fallow by 8 per cent.
The land use pattern is shown in Figure 2.3.
Fig 2.3
Land Use Pattern Of Kerala 2013-14
Net area sown
(53%)
Forest (28%)
Land put to
non-agricultural
use(10%)
current fallow Barren and
(2%) uncultivared
land (0.35%)
Fallow other
than current cultivable
fallow (1%) waste (2%)
Trend in Area, Production and Productivity of Crops
2.9 Data regarding the area, production, productivity of important crops grown in Kerala are shown
in Table 2.2 . Out of a gross cropped area of 26.1 lakh hectares in 2013-14, food crops comprising
rice, pulses, tapioca occupy only 10.32 per cent. In 2013-14, food crops in general showed an
increasing trend in production as the production of rice as well as tapioca increased while that of
pulses recorded a marginal decline. This could be more on account of increase in productivity than
because of an increase in acreage as the area under rice has recorded only a marginal increase
while that of tapioca has in fact declined. In the case of spices pepper showed a drastic fall in
production mainly due to a productivity decline, while production of ginger and turmeric all showed a
downward trend in production. In the case of plantation crops, coffee, tea and rubber have shown
a decline in production while cardamom has shown an increase. With regard to fruits banana and
other plantains as well as coconut recorded an increase in production because of an increase in
acreage whereas the cashew output largely declined.
Economic Review 2014