Macro Economic Profile
National Income
The Gross National Income (GNI) of India, at 2011-12 prices, is estimated at 11,213,328 crore during 2015-16, as against the previous year’s estimate of 10,427,701 crore (Table 1.1). The gross national income is estimated to have risen by 7.5 per cent during 2015-16, in comparison to the growth rate of 7.3 per cent in 2014-15. GNI at current prices is estimated at 13,418,745 crore during 2015-16, as compared to 12,340,772 crore during 2014-15 showing a rise of 8.7 per cent. The Net National Income (NNI) at current prices is estimated at 11,969,428 crore during 2015-16, as compared to 11,007,592 crore during 2014-15, showing a growth rate of 8.7 per cent. Details are given in Table 1.1.
Table 1.1
National Income, Domestic Product and Per Capita Income at 2011-12 Prices and Current prices (All India), in crore
| Sl No | Item at factor cost | At 2011-12 Prices | At Current Prices | ||||
| 2013-14 (NS) | 2014-15 (NS) | 2015-16 (PE) | 2013-14 (NS) | 2014-15 (NS) | 2015-16 (PE) | ||
| 1 | Gross National Income (GNI) | 9717062 | 10427701 (7.3) | 11213328 (7.5) | 11132877 | 12340772 (10.8) | 13418745 (8.7) |
| 2 | Net National Income (NNI) | 8615309 | 9235026 (7.2) | 9934863 (7.6) | 9934405 | 11007592 (10.8) | 11969428 (8.7) |
| 3 | Gross domestic product (GDP) | 9839434 | 10552151 (7.2) | 11350249 (7.6) | 11272764 | 12488205 (10.8) | 13576086 (8.7) |
| 4 | Net domestic product (NDP) | 8737681 | 9359476 (7.1) | 10071784 (7.6) | 10074292 | 11155025 (10.7) | 12126769 (8.7) |
| 5 | Per capita Gross domestic product () | 78653 | 83285 (5.9) | 88466 (6.2) | 90110 | 98565 (9.4) | 105815 (7.4) |
| 6 | Per capita Net domestic product () | 69846 | 73871(5.7) | 78502 (6.2) | 80530 | 88043 (9.3) | 94519 (7.4) |
Note: The figures in parenthesis shows the percentage change over previous year.
NS- New Series Estimate, PE- Provisional Estimate
Source: Central Statistics Office
GDP at constant (2011-12) prices in the year 2015-16 is estimated at 11,350,249 crore showing a growth rate of 7.6 per cent over the estimates of GDP for the year 2014-15 (10,552,151 crore). GDP at current prices in the year 2015-16 is estimated at 13,576,086 crore showing a growth rate of 8.7 per cent over the estimates of GDP for the year 2014-15 (12,488,205 crore). The per capita GDP in real terms (at 2011-12 prices) during 2015-16 is estimated at 88466 as against 83285 in 2014-15, registering an increase of over 6.2 per cent. The per capita GDP in real terms at current prices is estimated at 105,815 in 2015-16 as against 98,565 for the previous year depicting a growth of 7.4 per cent.
The details of GDP, NDP, GNI and NNI at current and constant (2011-12) prices from 2012-13 to 2015-16 with percentage change over previous year are given in Appendix 1.4., Appendix 1.5., Appendix 1.6. and Appendix 1.7. The sectoral distribution of GDP at constant (2011-12) prices and current prices with percentage change over previous year is given in Appendix 1.8. and Appendix 1.9.
State Income
The Ministry of Statistics and Programme Implementation has released the new series of national accounts. There are some conceptual differences between the key aggregates of national accounts published till 2014-15 at 2004-05 base year prices and 2011-12 base year prices being published now. The new series follows system of National Accounts (2008) Standards to a large extent. GDP at factor cost has been replaced by Gross Value Added (GVA) at basic prices and GDP at market prices is now termed GDP (Box 1.1).
Box 1.1
Base Year Change in the Computation of Gross State Domestic Product
Base year has been revised in the computation of national accounts statistics from 2004-05 to 2011-12. Some concepts have also undergone changes following the adoption of System of National Accounts (2008). Gross Domestic Product (GDP) at constant market prices will henceforth be known as GDP and Gross Value Added at basic prices will replace GDP at factor cost. The relation between the two is: GVA at basic prices = GVA at factor cost + production taxes less production subsidies. GDP and GVA at basic prices bear the following relationship: GDP = GVA at basic prices + product taxes - product subsidies.
Production taxes or production subsidies are paid or received with relation to production and are independent of the volume of actual production. Some examples of production taxes are land revenues, stamps and registration fees and tax on profession. Some production subsidies are subsidies to Railways, input subsidies to farmers, subsidies to village and small industries, and administrative subsidies to corporations or cooperatives. Product taxes or subsidies are paid or received on per unit of product. Some examples of product taxes are excise tax, sales tax, service tax and import and export duties. Product subsidies include food, petroleum and fertilizer subsidies, interest subsidies given to farmers, and households through banks, and subsidies for providing insurance to households at lower rates.
Comprehensive coverage of the corporate sector in manufacturing, services and the financial sector by inclusion of information from the accounts of stock brokers, stock exchanges, asset management companies, mutual funds and pension funds, and the regulatory bodies has led to changes in the estimates of GVA both at aggregate and sectoral levels.
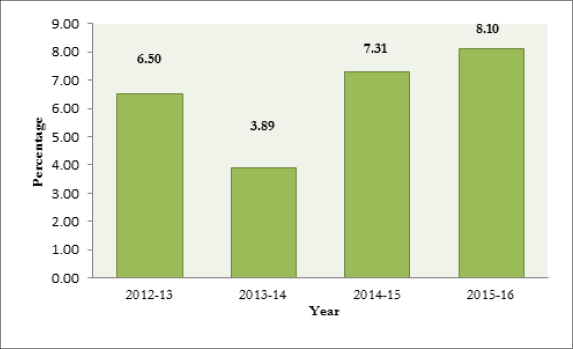
The quick estimate of Gross State Domestic Product (GSDP) at constant (2011-12) prices is 46,724,313 lakhs during 2015-16 as against the provisional estimate of 43,223,674 lakhs during 2014-15. GSDP registered a growth rate of 8.10 per cent in 2015-16 compared to 7.31 per cent in 2013-14 (Figure. 1.4). At current prices, the GSDP is estimated at 58,833,659 lakhs (quick estimate) during 2015-16 as against the provisional estimate of 52,600,230 lakhs during 2014-15 showing a growth rate of 11.85 per cent.
Figure 1.4
Growth Rate of GSDP at Constant (2011-12) Prices, Kerala in percent

Source: Department of Economics and Statistic
The quick estimate of Net State Domestic Product (NSDP) at factor cost at constant prices (2011-12) is 42,613,173 lakhs during 2015-16 compared to the provisional estimate of 39,370,155 lakhs during 2014-15, recording a growth rate of 8.24 per cent in 2015-16. At current prices the NSDP is estimated at 53,112,606 lakhs (quick estimate) in 2015-16 compared to the provisional estimate of 47,304,466 lakhs during 2014-15. The growth rate of NSDP at current prices is 12.28 per cent in 2015-16 compared to 13.37 per cent in 2014-15 (Table 1.2).
Table 1.2
State Domestic Product and Per Capita Income of Kerala, in lakh and per cent
| Sl No | Item | Income ( Lakhs) | Growth Rate (Per cent) | |||
| 2013-14 | 2014-15 (P) | 2015-16 (Q) | 2014-15 (P) | 2015-16 (Q) | ||
| 1 | Gross State Domestic Product | |||||
| a) At Constant (2011-12) prices | 40278133 | 43223674 | 46724313 | 7.31 | 8.10 | |
| b) At Current prices | 46504121 | 52600230 | 58833659 | 13.11 | 11.85 | |
| 2 | Net State Domestic Product | |||||
| a) At Constant (2011-12) prices | 36470677 | 39370155 | 42613173 | 7.95 | 8.24 | |
| b) At Current prices | 41726497 | 47304466 | 53112606 | 13.37 | 12.28 | |
| 3 | Per Capita GSDP () | |||||
| a) At Constant (2011-12) Prices | 119105 | 127187 | 136811 | 6.79 | 7.57 | |
| b) At Current Prices | 137515 | 154778 | 172268 | 12.55 | 11.30 | |
| 4 | Per Capita NSDP () | |||||
| a) At Constant (2011-12) Prices | 107846 | 115848 | 124773 | 7.42 | 7.70 | |
| b) At Current Prices | 123388 | 139195 | 155516 | 12.81 | 11.73 | |
Source: Department of Economics and Statistics
P: Provisional Estimate, Q: Quick Estimate
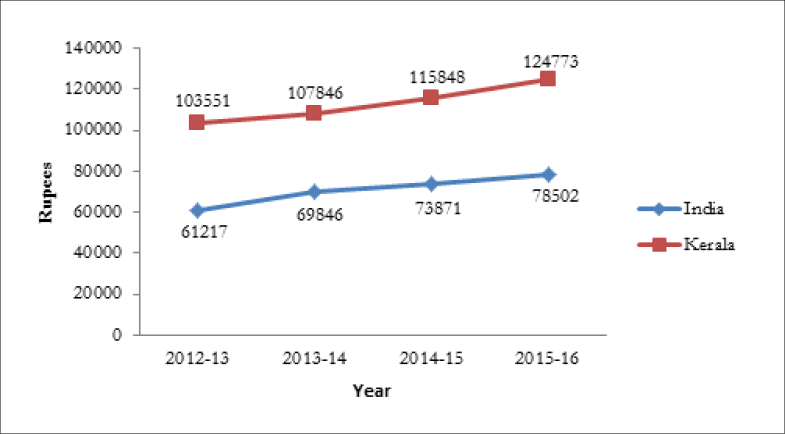
Figure 1.5
Per Capita State Income at Constant Prices

Source: Central Statistics Office and Department of Economics and Statistic
Per Capita State Income
As per the quick estimates, the per capita GSDP at constant (2011-12) prices in 2015-16 was 136,811 as against provisional estimate of 127,187 in 2014-15, recording a growth rate of 7.57 per cent in 2015-16. At current prices, the per capita GSDP in 2015-16 was 172,268 registering a growth rate of 11.30 per cent over the previous year’s estimate of 154,778. The best indicator of per capita state income is NSDP divided by the population. At constant (2011-12) prices, the quick estimates of per capita Net State Domestic Product in 2015-16 was 124,773 as against provisional estimate of 115,848 in 2014-15, recording a growth rate of 7.70 per cent in 2015-16. Figure 1.5 shows that during the period 2012-13 to 2015-16, the per capita state income at constant prices was higher than the per capita national income.
Sectoral Distribution of Gross State Value Added (GSVA)
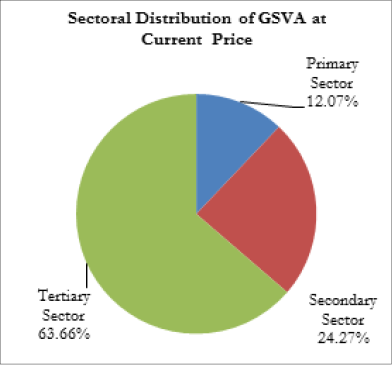
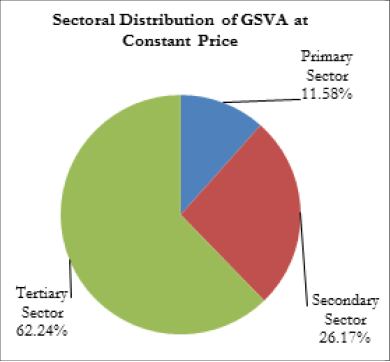
During 2015-16, the contribution from primary, secondary and tertiary sectors to the GSVA at constant prices (2011-12) was 11.58 per cent, 26.17 per cent and 62.24 per cent respectively. At current prices, the primary, secondary and tertiary sectors contributed 12.07 per cent, 24.27 per cent and 63.66 per cent respectively to the GSVA during this period (Figure 1.6).
Figure 1.6
Sectoral Distribution of GSVA 2015-16 at Basic Prices, in per cent


Source: Department of Economics and Statistics, Government of Kerala
In 2015-16, at current prices, the contribution to GSVA of the tertiary sector increased to 63.66 per cent from 61.53 per cent in 2014-15. The contribution from primary and secondary sector declined from 13.45 per cent to 12.07 per cent in the primary sector, and from 25.02 per cent to 24.27 per cent in the secondary sector during the corresponding period. The analysis of annual sectoral growth rate of GSDP shows that the tertiary sector recorded the highest rate of growth 8.78 per cent in 2015-16 at constant (2011-12) prices compared to 8.32 per cent in 2014-15 followed by secondary sector (8.58 per cent). The primary sector recorded a negative growth rate of -2.08 per cent. Negative growth in agriculture was because of the decrease in production of some of the cash crops, and in fishing and aquaculture and forestry and logging.
The details of sectoral distribution of GSDP with percentage share during the last three years is given in Appendix 1.10., Appendix 1.11. and Appendix 1.12. and the details of GSDP, NSDP at constant and current prices during 2011-12 to 2015-16 are given at Appendix 1.13., Appendix 1.14., Appendix 1.15. and Appendix 1.16..
At current prices, the tertiary sector recorded a growth rate of 14.94 per cent, secondary sector 7.73 per cent and primary sector 0.37 per cent in 2015-16 compared to the previous year. The driving force of growth in the tertiary sector is growth in the transport, storage, communication and service-related broadcasting, real estate, ownership of dwelling and professional services.
District-wise Gross State Domestic Product
District-wise distribution of GSVA at current prices shows that Ernakulam district continues to have the highest income of 6,811,532 lakhs in 2015-16 as against 6,042,283 lakhs in 2014-15 registering a growth rate of 12.73 per cent. At constant (2011-12) prices, this amounts to 5,489,638 lakhs during 2015-16 compared to 5,061,012 lakhs during 2014-15. The district-wise GSVA details are given in Table 1.3.
Table 1.3
District-wise Distribution of Gross State Value Added, in lakh
| Sl. No | District Name | Gross State Value Added at Basic Price | |||||
| At Current Prices | At Constant Prices | ||||||
| 2014-15 (P) | 2015-16 (Q) | Growth Rate (per cent) | 2014-15 (P) | 2015-16 (Q) | Growth Rate (per cent) | ||
| 1 | Thiruvananthapuram | 4856255 | 5527866 | 13.83 | 3980052 | 4379870 | 10.05 |
| 2 | Kollam | 4447889 | 4833817 | 8.68 | 3635333 | 3816002 | 4.97 |
| 3 | Pathanamthitta | 1388104 | 1484563 | 6.95 | 1151854 | 1192745 | 3.55 |
| 4 | Alappuzha | 3578694 | 3860438 | 7.87 | 2902885 | 3060179 | 5.42 |
| 5 | Kottayam | 2929854 | 3231414 | 10.29 | 2484692 | 2631789 | 5.92 |
| 6 | Idukki | 1820222 | 1931443 | 6.11 | 1445373 | 1509331 | 4.43 |
| 7 | Ernakulam | 6042283 | 6811532 | 12.73 | 5061012 | 5489638 | 8.47 |
| 8 | Thrissur | 4887638 | 5499420 | 12.52 | 4019513 | 4359486 | 8.46 |
| 9 | Palakkad | 3502457 | 3916469 | 11.82 | 2837929 | 3053495 | 7.60 |
| 10 | Malappuram | 4600118 | 5188140 | 12.78 | 3783386 | 4089318 | 8.09 |
| 11 | Kozhikode | 4214011 | 4669634 | 10.81 | 3436883 | 3686581 | 7.27 |
| 12 | Wayanad | 981932 | 1073096 | 9.28 | 764660 | 810384 | 5.98 |
| 13 | Kannur | 3358216 | 3727473 | 11.00 | 2757405 | 2972726 | 7.81 |
| 14 | Kasaragod | 1625587 | 1819296 | 11.92 | 1311212 | 1427568 | 8.87 |
| GSVA | 48233260 | 53574598 | 11.07 | 39572189 | 42479111 | 7.35 | |
Source: Department of Economics and Statistics P: Provisional Estimate Q: Quick Estimate
District-wise Per Capita Income
The analysis of district wise per capita income shows that Ernakulum district continues to stands first with the per capita income of 146,518 at constant (2011-12) prices in 2015-16 as against 135,817 in 2014-15. The district wise per capita income with corresponding rank and growth rate is given in Table 1.4.
Table 1.4
District-wise per capita income at basic price- constant (2011-12) prices, in and per cent
| Sl. No. | District | 2014-15 (P) | Rank | 2015-16 (Q) | Rank | Growth Rate (per cent) |
| 1 | Thiruvananthapuram | 108108 | 7 | 118740 | 7 | 9.83 |
| 2 | Kollam | 124329 | 2 | 130341 | 2 | 4.84 |
| 3 | Pathanamthitta | 88399 | 10 | 92130 | 12 | 4.22 |
| 4 | Alappuzha | 123368 | 3 | 130172 | 3 | 5.52 |
| 5 | Kottayam | 113519 | 6 | 120122 | 5 | 5.82 |
| 6 | Idukki | 114673 | 4 | 119908 | 6 | 4.57 |
| 7 | Ernakulam | 135817 | 1 | 146518 | 1 | 7.88 |
| 8 | Thrissur | 114168 | 5 | 123341 | 4 | 8.03 |
| 9 | Palakkad | 88342 | 11 | 94623 | 10 | 7.11 |
| 10 | Malappuram | 80277 | 14 | 85575 | 14 | 6.60 |
| 11 | Kozhikode | 99197 | 8 | 105873 | 8 | 6.73 |
| 12 | Wayanad | 81842 | 13 | 86202 | 13 | 5.33 |
| 13 | Kannur | 97178 | 9 | 104246 | 9 | 7.27 |
| 14 | Kasaragod | 86045 | 12 | 93180 | 11 | 8.29 |
| STATE | 105104 | 112343 | 6.89 |
Source: Department of Economics and Statistics P: Provisional Estimate Q: Quick Estimate
Table 1.4 reveals that Thiruvananthapuram, Kasaragod, Thrissur, Ernakulam, Kannur and Palakkad districts had a higher-than-average growth rate in per capita income in 2015-16. However, Pathanamthitta, Idukki, Kollam, Kottayam and Wayanad districts showed lower-than-average growth in per capita income.
District-wise sectoral distribution of Gross State Domestic Product from 2012-13 to 2015-16 at current and constant (2011-12) prices are given in Appendix 1.17, Appendix 1.18, Appendix 1.19, Appendix 1.20, Appendix 1.21 and Appendix 1.22

