Foreword
Macro Economic Profile
State Finances
The condition of State Finances in Kerala during 2011-15 was marked by fiscal mismanagement. The steady gains made in fiscal parameters during 2006-11 lost momentum in the succeeding years due to gross inefficiency in tax administration and indiscipline in expenditure. Fiscal trajectory of 2015-16 showed some improvement but was not encouraging enough for a sustainable upturn. Had the State not received higher devolution of central taxes and the post-devolution revenue deficit grant from the centre during 2015-16, the State's fiscal consolidation path would have been murkier. Also, a considerable amount of immediate and short term liabilities were passed over to the next fiscal. Otherwise the fiscal situation of 2015-16 would have been abysmal.
Against the backdrop of the general fiscal stress at both state level and national level, the State is obliged to undertake strategic steps to return to the path of fiscal consolidation. However, a recovery from the present state of fiscal stagnation seems quite remote in the near future as State's economy is faceted with a variety of internal and extraneous vulnerabilities. The unfolding of demonetization crisis has inflicted further stress on the State economy. The ongoing contraction in GDP growth will be worsened by the cash crunch.
This will result in reducing the revenue collection and widen revenue and fiscal deficit gaps. It is in this background that the State government has to shoulder the outlays towards the 10th pay revision commitment and mobilize resources for social and physical development of the State. This is a major concern for the fiscal health of the State government.
The rule-based frameworks imparted by the enactment of Fiscal Responsibility and Budget Management Act (FRBM) by the State intend to achieve long-term macroeconomic stability. This piece of fiscal legislation entrusts greater responsibility to states to adhere to the targets-based framework for the management of Government finances. Achievement of fiscal targets stipulated by the FRBM Act seems unattainable in the present precarious fiscal scenario. Amendment to FRBM Act for the enhancement of borrowing limit becomes unavoidable to tide over the present fiscal crunch. Management of capital and current expenditure will otherwise be a tedious task.
After 2003, Kerala had made significant achievements in the fiscal consolidation. The revenue deficit, which was 4.37 per cent of GSDP in 2002-03, came down to 1.36 per cent in 2010-11. After this period growth in States tax revenue as well as other major revenue components was not buoyant enough to facilitate revenue-led fiscal consolidation. The fiscal deficit, which represents the total resource gap, had witnessed a steady rise in the last five years. In 2015-16, revenue deficit was 1.65 per cent of GSDP against 2.78 per cent of GSDP in 2014-15. Fiscal deficit to GSDP proportion during 2015-16 was 3.04 per cent, which stood at 3.75 per cent during 2014-15.
The implementation of the Goods and Services Tax (GST) from the next fiscal would be an important tax reform. It is widely expected that being a consumer state, Kerala will benefit the most out of the introduction of the GST. The extent of GST compensation from the centre will be a determining factor in the State finances in the immediate fiscal.
The major deficit indicators of the state for the period from 2010-11 to 2016-17 (BE) is shown in Table 1.5.
Table 1.5
Major Deficit Indicators, in crore
| Year | Revenue Deficit | Fiscal Deficit | Primary Deficit (-) / Surplus (+) | GSDP | |||
| Amount | Per cent to GSDP | Amount | Per cent to GSDP | Amount | Per cent to GSDP | ||
| 2010-11 | 3673.87 | 1.36 | 7730.46 | 2.87 | -2040.80 | -0.76 | 269473.79 |
| 2011-12 | 8034.26 | 2.61 | 12814.77 | 4.16 | -6521.17 | -2.12 | 307906.00 |
| 2012-13 | 9351.45 | 2.46 | 15002.47 | 3.95 | 7797.66 | 2.06 | 379417.00 |
| 2013-14 | 11308.56 | 2.63 | 16944.13 | 3.94 | 8678.74 | 2.02 | 430211.00 |
| 2014-15 | 13795.96 | 2.78 | 18641.72 | 3.75 | 8872.13 | 1.79 | 496886.00 |
| 2015-16 | 9656.81 | 1.65 | 17818.46 | 3.04 | 6707.61 | 1.15 | 585467.00 |
| 2016-17 BE | 13066.25 | 1.98 | 23139.89 | 3.51 | 10509.94 | 1.59 | 659308.00 |
Source: Finance Department, Goverment of Kerala
The committed expenditure on account of salaries, pensions, and debt charges showed a considerable increase in 2015-16 also. From 2016-17 onwards, the State government is committed to bear the liability towards 10th pay revision. Due to the increase in borrowings, the burden of interest payments of the State also increased steadily. To fulfill the State government's social commitment, it is obliged to spend more on devolution to local bodies, payments of welfare pensions and subsidies. Tax administration has to be strengthened to its optimum to tap resources to comply the State government's obligations.
The availability of better social and physical infrastructure is the hallmark of quality of expenditure. During 2015-16, the State's share of expenditure on education and health in total expenditure is higher than General Category States. But in respect of development and social sector expenditure and capital expenditure, the State's performance in 2015-16 was poor compared to that of General Category States.
Table 1.6
Financial Indicators for Government of Kerala, in crore
| Particulars | 2009-10 | 2010-11 | 2011-12 | 2012-13 | 2013-14 | 2014-15 | 2015-16 |
| Balance from current Revenue (BCR) | -2155 | -910 | -4973 | -4866 | -6694 | -9037 | -2738 |
| Interest Ratio | 0.20 | 0.18 | 0.17 | 0.16 | 0.17 | 0.17 | 0.16 |
| Capital Outlay/ Capital receipts | 0.26 | 0.43 | 0.31 | 0.29 | 0.25 | 0.23 | 0.46 |
| Return of Investment ratio | 0.008 | 0.020 | 0.016 | 0.016 | 0.018 | 0.012 | 0.013 |
| Outstanding Guarantees (including interest) / Revenue Receipts | 0.29 | 0.24 | 0.22 | 0.22 | 0.20 | 0.19 | 0.18 |
| Assets/ Liabilities | 0.40 | 0.40 | 0.40 | 0.40 | NA | NA | NA |
Source: Finance Department, Government of Kerala
NA : Not Available
Receipts
State government receipts can broadly be divided into Revenue and Capital receipts. The revenue receipts comprise State's own tax and non-tax revenues, share of central tax transfers and grants-in-aid from Government of India, whereas capital receipts mostly consist of disinvestment receipts, recoveries of loans and advances, debt receipts from internal resources and loans and advances from Government of India and net accretions under public account.
Revenue Receipts
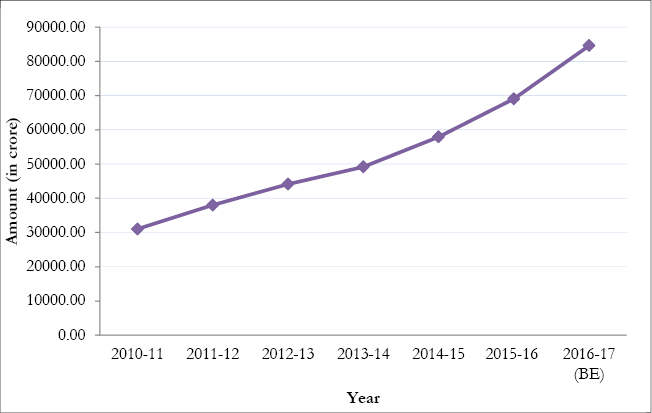
The revenue receipts of the State in proportion to GSDP increased marginally to 11.79 per cent in 2015-16 from 11.66 per cent in 2014-15. Growth rate of revenue receipts also showed an upward trend of 19.12 per cent in 2015-16 against 17.84 per cent in 2014-15. The trend in Revenue Receipts from 2010-11 to 2016-17 (BE) is given in Figure 1.11.
Figure 1.11
Trends in Revenue Receipts, Kerala, in crore
Source: Finance Department, Government of Kerala
State's own taxes are the main source of revenue receipts of the State. In 2015-16, contribution from State's own taxes was 38,995.15 crore, which constitutes 56.49 per cent of the total revenue collection. Contributions from the share of central taxes and grants were 21,612.02 crore and State's own non-tax revenue was 8,425.49 crore. The details of Revenue Receipts from 2010-11 to 2016-17 BE is given in Appendix 1.33.
State's Own Tax Revenue (SOTR)
The main sources of State's Own Tax Revenue (SOTR) are Sales Tax including Value Added Tax (VAT), Stamps and Registration fees, State Excise Duties, Motor Vehicle Tax and Land Revenue. The State's Own Tax Revenue showed a declining trend from 2011-12 to 2013-14 and from 2014-15 onwards it showed a slight upward trend. The receipts from State's Own Tax Revenue showed a marginal increase in 2015-16 (38995.15 crore) against 2014-15 (35232.50 crore) registering a growth of 10.68 per cent. Of the SOTR, the major share was from Sales Tax including VAT. In 2015-16, receipts from Sales Tax and VAT contributed 30736.78 crore which was 78.82 per cent of the ttal SOTR, followed by 7.38 per cent from Stamp duties and registration fees ( 2877.73 crore), 7.22 per cent from Taxes on Vehicles ( 2814.31 crore), 5.04 per cent from State Excise Duties (1964.16 crore) and 0.46 per cent from Land Revenue ( 182.29 crore).
The receipts from Sales tax including VAT showed 10.13 per cent growth in 2015-16 over the previous year. The receipts from Motor vehicle taxes, Stamp duties and registration fees, State Excise duties and Land revenue recorded a growth of 19, 8.2, 10.51 and 31.12 per cent respectively in 2015-16. The details of State's Own Tax Revenue from 2010-11 to 2016-17 (BE) is given in Appendix 1.34.
State's Own Non-Tax Revenue (SONTR)
Receipts under State Lotteries have been the major source of non-tax revenue of the State for last five years. Other main sources of State's own Non-Tax Revenue (SONTR) are receipts from Interest, Dividend receipts and receipts from various social developmental services and sale proceeds of forest produces.
Receipts from SONTR registered perceptible increase during the last five years. In 2014-15, 7283.69 crore was realized as SONTR, recording growth of 30.65 per cent over 2013-14 (5575.03). In 2015-16, growth rate showed a downward trend of 15.68 per cent over 2014-15. In 2015-16, receipts from State Lotteries came to . 6271.41 crore recording a growth rate of 15.18 per cent compared to 2014-15 (5444.88 crore). This constitutes 74.43 per cent of the total non tax revenue of the State. This was followed by .772.33 crore from Social Development Services (9.17 per cent) and 283.04 crore from Forest revenue (3.6 per cent). In 2015-16, receipts from debt services was 105.03 crore. The details of State's Own Non-Tax Revenue from 2010-11 to 2016-17 (BE) is given in Appendix 1.35.
Central Transfers
Central Transfers comprises of share in central taxes and grants in aid from Centre. State's share in central taxes and grant in aid is determined on the basis of recommendations of the Finance Commissions. As per the recommendations of 14th Finance Commission, the share of the States in the net proceeds of Union Government during the period from 2015-16 to 2019-20 will be 42 per cent. The share pattern for the last two Finance Commissions viz. Twelfth (period 2005-10) and Thirteenth (period 2010-15) were 30.5 per cent and 32 per cent respectively. The State specific share during the 14th Finance Commission period is 2.5 per cent, as against the 2.34 per cent in the 13th Finance Commission award period.
The 14th Finance Commission has recommended 9519 crore to the State for the period from 2015-16 to 2017-18 as Post-Devolution Revenue Deficit Grant .The State had received deficit grant of 4640 crore in 2015-16, 3350 crore in 2016-17 and would receive 1529 crore in 2017-18.
The annual growth rate of central transfers has increased from 2013-14 onwards. The central transfers by way of share of central taxes and grant-in aid received during 2015-16 was 21612.02 crore against 15434.28 crore in 2014-15. During this period, share in central taxes was 12690.67 crore. Even though 14th Finance Commission has not recommended grants for State Specific needs and other specific programmes, a substantial allocation of . 8921.35 crore was there in overall central grants during 2015-16 compared to 7507.99 crore received in 2014-15. The increase is attributed to the receipt of revenue deficit grant of 4640 crore received as per the 14th Finance Commission recommendations.
The details of Central Transfers from 2010-11 to 2016-17 (BE) is given in Table 1.7.
Table 1.7
Central Transfers: 2010-11 to 2016-17 (BE), in crore
| Year | Share in Central Taxes & Duties | Grant-in-aid and other receipts from Centre for Plan and Non-plan | Total Transfers | |||
| Amount | Annual Growth Rate (Per cent) | Amount | Annual Growth Rate (Per cent) | Amount | Annual Growth Rate (Per cent) | |
| 2010-11 | 5141.85 | 16.89 | 2196.62 | -1.65 | 7338.47 | 10.65 |
| 2011-12 | 5990.36 | 16.50 | 3709.22 | 68.86 | 9699.58 | 32.17 |
| 2012-13 | 6840.65 | 14.19 | 3021.53 | -18.54 | 9862.18 | 1.68 |
| 2013-14 | 7468.68 | 9.18 | 4138.21 | 36.96 | 11606.89 | 17.69 |
| 2014-15 | 7926.29 | 6.13 | 7507.99 | 81.43 | 15434.28 | 32.98 |
| 2015-16 | 12690.67 | 60.11 | 8921.35 | 18.82 | 21612.02 | 40.03 |
| 2016-17 (BE) | 14282.00 | 12.54 | 11361.72 | 27.35 | 25643.72 | 18.65 |
Source: Finance Department, Govt. of Kerala
Expenditure
Expenditure of the State consists of two components viz., revenue expenditure and capital expenditure and expenditure on loan disbursements. The total expenditure of the State doubled from 2010-11 to 2015-16. The revenue expenditure as well as the capital expenditure also doubled during the same period.
Revenue Expenditure
The revenue expenditure of the State mainly comprises of expenditure on salaries, pension, debt charges, devolutions to the Local Self Governments (LSG) and subsidies. The operational and maintenance cost for the upkeep of the completed projects and programmes are classified under the revenue account. Grants provided by the State to meet salaries and pension liabilities of employees in the Universities and State autonomous bodies and also the pension liabilities of employees of Panchayat Raj Institutions are classified under revenue expenditure. At the same time, a major portion of funds devolved to local bodies from the revenue account of the State government is utilized for the creation of capital assets of durable nature. Also a significant share of grant-in-aid set apart for universities and autonomous institutions are meant for creation of capital assets.
Expenditure on social and economic services together constitutes developmental expenditure. Funds devolved to Local Self Governments for expansion and development and maintenance of assets is also reckoned as developmental expenditure. The thrust on expenditure in the social and economic sectors has contributed towards maintaining the human development indicators of the State at a higher level, which ultimately has an impact on the long-term prospects of the economy. The State government's priority for social and economic services in the State is clearly evident from the increased trend of developmental expenditure in recent years. Non-developmental expenditure of the State mainly constitutes the committed expenditure consisting of debt charges, expenditure on pension payments and administrative services.
Revenue expenditure has more than doubled during the period from 2010-11 to 2015-16. Total revenue expenditure in 2015-16 was 78,689.47 crore, of which plan expenditure was 12,078.50 crore and non-plan expenditure was 66,610.97 crore. The ratio of revenue expenditure to GSDP has shown signs of stabilization during the period from 2011-12 to 2014-15, and in 2015-16 it showed a slight declining trend (13.44 per cent). The trend in revenue expenditure of the State from 2010-11 to 2016-17 (BE) is given in Figure 1.12 and component-wise details are given in Appendix 1.36.
Figure 1.12
Trends in Revenue Expenditure, Kerala, in crore
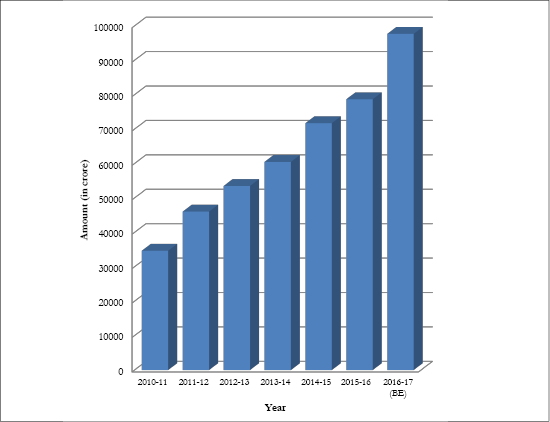 Source: Finance Department, Government of Kerala
The share of committed expenditure on revenue expenditure has slightly decreased during 2015-16, compared to the previous year. Expenditure on committed liabilities on salaries, pension, interest payments, subsidies and devolution to LSGs was 69.74 per cent of revenue expenditure during 2014-15 whereas in 2015-16 it was 68.61 per cent. During 2015-16, 76.58 per cent of the revenue receipts of the State were used for meeting the above committed expenditure. Important factors contributed for higher revenue expenditure are government's active intervention to contain rise in prices of essential commodities, inclusive policy initiatives to bring all weaker sections of society under social security net and also due to government's priority to impart quality services in health and education. Details of developmental and non- developmental expenditure for the period from 2010-11 to 2016-17 (BE) are given in Appendix 1.37
In 2015-16, salary expenditure as proportion of total revenue expenditure was 29.80 per cent whereas it was 29.75 per cent in 2014-15. Pension expenditure as percentage of total revenue expenditure was 16.60 per cent in 2015-16 compared to 15.69 per cent in 2014-15. Interest payment as percentage of total revenue expenditure increased to 14.12 per cent in 2015-16 from 13.64 per cent in 2014-15.
Table 1.8
Share of committed expenditure on Revenue Expenditure, in crore
| Items | 2011-12 | 2012-13 | 2013-14 | 2014-15 | 2015-16 | |||||
| Expenditure | As per cent of TRE | Expenditure | As per cent of TRE | Expenditure | As per cent of TRE | Expenditure | As per cent of TRE | Expenditure | As per cent of TRE | |
| i. Salaries | 16028.89 | 34.81 | 17257.53 | 32.26 | 19279.71 | 31.87 | 21343.58 | 29.75 | 23450.15 | 29.80 |
| ii. Pension | 8700.31 | 18.90 | 8867.58 | 16.58 | 9971.52 | 16.49 | 11256.46 | 15.69 | 13065.78 | 16.60 |
| iii. Interest | 6295.64 | 13.67 | 7212.82 | 13.48 | 8293.58 | 13.71 | 9790.15 | 13.64 | 11110.86 | 14.12 |
| iv. Devolutions to LSGIs | 3896.76 | 8.46 | 4739.33 | 8.86 | 4971.48 | 8.22 | 6398.00 | 8.92 | 5028.92 | 6.39 |
| v. Subsidies | 1001.94 | 2.18 | 1265.20 | 2.37 | 1251.77 | 2.07 | 1247.52 | 1.74 | 1336.94 | 1.70 |
| Committed Expenditure total (i to v) | 35923.54 | 78.02 | 39342.46 | 73.55 | 43768.06 | 72.36 | 50035.71 | 69.74 | 53992.65 | 68.61 |
| Others | 10121.08 | 21.98 | 14146.29 | 26.45 | 16717.44 | 27.64 | 21710.72 | 30.26 | 24696.82 | 31.39 |
| Total | 46044.62 | 100 | 53488.75 | 100 | 60485.50 | 100 | 71746.43 | 100 | 78689.47 | 100 |
Source: Finance Department, Government of Kerala
Capital Expenditure
The long term development of the economy depends upon investment in infrastructure sector. Investment policy initiatives initiated by the government in recent years have helped the State to gain crucial achievements. The State Government's initiatives for attracting long term investment in infrastructural projects have started yielding results. Deficit in resources is major impediment in infrastructure financing. Government has therefore adopted the policy of looking at alternative sources for financing major infrastructural projects of the State. The share of government spending on capital projects has increased during recent years. Substantial increase was noticed in capital expenditure of the state during 2015-16; it has increased to 7500.04 crore from 4254.59 crore in 2014-15. Capital outlay to GSDP ratio has also increased to 1.28 per cent in 2015-16 from 0.81 per cent in 2014-15. The public works continued to remain the major segment of capital outlay with 35.67 per cent of the total capital outlay in 2015-16 followed by Agriculture and allied activities (7.04 per cent), Irrigation (7.02 per cent) and Industries (4.47 per cent). Details of Capital expenditure from 2010-11 to 2016-17(BE) are given in Appendix 1.38 and Appendix 1.39 and trend in capital outlay and loan disbursement are shown in Figure1.13
Figure 1.13
Trend in Capital outlay and Loan disbursement, in crore
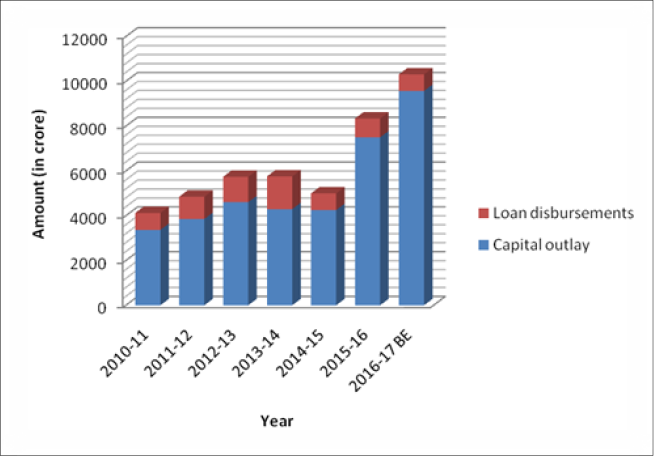
Source: Finance Department, Government of Kerala
A special strategy is indispensable for the revival of the State's economy by focusing on infrastructure development and social upliftment of the marginalized classes. Investment in the infrastructure sector is essential for the long term development of the economy. Implementation of major capital projects will be materialized through various financial and infrastructural institutions by creating Special Purpose Vehicles (SPVs). In this scenario, Kerala Infrastructure Investment Fund Board (KIIFB) has been restructured to act as the key SPV for mobilizing and channeling the funds to the various infrastructure SPVs. The details of KIIFB are provided in Chapter 5 of the review.
Government of Kerala has launched Nava Keralam Mission programmes for the multi dimensional development of the State. The mission mode initiatives give thrust to four key areas – Haritha Keralam (agriculture development, sanitation and water resource management), housing, education and health – and aim to turn a new leaf in the development history of the State. The mission projects will be implemented through meaningful participation of social organizations, groups and various other institutions including LSGs for the revival and sustainability of gains that the State has achieved in the past. These initiatives will be the stepping stone for the future economic development of the State.
Debt Profile
Debt of the State comprises of internal debt, loans and advances from Central Government and liabilities on account of Small Savings and Provident Fund Deposits. During the last five years, market borrowings and accretions in Small Savings and Provident Fund Deposits are the main sources of the State Government to finance the fiscal deficit. Outstanding debt liabilities of the State at the end of 2015-16 were 157,370.33 crore. The annual growth rate of debt has increased to the level of 16.19 per cent in 2015-16 from 13.81 per cent in 2014-15. The Debt-GSDP ratio in 2010-11 was 29.83 per cent. It came down and reached the level of 26.88 per cent in 2015-16. In 2014-15 it stood at the level of 26.05 per cent. The ratio of debt in terms of revenue receipts decreased to 227.97 per cent in 2015-16 from 233.72 per cent in 2014-15.
The share of internal debt in the total debt liabilities of the State comes to 65.13 per cent in 2015-16. Outstanding debt under internal debt increased to 102,496.26 crore in 2015-16 from 89,067.91 crore in 2014-15. The growth rate of internal debt in 2015-16 was 15.08 per cent. The liabilities under small savings and Provident Fund come to around 29 per cent of the total liabilities. The liabilities under Small savings and Provident Fund at the end of 2015-16 were 47,639.36 crore. It showed an increase of 8,332.08 crore over 2014-15 (39,307.28 crore). The outstanding liabilities under Loans and Advances from the Centre at the end of 2015-16 were 7234.71 crore. The gross and net retention of debt in 2015-16 was 21930.08 crore and 10819.22 crore respectively. Details of debt profile of the State are given in Table 1.9 and details of receipts and disbursements are given in Appendix 1.40.
Table 1.9
Debt of the State, in crore
| Year | Internal Debt | Growth Rate (percent) | Small Savings, Provident Fund, Others | Growth Rate (percent) | Loans and advances from Central Govt. | Growth Rate (percent) | Total | Growth Rate (percent) |
| 2010-11 | 48528.10 | 11.90 | 23786.06 | 11.69 | 6359.08 | 0.86 | 78673.24 | 10.86 |
| 2011-12 | 55397.39 | 14.16 | 27625.10 | 16.14 | 6395.69 | 0.58 | 89418.18 | 13.66 |
| 2012-13 | 65628.41 | 18.47 | 31310.65 | 13.34 | 6621.78 | 3.54 | 103560.84 | 15.82 |
| 2013-14 | 76804.35 | 17.03 | 35542.51 | 13.52 | 6662.21 | 0.61 | 119009.07 | 14.92 |
| 2014-15 | 89067.91 | 15.97 | 39307.28 | 10.59 | 7065.05 | 6.05 | 135440.24 | 13.81 |
| 2015-16 | 102496.26 | 15.08 | 47639.36 | 21.20 | 7234.71 | 2.40 | 157370.33 | 16.19 |
| 2016-17(BE) | 120068.13 | 17.14 | 47905.05 | 0.56 | 8865.46 | 22.54 | 176838.64 | 12.37 |
Source: Finance Department, Government of Kerala
Contingent Liabilities
To overcome the ceiling on fiscal deficit set by the Fiscal Responsibility Act, the State Government is giving guarantees to the borrowings of public sector undertakings and other institutions instead of funding them directly through the budget. These contingent liabilities become the debt obligations of the State in the event of default by the borrowing public sector units for which Government is a guarantor. The outstanding guarantees during 2015-16 is 13,712.77 crore. The outstanding guarantees of the State Government from 2010-11 to 2015-16 are shown in Table 1.10.
Table 1.10
Outstanding Guarantees, in crore
| Year | Maximum Amount Guaranteed | Amount Outstanding (Principal and Interest) |
| 2010-11 | 12625.07 | 7425.79 |
| 2011-12 | 11332.11 | 8277.44 |
| 2012-13 | 11482.25 | 9099.50 |
| 2013-14 | 12275.21 | 9763.36 |
| 2014-15 | 13123.30 | 11126.67 |
| 2015-16 | 13712.77 | 12438.52 |
Source: Finance Department, Government of Kerala