Macro Economic Profile
Prices
Commodity prices are a major determining factor of economic activities in India. Price fluctuation of essential commodities influences pattern of consumption of individuals as well as society. In the global market, commodity prices continued to decline because of weak demand and ample supplies. Energy prices dropped around 45 per cent in 2015-16 due to continuing supply surpluses. The official Wholesale Price Index (WPI) of India for ‘All commodities’ (Base: 2004-05=100) for the month of October, 2016 rose by 0.1 per cent to 182.9 (provisional) from 182.8 (provisional) for the previous month. The annual rate of inflation, based on monthly WPI, stood at 3.39 per cent (provisional ) for the month of October 2016 (over October, 2015) as compared to 3.57 per cent (provisional) for the previous month and -3.70 per cent during the corresponding month of the previous year. Inflation rate in the financial year was 4.34 per cent compared to 0.45 per cent in the corresponding period of the previous year. The average headline inflation measured in terms of Wholesale Price Index (WPI) declined from 6.0 per cent in 2013-14 to 2.0 per cent in 2014-15 and further to -3.0 per cent in 2015-16 (Apr-Dec) and reached -0.7 per cent in December 2015. Similarly, inflation measured in terms of Consumer Price Index (New Series) moderated to 4.8 per cent in 2015-16 (Apr-Dec) as compared to 5.9 per cent in 2014-15 and stood at 5.6 per cent in December 2015. WPI Food inflation which remained high at 9.4 per cent in 2013-14 moderated to 4.9 per cent in 2014-15. It stood at 1.9 per cent in 2015-16 (Apr-Dec) and recorded 6.2 per cent in December 2015.
Inflation based on Consumer Price Index, which remained sticky around 9-10 per cent during 2012-14, moderated to 5.9 per cent in 2014-15 and further to 4.6 per cent in 2015-16 (Apr-Oct). The decline in consumer inflation although broad-based was mainly driven by consistent moderation in food and housing. Inflation based on consumer food price index (CFPI) declined to an all time low of 2.7 per cent in second quarter of 2015-16 mainly on account of huge fall in the prices of cereals, which comprise the highest share (24.8 per cent) within the consumer food basket and vegetables. CPI core inflation (non-food non-fuel) continued to move within a narrow range in the last four quarters.
As far as Primary Articles are concerned, the index declined by 0.8 per cent to 261.8 from 263.9 for the September 2016, especially for food articles like urad, fruits and vegetables, arhar, and bajra. The rate for Non-food Articles also declined by 3.1 per cent to 223.2 from 230.3 for September 2016 due to lower price of soybean, groundnut seed and flowers, raw cotton.
The Kerala Scenario
Kerala is a consumer state, most of the food and non food articles come from the neighbouring states. Price structure of the essential commodities varied according to their availability and demand. Kerala being highly dependent on external sources, price trends in the State are greatly influenced by patterns emerging in rest of the country. The intervention of the State government is restricted to the market for essential goods and services.
Price Trends
In Kerala, prices of food products increased in 2016. In 2011, Wholesale Price Index of rice was 4768.35 and it increased to 6344.85 in August 2016, registering a 33 per cent increase. Wholesale Price Index of fruits and vegetables also increased to 12862.92 in August 2016 from 9831.91 in August 2015. The overall Wholesale Price Index of FoodCrops increased to 8033.23 in August 2016 from 7396.62 in August 2015.
In the case of Non-food Crops, the Wholesale Price Index reduced by 19.2 per cent from 7226.53 in August 2015 to 5841.01 in August 2016. Under this category, prices of oil and oil seeds have fell by 23.8 per cent in August 2016 over the previous year. While analysing the trend in prices of all crops in Kerala, Wholesale Price Index of different crops declined to 7233.07 in August 2016 from 7394.28 in August 2015 (Appendix 1.26). Month-wise Wholesale Price Index reveals that prices of all food crops were rising every month in 2016 at moderate rates. A comprehensive picture of price trends is given in the Appendix 1.27.
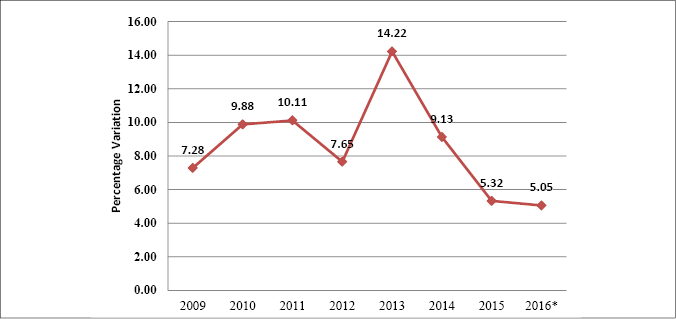
Consumer Price Index (CPI) in Kerala increased considerably during 2016 over the previous years. An overview of trends in consumer price indices and the deviations in average annual inflations at different centres in Kerala reveals that price levels have been rising. In 2016, Average Consumer Price Index in Kerala was 291 against the 277 in 2015. A 5.05 per cent hike has been registered during this period. Pathanamthitta district registered a CPI of 309, the highest among the centres in 2016 and the percentage of inflation was about 4.04 compared to the previous year. Mundakayam and Kasaragod have registered second and third position of CPI at 304 and 303 respectively. However, Kannur and Kozhikode witnessed significantly higher rate of inflation in Kerala at 6.43 per cent and 6.20 per cent respectively. On the other hand, magnitude of inflation in Ernakulam district was relatively low in 2016 compared to rest of the centres in Kerala. Rate of inflation indicated in Ernakulam is only 2.9 per cent. The centre-wise details of Consumer Price Index (CPI) and its percentage variation depicted is in Appendix 1.28. and its State average shown in Figure 1.9.
Figure 1.9
Percentage variation in Average Consumer Price Index of Kerala (1998-99=100), in per cent

Source: Department of Economics and Statistics, Government of Kerala
* Upto August 2016
The retail prices of certain commodities under groceries and vegetables have marginally increased while some others have declined in November 2016 over the previous year. The price of rice per kg has marginally increased to 35.70 in November 2016 from 33.68 over the same month of previous year. The price of red gram also increased to .78.71 per kg in November 2016 over the previous year. The inflationary trend for grocery is not much compared to the previous years. The prices of items under groceries like green gram, green gram dhal, black gram, dhal (tur) have come down from November 2015 to November 2016. In the case of fruits and vegetables, price decreased substantially in 2016 over the previous year. Monthly retail price of essential commodities in 2016 is shown in Appendix 1.29.
Price Parity
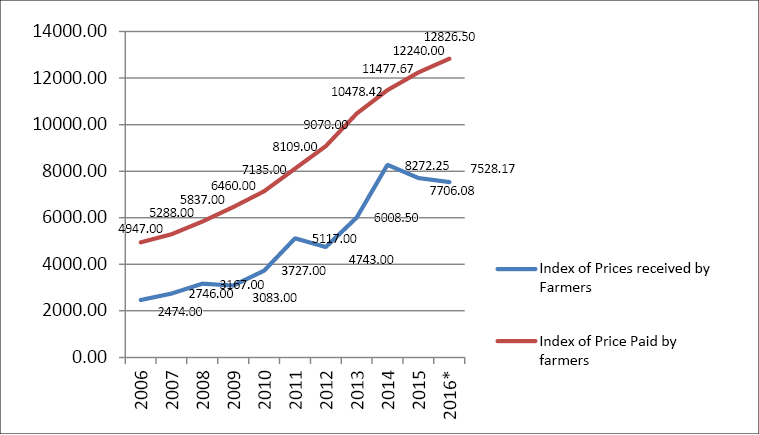
In the recent years, the cost of cultivation of crops has continuously increased due to exorbitant hike in fertilizer cost and transportation cost. In this situation, farmers are suffering more as their products do not get adequate price. During 2014, the index of farm expenses (index of price paid by farmers) was 11477.67 against the index of income received by farmers at 8272.25 and the parity of index was 72.08. During 2015, income of the farmers from their produces diminished considerably to reach 7706.08. Meanwhile, the expenses of farm cultivation steeply increased in the same year. During this year, price received by farmers was estimated at 7528.17 and expenses towards the cultivation were assessed at 12826.5. It reveals increasing misery of farmers suffering from declining product prices and high cost of farm input and high wages. The Yearly Average Index of Prices received and Prices Paid by Farmers is seen in the Appendix 1.30. and Figure 1.10
Figure 1.10
Yearly Average Index of Prices Received and Paid by Farmers in Kerala

Source: Department of Economics and Statistics, Government of Kerala
*Upto June, 2016
Wages
Wage rate of skilled as well as unskilled workers has increased every year in Kerala. Average Daily Wage rates of Skilled Workers in the Agricultural Sector (Appendix 1.31.) increased steeply in 2015-16 over the previous year. In 2013-14, the wage of a carpenter was 644.92 and it increased to 705.08 in 2014-15 and to 746.17 in 2015-16. In the case of Masons too, wages increased substantially since 2004-05. During 2015-16, the wage of a mason was 753.08 against 707.75 in 2014-15. The same phenomenon was seen in the case of wage rates of unskilled workers. Average Daily Wage Rates of Unskilled Workers in the agricultural sector, of both male and female workers, have increased to 586.06 and 422.19 respectively in 2015-16 as against 545.15 and 392.46 in 2014-15. Details of the wage structure of this category are described in Appendix 1.32.

