Foreword
Agriculture and Allied Sectors
Land use Pattern
The total geographical area is classified according to thirteen different uses of land as given in Appendix 2.2, Appendix 2.3 and Figure 2.3. The cultivated area of the state comes to around 67.6 per cent of the total geographical area. Within this, the Net Sown Area accounts for 52 per cent and 16.83 per cent of the cultivated area is sown more than once. More than one-fourth of the area is under forest cover and 11.18 per cent of the area is put to non-agricultural use. On the other hand, there was a 4 per cent increase in the area put to non-agricultural uses and a 7 per cent increase in the land under fallow.
Figure 2.3
Land Use Pattern of Kerala 2015-16
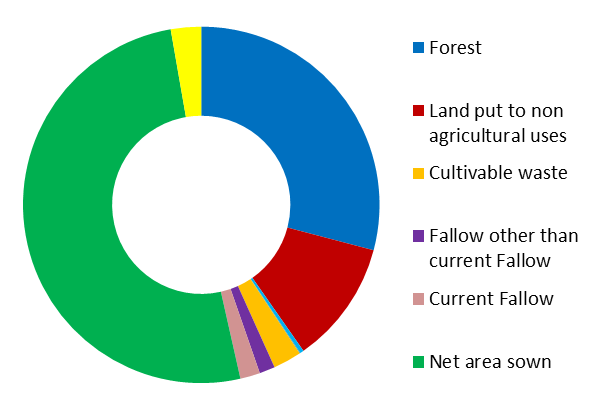
Source: Directorate of Economics and Statistics, Kerala
However, if the total area is further regrouped into two major categories: 'land that is available for cultivation' (including net sown area, cultivable waste, current fallow, fallow other than current fallow and land under miscellaneous tree crops) and 'land not available for cultivation' (which includes land put to non-agricultural use, barren and uncultivable land and permanent pastures and other grazing land besides forest area). In that case it can be seen that land that is available for cultivation comes to 57.9 per cent of the total geographical area. The current Net Sown Area is 52 per cent of the total geographical area. Thus most of the land that is available for cultivation is already under cultivation. Hence the scope of bringing more area under cultivation is marginal and increase in agriculture production can be achieved mainly through increasing the productivity of crops.
Drought Scenario - 2016
Droughts are one of the most disastrous natural hazards; their impacts are cumulative and widespread, affecting ecological and economic systems. Areas affected by droughts are typically larger and its effects are magnified when they occur in consecutive years (see the Handbook of Drought Indicators and Indices, WMO, 2016). The Indian Meteorological Department (IMD), the responsible agency in the country for providing drought forecasting and monitoring, uses various indicators for drought monitoring. Standardized Precipitation Index (SPI) is a widely used indicator. The SPI is negative for drought, and positive for wet conditions. As the dry conditions become more severe, the index becomes more negative and and as the wet conditions become more severe, the index becomes more positive.
IMD statistics for the South-West Monsoon 2016 reveals that the realized rainfall during the monsoon was deficit in Kerala. The report says that “SPI for the cumulative period June to September 2016 indicates extremely/severely/moderately dry conditions over most districts of Kerala”. The area-weighted SPI of Kerala for the South-West Monsoon (2016) season was -1.61, which indicates that the state was severely dry during the period.
The North-East Monsoon, for the period from October 1 to December 31, 2016, in Kerala also recorded 62 per cent deficiency. The all-India figures also show that the area-weighted rainfall during the period was 45 per cent deficient with 69.6 mm actual rains as against the normal of 125.6 mm rains.
With the failure of two monsoons, drought has been declared in all the fourteen districts of the State. There has been an average reduction of 22 per cent in the water storage in the State's dams when compared to the water storage in September of 2015. Agricultural production and electricity generation in the State are highly dependent on the two monsoons. The deficient rainfall in both the monsoon seasons will affect agricultural production and electricity generation adversely and lead to shortage in availability of drinking water.
Cropping Pattern
Cropping pattern in Kerala is dominated by cash crops. Food crops comprising of rice, tapioca and pulses accounted for just 10.21 per cent of the total cultivated area in 2015-16 while cash crops (cashew, rubber, pepper, coconut, cardamom, tea and coffee) constituted 62.8 per cent of the total cultivated area. Plantation crops like rubber, coffee, tea and cardamom accounted for 26.8 per cent of the total cultivated area. Coconut has the largest area under crop cover (30 per cent) followed by rubber (20.9 per cent) and paddy (7.4 per cent). Of the cultivated area, 4.45 per cent is under banana and other plantains. Little more than 2 per cent is under tapioca and just 0.2 per cent is under ginger and turmeric together. In 2015-16, pulses, pepper, ginger, areca nut, cardamom and rubber recorded slight increases in area under cultivation compared to the previous year while all other crops recorded a decline. The area, production and productivity of principal crops is given in Table 2.4.
Table 2.4
Area, Production and Productivity of Principal Crops
| Sl.No. | Crops | Area (Ha.) | Production (T) | Productivity (Kg./Ha.) | |||
| 2014-15 | 2015-16 | 2014-15 | 2015-16 | 2014-15 | 2015-16 | ||
| 1 | Rice | 198159 | 196870 | 562092 | 549275 | 2837 | 2790 |
| 2 | Pulses, including Tur | 3601 | 3764 | 3409 | 4263 | 947 | 1133 |
| 3 | Pepper | 85431 | 85948 | 40690 | 42132 | 476 | 490 |
| 4 | Ginger | 4800 | 4986 | 22989 | 22044 | 4789 | 4421 |
| 5 | Turmeric | 2470 | 2603 | 6820 | 7112 | 2761 | 2732 |
| 6 | Cardamom* | 39730 | 39730 | 16000 | 19500 | 403 | 491 |
| 7 | Areca nut | 96686 | 99126 | 125926 | 132453 | 1302 | 1336 |
| 8 | Banana | 61936 | 59835 | 545431 | 536155 | 8806 | 8961 |
| 9 | Other Plantains | 56761 | 57683 | 468320 | 411626 | 8251 | 7136 |
| 10 | Cashew nut | 45436 | 43090 | 29715 | 24733 | 654 | 574 |
| 11 | Tapioca | 75493 | 69405 | 2943919 | 2662610 | 38996 | 38363 |
| 12 | Coconut** | 793856 | 790223 | 5947 | 5873 | 7491 | 7432 |
| 13 | Coffee*** | 85359 | 84987 | 67700 | 69230 | 793 | 815 |
| 14 | Tea $ | 30205 | 30205 | 65174 | 57898 | 2158 | 1917 |
| 15 | Rubber # | 549955 | 550840 | 507700 | 438630 | 923 | 796 |
Note: **Production of Coconut in Million Nuts, Productivity in numbers.
Source; Directorate of Economics and Statistics, # Rubber Board, *Spices Board.
***Coffee Board, $ Tea Board
Irrigated area
The share of net irrigated area to total cropped area was 15.75 per cent in 2015-16. Thus, only 15.75 percent of the total cropped area was under irrigation cover whereas in states like Punjab, Uttar Pradesh and Tamil Nadu it was more than 50 per cent. The share of gross irrigated area to gross cropped area was 18.4 per cent. Coconut occupied the largest share of the irrigated area (34.25 percent) followed by paddy (31.12 per cent). The The share of other crops were banana (9 per cent), areca nut (7 per cent) and vegetables (8 per cent).