Foreword
Agriculture and Allied Sectors
Crop wise Analysis
Rice
Rice is the most important food crop grown in Kerala. It occupies 7.46 percent of the total cropped area of the state. However, the area under rice has been falling at an alarming rate ever since the 1980s. From 8.82 lakh hectare in 1974-75, the paddy area has come down to 1.96 lakh hectare in 2015-16. The production has also concomitantly declined from 13.76 lakh MT in 1972-73 (peak of production) to 5.49 lakh MT in 2015-16 (Appendix 2.4). Moreover, the productivity of the crop is very low in the State (2790 kg/ha), though it is higher than the national average (2424 kg/ha). There has only been a marginal increase in the productivity of rice in the past four decades. China, which is the major producer of rice in the world, reports a productivity (6744 kg/ha) more than three times the productivity of rice in Kerala. The productivity of rice in Egypt is the highest in the world (9088 kg/ha), which is nearly four-fold of our productivity. Punjab is the state with the highest yield in the country (3952 kg/ha). In the recent months, the State government has taken a number of steps for the promotion of paddy cultivation.
Major initiatives for the promotion of rice in 2016-17
- Promotion of upland rice cultivation in 2520 ha
- Amendment in Paddy land/Wetland Conservation Act
- Cultivation in fallow lands
- Special projects in Aranmula Punja
- Declaring Chingam 1st of 2016 to Chingam 1st of 2017 as the rice year in which 100 activities are planned
- Enhancement of procurement price of paddy from 21.50/Kg to 22.50/Kg
Source: Agriculture Department
There are three main rice growing seasons in the state: (a) Virippu season/Autumn season/First crop season, which starts in April-May and extends up to September-October; (b) Mundakan season/Winter season/Second crop season, which starts in September-October and extends up to December-January; and (c) Puncha season/Summer season/Third crop season, which starts in December-January and extends up to March-April. In Kerala, winter crop (mundakan) has been greater than the other two crops (summer and autumn) both in terms of area as well as production. However, in 2015-16, all the three seasons showed a declining trend resulting in an overall reduction in production(Appendix 2.5).
Palakkad, Alappuzha, Thrissur and Kottayam account for about 81.2 percent of the total production of rice in the state, their individual shares being 41 percent, 16 percent, 14 percent and 9 percent respectively. In 2015-16, Alappuzha and Palakkad recorded a decline in production, while Thrissur and Kottayam recorded a slight increase in production. District-wise area under rice cultivation shows that area under rice fell for all the districts of the State between 1996-97 and 2012-13. However, the decline was sharpest for Ernakulam (93 per cent) followed by Kollam (92 per cent), Thiruvananthapuram (86 per cent) and Malappuram (78 per cent). On the positive side, in Kottayam and Alappuzha, the major rice growing districts, the decline was much less pronounced (13 and 12 per cent respectively). In 2015-16, Palakkad, Alappuzha and Wayanad, showed a decline in area as well as production of rice in the State (Details as given in Appendix 2.6 and Appendix 2.7 and Figure 2.4).
Figure 2.4
Percentage change in area and production of rice in major districts
of Kerala during 2015-16 over 2014-15, in per cent
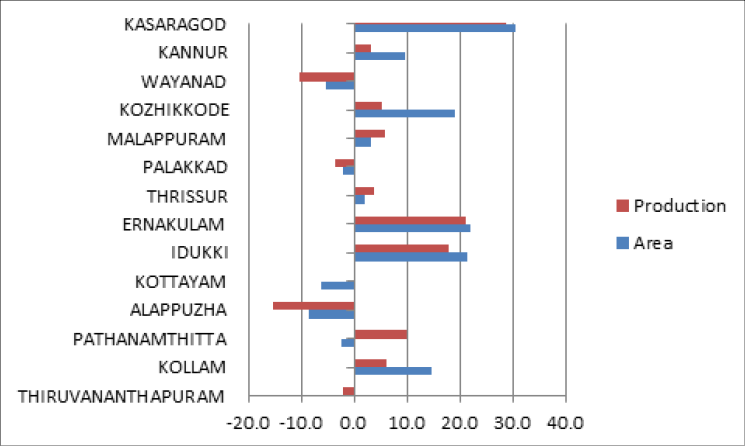
Source: Directorate of Economics and Statistics, Govt. of Kerala
Area cultivated with paddy has increasingly been converted into cultivation with other crops as well as for non-agricultural purposes. This is mainly due to the low relative profitability in paddy cultivation, which in turn is a result of increasing costs due to rising wages and relative price changes in favour of competing crops. In spite of focused interventions through the State plan and programmes like Rashtriya Krishi Vikas Yojana (RKVY), enhancement of per hectare assistance from 1500 to 4500 in the 12th plan period and the introduction of procurement in all districts, rice production has not responded positively. More proactive steps under the leadership of the Department of Agriculture and local bodies are required to revitalise rice production in the State.
Coconut
In terms of area under cultivation, coconut is the most important crop in the state with over 7.9 lakh hectare under cultivation. It accounts for the largest share in the Gross Cropped Area (GCA) followed by rubber and paddy. Kerala has the largest area under the crop in the country, but in terms of production it comes third. This indicates the low productivity of the crop in the state with just 7535 nuts per hectare compared to Tamil Nadu and Andhra Pradesh where the productivity is 14,873 nuts per hectare and 13,808 nuts per hectare respectively in 2014-15. Also, Kerala’s share in area and production of coconut in the country has declined over time. While Kerala accounted for 69.58 per cent of the area and 69.52 per cent of the production in the country in 1960-61, the corresponding shares declined to 40.2 per cent and 42.12 per cent respectively in 2011-12. However, the area and production of coconut in the state has been increasing. From 29.88 per cent of the Net Sown Area in 1980-81, the share of area cultivated with coconut increased to 41.96 per cent in 2000-01; in 2011-12, the corresponding share stood at 40.24 per cent. The production also increased during this period. From 3220 million nuts in 1960-61, the production increased to 5536 million nuts in 2000-01. After that the production plateaued and was more or less stagnant in the next decade. Thus, the increase in output was more on account of increase in acreage as the productivity of the crop is very low in the state. Between 2014-15 and 2015-16, there was a marginal decline in the production of coconut from 5947 million nuts to 5873 million nuts. Area, production and productivity of coconut in Kerala are given in Appendix 2.8
The main reason for the falling productivity of coconut is the prevalence of the root wilt disease, poor crop management and the existence of senile and unproductive palms. Hence, massive replanting of palms affected by root wilt with elite palms and elimination of senile palms, setting up of nurseries for production of quality seedlings and their subsequent distribution is essential for increasing productivity. Restructuring of the cluster development programme is also essential for more effectiveness. The attempt made by the Department of Agriculture and Cooperation to restructure two coconut development programmes through convergence approach at the panchayat level, coupled with a price advantage, is expected to revive coconut production in the state. The isolated attempts at the production of dwarf coconut seedlings and hybrids need to be scaled up substantially with the support of research institutions. Entrepreneurial ventures for the production of value-added products like desiccated coconut, beverages, shell-based products, coconut cream, and neera have to be promoted with appropriate tie-ups with credit and marketing agencies. The coconut procurement system through Krishi Bhavans in association with Kerafed was introduced in 2012-13, which needs further streamlining. The initiative taken by the government in promoting neera and value addition are expected to revive coconut economy of the state.
Pepper
India comes third in the production of pepper in the world after Vietnam and Indonesia. However, the production of pepper in the country has been stagnant at around 50,000 tonnes in the last few years and hence is fast losing its status as a leading producer and exporter of pepper. Grown mostly in the slopes of Western Ghats in Kerala, Karnataka, and Tamil Nadu, the area under cultivation of pepper has come down drastically in the last decade, which has adversely affected production and export. In 2015-16, pepper production recorded a decline to 55,000 tonnes from 70,000 tonnes in 2014-15. However, Kerala, which accounts for 75 percent of the total production in the country, recorded a slight increase in pepper production from 40.6 thousand tonnes in 2014-15 to 42.1 thousand tonnes in 2015-16.
With regard to prices, there has been a rally in pepper prices since 2010. However, in 2015, the prices registered a decline to 630.31 per kg from 646.79 per kg in 2014. The price realization during 2016 (January-June) was 669.29 per kg compared to 619.76 per kg in June 2015, an increase of 49.53 per kg.
Pepper production in the State in recent years has been affected mainly by low productivity and various diseases. In order to revive spices development in the state, the Department of Agriculture had initiated comprehensive pepper development programmes in all districts in 2014-15. An integrated action plan was prepared for the revival of the crop, covering reorientation of planting material production, expansion of grafting wherever possible, area-wide disease management, liming and nutrients management and revival of pepper samities. The increase in production achieved during 2015-16 could be because of this concerted effort by the State Government.
Cashew
In 2015-16, India continued to be the largest producer of raw cashew nuts in the world. The other main producing countries were Vietnam, Brazil, Tanzania and Ivory Coast. The production of raw cashew nuts in India declined from 725 thousand MT in 2014-15 to 670 thousand MT in 2015-16. The area under cashew cultivation, however, recorded an increase from 1027 thousand hectares to 1034 thousand hectares.
In Kerala, in the last one decade, there has been a continuous and considerable decline in both area under cultivation as well as production of cashew. It is alarming to note that the production, which stood at 60 thousand MT in 2004-05, declined to 33.3 thousand MT in 2013-14 and to 24.73 thousand MT in 2015-16. The area under cultivation dwindled from 81,000 hectares to 49,000 hectares and to 43,000 hectares during the same period. The productivity of cashew, which was around 900 kg per hectare during the late eighties, also fell to 654 kg per hectare in 2014-15. Details are given in Appendix 2.9
Area under and production of cashew have risen steadily in other producing states of the country. Even though Andhra Pradesh has the highest area under cultivation (18.3 per cent), Maharashtra is the leading producer with 32.9 percent share in production during 2013-14.
Plantation crops
Plantation crops are, in general, either export-oriented or import-substituting and therefore assume special significance from the national point of view. It is estimated that nearly 14 lakh families are dependent on the plantation sector for livelihood. Each of the four plantation crops of South India has its distinct characteristics and economic problems. Consequent to the removal of quantitative restrictions on imports, plantation crops are facing the threat of a surge in low quality imports.
Kerala has a substantial share in the area in India cultivated with the four plantation crops of rubber, tea, coffee and cardamom. These four crops together occupy 7.04 lakh ha, accounting for 26.88 percent of the gross cropped area in the state. During 2013-14, Kerala’s share in the national production was 72.02 per cent in rubber, 22 per cent in coffee and 6.3 percent in tea. Details are given in Appendix 2.10
Rubber
Production of Natural Rubber (NR) in India declined by 12.9 per cent from 6.45 lakh tones in 2014-15 to 5.62 lakh tonnes in 2015-16. Even though tappable area under natural rubber was 5.59 lakh ha during 2015-16, only 3.91 lakh ha of area contributed to the NR production during the year. Consequently, the average yield, measured in terms of production per hectare of tapped area, declined to 1437 kg/ha in 2015-16 as compared to 1443 kg/ha the previous year. During 2016-17, the production is estimated to be 6.54 lakh tonnes of NR. Adverse weather, high wages, lack of skilled labourers and the grower’s reluctance in harvesting or maintaining trees in response to the low NR prices have affected the production of natural rubber (NR) in India in 2016. The consumption of NR in the country also came down by 2.6 percent to 10.2 lakh tonnes in 2014-15. This was due to a 2.5 percent decline in auto tyre manufacturing and a 2.7 percent fall in the general rubber goods production. The volume of exports came down to 865 tonnes in 2015-16 from 1002 tonnes in 2014-15. The Central Government continued to provide incentives for exporting quality–endorsed branded Indian Natural Rubber under a Market–linked Focus Product Scheme. The production scene was no different in Kerala also, as the total production dwindled from 5.07 lakh MT in 2014-15 to 4.38 lakh MT in 2015-16.
With regard to rubber prices, it has been volatile in both the national and international markets. NR prices after scaling to an all-time high during 2011 had fallen significantly, that too at an accelerating pace threatening the very existence of the rubber producers. Rubber prices , both in the domestic and international markets had been moving in tandem throughout the year. Domestic RRSS-4 and international RSS-3 prices increased from April 2015 to June 2015 and then started decreasing from July 2015 to February 2016 and started slow recovery during the end of the year. Main reasons for the fall in rubber prices were moderate economic growth in China, slow recovery in the US and Europe, enhanced stock in Thailand, increase in world stock of NR, relatively low oil prices and consequent low synthetic rubber prices. The domestic RSS-4 price at Kottayam market came down and averaged at 113.06 per kg during 2015-16 compared to 132.57 per kg during the previous year. Domestic RSS4 price peaked at 133 per kg on 17.06.2015 and international price of RSS-3 peaked at 122 per kg on 03.06.2015. Domestic RSS-4 prices was ruling above the international RSS-3 price throughout the year during 2015-16. Details are given in Appendix 2.11, Appendix 2.12 and Appendix 2.13
The declining rubber production in the year has affected India’s ranking internationally as it has been pushed to the fifth position with countries like Vietnam and China occupying the third and fourth position respectively. Thailand continues to be the top producer followed by Indonesia in the second spot in the global rubber scene.
The declining price of rubber is a cause of concern. A revival of rubber prices is expected based on the revision of import duty and other measures taken by Government of India. However, more proactive measures by the central government are essential to support the rubber growers of Kerala. The strengthening and reorientation of Price Stabilisation Fund is essential. The Government of Kerala has introduced a rubber production incentive scheme with a financial support of Rs 300 crores. However, to a large extent the price depends on global supply and demand of natural rubber and the price of synthetic rubber.
Coffee
Domestic coffee production for the year 2015-16 was estimated at 348,000 tonnes, which represents an increase of 21,000 tonnes compared to previous year. Initially, the Coffee Board had projected 2015-16 crop production (Post Blossom estimate) at 355,000 tonnes, which was subsequently revised downwards by 7,000 tonnes. As per the revised figure, the Arabica production was estimated at 103.5 thousand tonnes (29.7 per cent) and Robusta at 244.5 thousand tonnes (70.3 per cent). However, as per FAO estimates, yield in India at 845.6 kg per hectare is much below that of Vietnam (2499.1 kg per hectare) and Brazil (1421.5 kg per hectare). A comparison of the productivity levels in 1971 vis-a-vis 2011 suggests that India (-1.8 per cent) and Indonesia (-0.1 per cent) are the only two countries that reported a decline in yield levels in the last 40 years. Lower productivity in India is due to limited mechanization, pest infestation, existence of old/senile plants and labour shortage. Thus, on the productivity side, much more is needed to be done and towards this concerted efforts are required both at the policy and farm level. The only way to address this issue is by providing positive research and development which can directly contribute in achieving higher yield.
With regard to Kerala, the production of coffee registered a slight increase from 67,700 MT in 2014-15 to 69,230 MT in 2015-16. The share of Kerala in total coffee production in the country is around 20 per cent during the year. Major variety grown in Kerala is Robusta with a share of 97.1 per cent in planted area. Productivity of the crop in terms of bearing area in Kerala is 808 kg/ha, which is lower than the national level of 852 kg/ha during 2011-12. Among the States, Kerala stands next to Karnataka which produces 70.4 percent of total Indian coffee production.
Tea
As one of the largest tea producing countries, India accounts for 24.8 percent of the total world production. The Tea Board had revised the production figures during 2011 by bringing within the net all segments of tea producers, both organized and unorganized, especially North India many of whom were not reporting their crop statistics earlier, which helped India in breaching the 1 billion mark. The domestic tea production during 2015 was 1191.1mkg lower by 16.2 mkg from previous year. The decline in production in North India and South India was 1.6 mkg and 14.6 mkg respectively. The steep fall in production in south India after a one year reprieve from the low crop trap is a matter of concern.
Kerala accounts for 5.03 per cent of the area and 6.3 percent of the total domestic production of tea in the country. The production of tea in the State has been consistently falling since 2009-10. There was a slight improvement in 2012-13 as tea production recorded an increase of 5059 MT despite a decline in area of 18 per cent. This increase in production was mainly on account of increase in productivity. Tea production recorded an increase of 3.5 per cent in 2014-15 also but in 2015-16 there was a decline in production by 11.16 percent. Details given in Appendix 2.14
The major issues affecting the tea industry are stagnant productivity, acute labour shortage, high cost of machines, and lack of indigenous machinery.
Cardamom
India is the second largest producer of small cardamom and plays an important role in the international trade of cardamom. The output of cardamom is dependent on prevailing climatic conditions as the cardamom plant requires intermittent spells of rains and good sunshine during the growth stage. Cardamom production in the country during 2015-16 was estimated at 22 thousand tonnes compared to 18 thousand tonnes in 2014-15, an increase of 4 thousand tonnes. The turnaround in cardamom prices since 2006-07 continued up to 2010-11 reaching the highest level, but thereafter the prices have fluctuated. During 2015-16 (August-June), the prices increased by 107.33 per kg to reach 754.00 per kg.
Meanwhile in Kerala, cardamom production has increased by 21.8 per cent in 2015-16 despite the area under cultivation remaining stagnant.
Pulses
The year 2016 was the International Year of Pulses. Pulses are important source of protein, high in fibre content and provide ample quantity of vitamins and minerals. Keeping in view large benefits of pulses for human health, the United Nations proclaimed 2016 as the International Year of Pulses. Thus, due attention is required to enhance the production of pulses not only to meet the dietary requirement of protein but also to raise the awareness about pulses for achieving nutritional, food security and environmental sustainability. Pulses are important component to sustain the agriculture production as the crops posses wide adaptability to fit into various cropping systems and improves the soil fertility.
India's share is 25 per cent in production, about 33 per cent in acreage and about 27 per cent in consumption of the total pulses in the world. The acreage ranged from 20.35 million ha (2000-01) to 23.99 million ha (2012-13) and production varied from 11.08 million tonnes (2000-01) to 18.45 million tonnes (2012-13). The productivity has increased from 544 kg/ha (2000-01) to 750 kg/ha (2012-13). The major pulses producing states are Madhya Pradesh (25 per cent), Uttar Pradesh (13 per cent), Maharashtra (12 per cent), Rajasthan (11 per cent), Andhra Pradesh (9 per cent) and other states together (30 per cent) during 2012-13.
In Kerala, pulses are cultivated in autumn, winter and summer seasons. The area under the cultivation of pulses shows a declining trend in the state. During 1975-76, the total area under pulses including tur was 37,485 ha but by 2015-16 it has come down to 3764 ha. Apart from tur, the other main pulses grown in Kerala are cow pea, black gram horse gram and green gram. Major cultivation of pulses and tur is in Palakkad district and contributes to 30 per cent of the total production in the State. The production of pulses in the State was highest during the year 2005-06. More proactive steps are needed to augment pulse production in the State. Details pertaining to the sector is given in Appendix 2.15 and Appendix 2.16
Collective farming through Kudumbashree
Collective farming is an important area of Kudumbasree, which aims at food security both at household and community level. The major crops cultivated are paddy, vegetables, banana, pineapple and tubers. In 2013-14, area brought under cultivation of paddy was 15078.60 ha, of vegetables was 12555.60 ha and of other crops (banana, pineapple and tubers) was 22476.20 ha. Details of area covered are given in Appendix 2.17. More hand holding including facilitation with banks and technology support are essential for improving livelihood of the women groups involved in farming.
Key initiatives of the Department of Agriculture
The annual plan schemes for 2016-17 were formulated focusing on the thrust areas and strategies for increasing the productivity in agriculture from the current levels. The key initiatives taken by the Department of Agriculture in 2016-17 for the improvement of agricultural sector included integrated food crop production programme focusing on self- sufficiency in vegetable production including comprehensive rice development, modernization of existing farms and labs and establishment of new labs, institutional mechanism for marketing, focusing initially on vegetables development of farmers markets and setting up of agriculture markets, production and distribution of quality planting materials, comprehensive fallow land cultivation with people's participation, strengthening extension activities, Agricultural Technology Management Agency (ATMA) plus model of extension, rejuvenation of spices economy, crop health management covering pests and disease surveillance, promotion of organic farming and safe food production, crop insurance, establishment of 20 Agro Service Centres (ASCs) and strengthening the existing ASCs for improved service delivery, revival package for pepper in Wayanad. In 2016-17, the Harithakeralam Mission has been launched focusing on food crop production, waste management and water resource conservation and development.
Performance of Annual Plan, 2015-16 of Department of Agriculture
During the Annual Plan 2015-16, out of 474.93 crore earmarked for the Department of Agriculture under the state plan, the expenditure incurred was 449.14 crore (95 per cent) including Wayanad package. The key achievements of the Department of Agriculture in 2015-16 were the following.
- For rice development, assistance was given to padasekhara samithies for sustaining rice cultivation in 1.79 lakh ha through group farming and for speciality rice cultivation in 890 ha.
- For coconut development, the Department established 10 coconut nurseries and 474 organic manure production units, supported 26 Keragramams covering 12.300ha, distributed 2600 climbing devices and installed irrigation units in 656ha. A total of 4.64 lakh nos. of coconut seedlings and 4.43 lakh coconut plants, covering 2.50 lakh WCT, 1.34 lakh of Dwarf, 34,833 Number of TxD and 23,882 DxT coconut plants were produced.
- For vegetable development, the student community was mobilized and vegetable cultivation was carried out in 5592 educational institutions, project based cultivation in 334 institutions and 62 lakhs seed kits and 31,654 grow bags were distributed. The department supported 800 clusters including 50 new clusters and staggered clusters in 3904 ha and fallow land cultivation was undertaken in 402ha. Around 16 block level nurseries and 3 block level Federated Organisations was established for the marketing and input support of vegetables.
- The department carried out micro nutrient demonstration in 237 plots.
- Assistance provided for micro irrigation with fertigation in 905 units and rain shelter cultivation in 1117 units.
- For pepper development, 38 lakh numbers disease free rooted pepper cuttings were produced for distribution to farmers, new pepper garden was established in 3000 ha, good management practices adopted in 2500 ha and support given for the maintenance of 20 ha of mother pepper gardens and for strengthening 200 pepper development samithies. Further, 32 plant clinics and 3396 pest surveillance units were set up and around 1132 campaigns were conducted.
- 25 onfarm production units of trichoderma, 8 Farmer field schools and 8 Field level demonstrations were established and 1014 soil test campaigns and soil testing training to 350 farmer groups were conducted.
- Introduced soil health card monitoring system, and supplied soil ameliorants in 41,345 ha.
- The department during this year for improved service delivery established 15 Agro service centres and provided maintenance support to 49 agro service centres.
- 708 school biogas plants were installed.
- Under state crop insurance scheme, 1.46 lakh farmers were enrolled and an amount of 256.88 lakhs disbursed towards claim amount for 4324 farmers.
State Horticulture Mission (SHM)
The State Horticulture Mission was formed in 2005 to implement the programme of the National Horticulture Mission, a centrally sponsored scheme, with 85 per cent central share and 15 per cent state share which has been restructured as the Mission for Integrated Development of Horticulture from 2014-15 onwards. During 2015-16, Government of India (GoI) has changed the sharing pattern of the scheme as 60 per cent central share and 40 per cent state share. The main objective of the mission is a holistic development of the horticulture sector covering fruits, plantation crops, spices, flowers, aromatic and medicinal plants and mushroom. The important programmes under the mission include production and productivity improvement, post-harvest management and marketing.
During 2012-13 to 2016-17 (as on 30.09.2016), a total amount of 169.83 crore was released to SHM including 140 crore from GoI and 29.83 crore from state share. The total expenditure incurred is 176.39 crore including unspent balance of previous year. An amount of 30.21 crore was released to SHM during 2015-16 including .25.00 crore from GoI. The total expenditure was 45.42 crore. The components undertaken in this mission include establishment of nurseries for production and distribution of quality seeds and planting material, establishment of new gardens, establishment of integrated pack houses, sorting and grading units, cold storage units, establishment of rural markets, strengthening wholesale markets, market intelligence, extension quality awareness and market led extension activities for fresh and processed foods.
A project monitoring system has to be evolved for realizing the envisaged outputs. A number of NGOs as well as private sector are also part of the project and their activities in achieving the intended objectives of the missionneeds to be monitored. More convergence of schemes with state plan and RKVY with deliverables are required for improved outputs.
Vegetable and Fruit Promotion Council's Programme (VFPCK)
Vegetable and Fruit Promotion Council, Kerala (VFPCK) formed in 2001, has been implementing various schemes in fruits and vegetable sector with the financial assistance from state and central Governments. The major activities of the council are formation of Self Help Groups (SHGs), awareness creation on Participatory Guarantee System (PGS), dissemination of Participatory Technology Development, campaigns/training/capacity building programmes, production of quality seeds and planting materials, participatory credit and insurance support, group marketing and Haritha nagari programmes for the promotion of vegetable cultivation in urban areas.
During 2015-16, the council had inducted 6264 farmers and formed 220 new SHG’s for the promotion of fruits and vegetables. Now the council has a total of 1,85,437 registered farmers in 9434 Self Help Groups. The council had initiated 4 new farmer markets and 12 collection centres during 2015-16. Now there are 274 Swasraya Karshaka Samithies and 167 collection centres under the purview of the council. During 2015-16, 1,02,467 MT of fruits and vegetables worth 230 crore were traded through swasraya karshaka samithies of the council and a trading of 83,473 MT worth 180 crore has been traded upto September 2016. Ready to cook vegetables were made available in packets to public through cut vegetable scheme implemented in Thiruvananthapuram, Ernakulam, Calicut and Pathanamthitta districts. Around 65.15 lakh vegetable seedlings, 5.57 lakh tissue culture banana plants and 9 lakhs fruit plant grafts were produced and distributed throughout the state to promote homestead cultivation. An amount of 70.06 crore was disbursed as agriculture loan to 9187 farmers. A total of 25.11 lakh banana plants and 800 ha of vegetables were covered under crop insurance and an amount of 69.31 lakhs was disbursed to farmers as claim.
During 2015-16, farmers of the council had cultivated vegetables in 18,290 ha, banana in 23,400 ha and tuber crops in 3264 ha during the period. Total production during the period was 1.84 lakh MT vegetables, 2.81 lakh MT banana and 37,339 MT of tubers. It is seen that even though the area of banana increased by 712 ha during 2015-16, compared to previous year, production decreased by 13,000 MT. During 2015-16, the area and production of vegetables decreased by 1923 ha and 38,000 MT. The area as well as production of tubers increased during the period compared to 2014-15.
For popularising vegetable and fruit production and area expansion of vegetables under PGS, 175 groups have been formed with 1200 farmers. Agro meteorological data have been collected from 26 Automatic weather stations installed in different parts of the state with the participation of farmers. As part of vegetable development programme for the promotion of homestead vegetable cultivation, 25 bags each planted with saplings were distributed to 5853 beneficiaries. VFPCK has been appointed as the regional council for Participation Guarantee System (PGS) organic certification for fruits and vegetables in Kerala. Awareness creation of PGS to promote organic farming was undertaken and 200 local groups were formed which include 1500 farmers and 1000 acres of cultivation brought under the same during the period. 20 demonstrations were conducted based on soil test results. Krishi Business Kendra has been initiated in Kasargode and Thiruvananthapuram districts. The construction of soil testing lab at Thiruvali in Malappuram district has been initiated and the soil testing lab at Thuravoor in Alappuzha district is nearing completion.
Rashtriya Krishi Vikas Yojana (RKVY)
In order to incentivize States to draw up comprehensive plans for their agricultural sector, taking into account the agro climatic conditions, natural resource issues and technology and by integrating livestock, poultry and fisheries, a special additional central assistance scheme was launched during 2007-08. During XI-th plan, GOI had released a total amount of 22,408.76 crore to states of which 21586.6 crore was utilized in implementing 5768 projects under crop development, horticulture, agriculture mechanization, natural resource management, marketing and post-harvest management, animal husbandry, dairy development, fisheries, extension etc. The scheme was implemented as 100 per cent centrally assisted scheme till 2014-15.From 2015-16 onwards the sharing pattern has been changed as 60:40 between GoI and GoK
During 2007-08 to 2015-16, a total number of 1216 projects with an outlay of 1876.94 crore had been approved in the state under the scheme. Out of this 1001 projects were completed. A total amount of 1489.68 crore was released by GoI upto 2015-16 and an amount of 1424.61 crore (96 per cent) was utilized. During 2015-16 against the budgeted outlay of 321.40 crore, 150.79 crore was released by GoI of which 100 crore (66 per cent) was utilised upto March 2016.
A number of small schemes are included for assistance under RKVY in the state like adoption of naturally ventilated greenhouse technology, adoption of precision farming technology, establishment of mushroom cultivation units, popularization of temperate fruit crops in Idukki district, and development of cool season vegetables in Kanthaloor and Vattavada. . More focused areas with larger projects have to be identified for support under RKVY. More integration is required between RKVY and the state plan. Details are given in Appendix 2.18
Major programmes during 2015-16
Vegetable Development Scheme
A new approach and strategy for the development of vegetables was introduced in the 12th five year plan. Accordingly, a major project on vegetable development was prepared by the Department of Agriculture during 2012-13 with a mission mode approach and a multi-pronged strategy covering an integrated approach with specified physical targets at Gram Panchayath level. The project aimed at promoting sustainability in vegetable area and production and safe to eat concept by advocating an integrated nutrient management and pest management principles of cultivation. During 2015-16 against the outlay of 64 crore, the amount utilized was 54.75.crore (86 per cent). In 2016-17 for vegetable development 68.30 crore was provided and the expenditure incurred upto October 2016 has been 10.28 crore(15 per cent).
Support to State Extension Programme
The Lead Farmer Centred Extension and Advisory Delivery Services (LEADS), a new field visit oriented extension system in the State with appropriate linkage with RandD institutions, KAU and KVKs, was introduced in 4 districts of the State - Kollam, Kannur, Palakkad and Wayanad. 798 Lead farmers and Satellite farmers were formed for advisory services under the programme. During 2015-16, extension activities carried out through ATMA which includes 456 farm schools, 1520 demonstrations, 250 farmer field schools, and 25 integrated farming system models.
ATMA plus model of extension system was introduced by integrating ATMA, LEADS and new initiatives identified through Strategic Research and Extension Plan (SREP). Promotion of integrated farming systems, farmer technology development, preparation of success stories, and identification of research issues were introduced. Model Panchayat Extension Plan was prepared for 14 Grama Panchayats and farmer extension organization was established in 14 blocks. Preparation of Monthly Technology Advice was streamlined in 14 districts. District and state level awards in excellence in extension was provided for outstanding technical officers with certificate and cash award at State level and district level. In order to strengthen ATMA model of extension, new components under ATMA plus were introduced. All extension scheme components under ATMA Plus needs to be implemented with more convergence of schemes under Animal Husbandry, Dairy and Fisheries.
Crop Insurance Schemes
During 2015-16, 1.46 lakh farmers were enrolled under the state crop insurance scheme and an amount of 256.88 lakhs disbursed towards claim amount for 4324 farmers insured under the scheme. Under Modified National Agricultural Insurance Scheme (MNAIS) covering paddy, banana, plantain and tapioca, around 16650 farmers were insured and a compensation of 1.19 crore were distributed to 2538 beneficiaries. The Weather Based Crop Insurance Scheme (WBCIS) was notified in 12 districts covering 12 crops (paddy, banana, ginger, turmeric, pineapple, arecanut, cardamom, pepper, nutmeg, sugarcane, mango and cashew). Under WBCIS, around 34,800 farmers were enrolled covering an area of 26799 ha and a total claim of 12.82 crore were settled to 33270 beneficiaries during the period.
The Coconut Palm Insurance Scheme (CPIS) is being implemented in all districts and a total claim of 75 lakhs was settled among 1453 insured farmers. The farmers pay 25 per cent of the premium and the rest is subsidized by Coconut Development Board (50 per cent) and the state government (25 per cent) under the scheme. The other insurance programmes implemented through Agriculture Insurance Company are Rubber Plantation Insurance (RPI) and Rainfall Insurance Scheme for Coffee (RISC). Under Rubber Plantation Insurance scheme around Rs 40 lakhs paid as compensation for 119 farmers towards insurance cover against the loss of trees due to insured perils. The Rainfall Insurance Scheme for Coffee (RISC) is jointly promoted by Agriculture Insurance Company and Coffee Board and the Coffee Board provides 50 per cent subsidy upto 10 ha. The scheme is being implemented in Idukki, Wayanad and Palakkad districts and provides insurance cover for deficit in blossom and back up showers and excess in monsoon and post monsoon rains.
Organic Farming
Organic farming is an emerging area in the country and the export potential of organic products is increasing across the world. According to the latest statistics (FiBL-IFOAM survey) on certified organic agriculture worldwide, in 2014 around 43.7 million hectares of agriculture land, including conversion areas is being certified as organic in 172 countries, constituting 1 per cent of the total agricultural land of the countries, which is 0.6 million ha more than 2013. 11 countries have more than 10 per cent organic agriculture land. The countries with the most organic agricultural land are Australia (17.2 million ha), Argentina (3.1 million ha) and United States (2.2 million ha). The area under organic certification (including wild harvest) in India increased by 9.9 lakh ha during 2015-16 and reached 5.71 million ha from 4.72 million ha in 2013-14, which includes 26 per cent cultivable area and rest 74 per cent forest and wild area. The States occupying top position with respect to area under organic certification are Madhya Pradesh, Himachal Pradesh and Rajasthan. India produced around 1.35 million MT (2015-16) of certified organic products which includes all varieties of food products namely Sugarcane, Oil Seeds, Cereals and Millets, Cotton, Pulses, Medicinal Plants, Tea, Fruits, Spices, Dry Fruits, Vegetables, and Coffee. The production is not limited to the edible sector but also organic cotton fibre and functional food products .
Organic farming policy, strategy and detailed action plan for Kerala was declared during 2010. The Department of Agriculture has been implementing a comprehensive project on organic farming in Kasargode district and it is envisaged to cover potential areas in other districts. Under this programme, 100 vermi compost units, 625 rural compost units, 30 demonstration plots and 42 ecoshops in 13 districts were established. Also the existing 200 clusters were strengthened and 50 new clusters formed. During 2015-16, 339 vermi compost units have been established under organic farming by the State Horticulture Mission and an area of 3000 ha has been brought under organic certification.
A comprehensive assessment of the impact of interventions in organic farming on the farmer's well-being, economy and environment in the state as envisaged in the organic farming policy (2010) is required to reorient the strategies and to evolve suitable action plan for promoting organic farming in the state. Strengthening of participatory guarantee system, good agriculture practices, quality control laboratories and other certification and incentive system are also to be worked out to promote organic and nature friendly farming in the state.
The details of consumption of fertilisers and average price of inputs are given in Appendix 2.19 and Appendix 2.20. The selected indicators of agricultural development is given in Appendix 2.21.
Crop Health Management
A new approach on Crop Health management was initiated during 2013-14 to bring together management of sustainable ecosystems and people’s health through good plant protection practices (GPPP). Development of pests and disease surveillance system, implementation of area wide integrated pests management demonstration, establishment of plant health clinics and bio control labs, and development of parasite breeding stations are the major components of the scheme. Under the scheme during 2015-16, 3396 pest surveillance units were started and reports updated online by IIITMK, 32 plant health clinics have been established, 1132 awareness campaigns and workshops including rodent control campaign have been conducted. District Diagnostic team was constituted as part of pest and disease surveillance project. A PG Diploma programme on plant health management has been initiated for the technical officers of the Department of Agriculture in collaboration with the National Institute of Plant Health Management, Hyderabad. During 2013-14 to 2015-16, out of the 93 officers enrolled in the course, 28 officers have completed the course and awarded the degree. . District level as well as plant clinic level pest news bulletin were also published on monthly and fortnightly basis.
Agro Service Centers
Agro service centres (ASC) are established at block level to facilitate integration of services like mechanisation, ATMA based extension, credit support, weather advisory services, soil testing support and other technology based services. At present there are 64 agro service centres functioning in the state including 15 ASCs established during 2015-16. During 2015-16, 27.65 crore was budgeted of which an amount of 13.35 crore was utilized upto March 2016. The achievements during 2015-16 include establishment of 15 new ASCs, bio pharmacies in 14 ASCs, nurseries in 16 ASCs, soil testing labs at 4 ASCs and maintenance support to the existing 49 ASCs. It is proposed to strengthen agro service centres by constituting an apex body for co-ordination.
Livestock is a major source of livelihood for the World’s
poor. It is an integral part of India’s agricultural economy
and plays a multifaceted role in providing livelihood support
to the rural population. Livestock sector apart from
contributing to national economy in general and to agricultural
economy in particular, also provides employment opportunities,
asset creation, coping mechanism against crop failure and social
and financial security. Livestock is the main source of animal
protein for the population. Small and marginal farmers and landless
labourers own majority of the livestock resources. Also sustainable
development of the livestock sector would lead to more inclusive
development and empowerment of women. Livestock sector contributed
3.03 percentage of the Gross State Value Added (GSVA) and 29.18
percentage of the GSVA in Agriculture and Allied activities during
2015-16 (at constant price with base year 2011-12).