Foreword
Social Service
Drinking Water
Water is inextricably linked to the development of all societies and cultures. At the same time, this development also places considerable pressure on water resources. These are critical to the survival of people on the planet. The World Water Development Report 2015 says that around 748 million people today still do not have access to an improved source of drinking water. The complexity of linkage between water and development provide us to rethink the present development challenges through the lens of water scarcity. The availability of fresh water resources on the earth has remained same but the gap between supply and demand of fresh water has increased over the years. The world is going to face the problem of global water deficit in the near future unless we could restore the balance between demand and limited supply of drinking water. The progress in social, economic and environmental dimensions of sustainable development is bound by the limits imposed by and the management of water resources.
Kerala is considered as the land of water resources with high rainfall, rivers, backwaters, lakes and many streams. However, Kerala is frequently facing drought and acute water scarcity in many districts.
Water Resource
Kerala has 41 west-flowing and 3 east-flowing rivers originating in the Western Ghats. When compared to rivers in the other parts of the nation, the significance of rivers in terms of water discharge is very minimal. There are only medium (4) and minor (40) rivers in Kerala.The State doesn’t have a single major river as per the national norms. Kerala is also bestowed with a number of lakes and backwater lagoons.
Kerala receives two monsoons every year. Due to the physiographical pattern of Kerala, the water drains very fast into the sea. The average rainfall of the State is 3055 mm, which is 2 times more than that of national average. In Kerala, 69 per cent of the annual rainfall is received during the Southwest monsoon (June to September), 16 per cent during Northeast monsoon (October to December) and the remaining as summer rains. The rain received during the year 2016 monsoon is far below the normal rainfall. The deficiency of rainfall during monsoon is more in the district of Wayanad (59 per cent), which is higher than the State average deficiency (34 per cent) during 2016. The occurrence of rainfall is termed as normal if its deviation is between plus or minus 19 percentage of the normal rainfall. The district wise percentage deviation of rainfall in Kerala shows high temporal variations in the distribution, which is shown in Table (4.20). Due to the deficiency in rains, the State has been declared as drought affected. Shortage of drinking water is a serious issue in many parts of the State. Since the prime source of all our water sources is rainfall, the deficit in occurrence of rainfall will affect the drinking water potential of the State. The reduction in number of rainy days and change in untimely rainfall pattern also causes undue strain on an agrarian society, which inturn affects the food security also. Along with surface water, groundwater is also an important source of water supply for various uses in the State. Groundwater is extracted through open dug wells, bore wells and tube wells for different needs of the society. Increasing population, rapid urbanization and industrialization has resulted in increasing use of groundwater resources over the last few decades in the State. The occurrence and availability of groundwater vary from place to place within the State depending on the prevailing climate, geomorphologic and hydrogeological conditions. The net groundwater availability of the entire State was calculated as 6.07 billion cubic meters (bcm) by deducting unaccounted losses and natural discharge during the non monsoon season from the Total Annual Recharge available. The annual groundwater draft and net groundwater availability for future irrigation development of the State was calculated as 2.84 bcm and 3.07 bcm respectively. The blocks in the State were considered as assessment units based on the availability of groundwater for future use, stage of development and long term groundwater level trends. As per the Ground water Estimation Committee Report March 2011, out of 152 assessed units in the State, Chittur block in Palakkad District has been categorized as over-exploited (stage of groundwater development>100 per cent), Malampuzha block of Palakkad District and Kasaragod block of Kasaragod District have been categorized as critical (stage of groundwater development>90 per cent and<=100 per cent) and 23 block as semi critical(stage of groundwater development>70 per cent and <=90 per cent)and the remaining 126 blocks as safe(stage of groundwater development<=70 per cent).
Table 4.20
District wise Pattern and Occurrence of Rainfall (Per cent Departure) from October 2015 to September 2016
| DISTRICTS | Northeast Monsoon (Oct to Dec 2015) | Winter rainfall (Jan to Feb 2016) | Pre-monsoon rainfall | Basin covered |
| Kerala | 27 | -21 | -18 | -34 |
| Thiruvananthapuram | 51 | -83 | 37 | -34 |
| Kollam | 19 | 0 | 7 | -29 |
| Pathanamthitta | 53 | -92 | 11 | -36 |
| Alappuzha | 20 | 28 | -23 | -35 |
| Kottayam | 35 | 45 | -3 | -30 |
| Idukki | 12 | -71 | -16 | -31 |
| Ernakulam | 75 | 187 | -17 | -24 |
| Thrissur | 18 | 37 | -22 | -45 |
| Palakkad | -14 | -98 | -37 | -34 |
| Malappuram | 25 | -68 | -50 | -39 |
| Kozhikode | 32 | -100 | -16 | -27 |
| Wayanad | -9 | -75 | -47 | -59 |
| Kannur | 53 | -100 | -53 | -25 |
| Kasargod | 21 | 3 | -49 | -25 |
Source: Meteorological Centre, Thiruvananthapuram
The issues related to the ground water in the state are source as well as resource related. It is highly considered to be location specific. The steep sloping terrain conducts all rain water swiftly (within 48 hrs) to Arabian Sea giving limited chance for percolation and augmentation of ground water.
Availability of Drinking Water
As per NSSO 69th round, 85.8 per cent households in rural India and 89.6 percent households in urban India, have sufficient drinking water. Among the States, Uttar Pradesh (97.1 per cent) has the highest proportion of households and Jharkhand has the lowest (70.3 per cent) proportion with sufficient drinking water. Among the major States of India, Punjab has the highest percentage of improved source of drinking water both in rural (99.5 per cent) and urban (99.7 per cent) areas. Kerala stands at the bottom of the table with lowest percentage in rural (29.5 per cent) and urban (56.8 per cent) areas (Appendix 4.73). The district wise analysis of drinking water availability based on location is given in the Appendix 4.74.
Kerala has a coastal belt of 570 km, which covers 15 per cent of the total area of the State. Majority of drinking water sources in our state are getting polluted due to unscientific sanitation practices and indiscriminate dumping of waste. A large majority of drinking water supply sources are bacteriologically and chemically contaminated. The main bacteriological pathogens are E coli and coliform. The district wise quality profile of drinking water in Kerala during 2015-16 is given in Appendix 4.75.
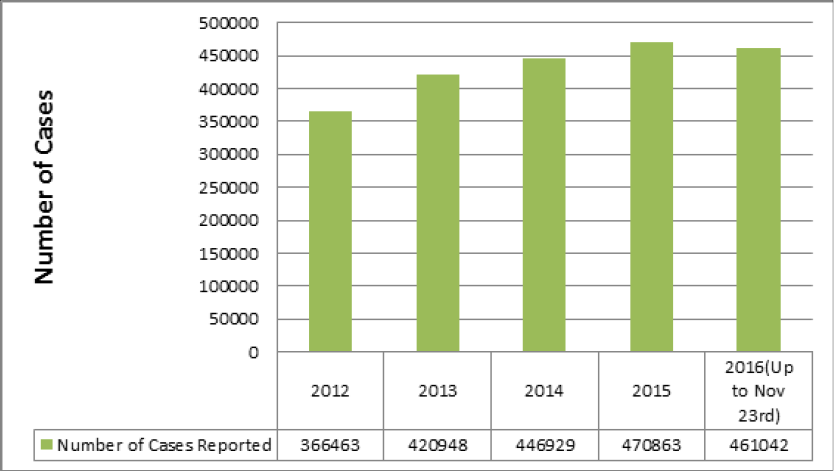
The use of polluted water causes several water borne diseases, which may be fatal. The data on the number of water borne diseases shows an increasing tendency over the years. The reported cases during 2012 were 3,66,463 which increased to 4,61,042 in 2016 (Figure 4.8). The population density, indiscriminate use and pollution results in increasing number of waterborne diseases. The detailed data on waterborne diseases is given in Appendix 4.76.
Figure 4. 8
Number of Waterborne Diseases Reported in Kerala
Source: Directorate of Health Services
Coverage
Providing quality drinking water to all segments of the society is a major challenge in water supply sector. There are mainly two agencies viz. KWA and KRWSA (Jalanidhi) involved in the distribution of drinking water in Kerala. KWA is implementing major schemes and mainly focused in Urban Water Supply, while Jalanidhi concentrates on small Rural Water Supply Schemes. The KWA has three regional offices, 15 circles, 51 Divisions, 136 Sub Divisions and 293 Sections spread across Kerala.
There are 1,078 water supply schemes of KWA in operation as on March 31, 2016, with a total installed capacity of 3367.13 mld, which means the average percapita availability of piped water is 100.79 litres per day. The targeted average lpcd (litre percapita per day) in rural area is 100 lpcd and that of urban is 150 lpcd. However the lpcd varies in different habitations in the all districts. As per Integrated Management Information System (IMIS) data, out of 11883 rural habitations, 938 partially covered habitations were converted to fully covered habitations in financial year 2015-16 with piped water supply by commissioning the schemes in the area. Also the total number of quality affected habitations has reduced from 751 to 656 habitations during the same period. The existing average lpcd, computed based on production capacity, in the districts by existing schemes are given in Appendix 4.77. But even after accounting for the high percentage of Non-revenue water, the per capita availability is much less and also the schemes are mostly located in urban areas. The number of beneficiaries from all the drinking water supply schemes implemented so far by KWA is 16627740. The district wise details shows that the percentage share of beneficiaries is highest in Ernakulam (16.64 per cent) district and the lowest in Kasaragod district (1.14 per cent). The district wise detail of beneficiaries as on October 31, 2016 is shown in the Figure 4.9.
Figure 4.9
District wise Number of Beneficieries from Drinking Water Schemes of KWA
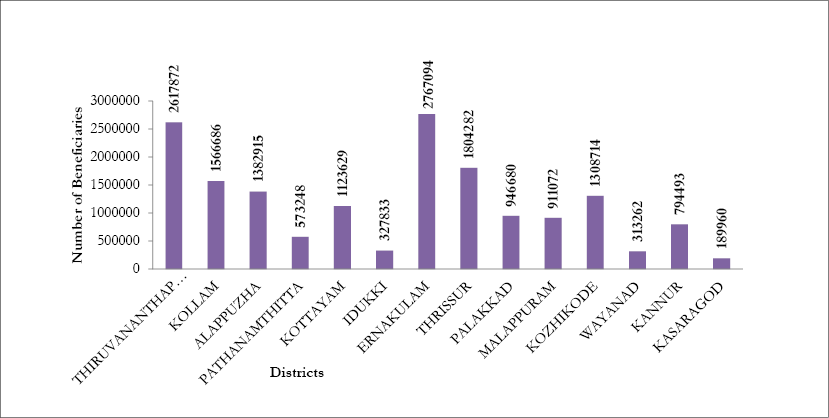
Source: Kerala Water Authority, 2016
Water Supply schemes of Kerala Water Authority covers around 1.75 crore population which accounts for 52.30 per cent of the population. The district wise analysis shows that Ernakulam district has the highest coverage (81.57 per cent) followed by Thiruvananthapuram (71.87 per cent). The district of Kasaragod has the least coverage by water supply schemes of KWA, which is only 19.33 per cent (see Appendix 4.78). The total water supply schemes of KWA in operation as on March 31, 2016 in the State is 1078, of which, 1029 are Rural and 49 are Urban Water supply Schemes. As per the data, the district of Thrissur has107 water supply schemes followed by Thiruvananthapuram (104). The least covered areas under water supply schemes of KWA is Wayanad (see Appendix 4.79). KWA has a total of 18,12,528 water supply connections in the State, which constitute 93.61 per cent domestic and 6.31 per cent non-domestic water supply connection. The water connection for industrial use is only 0.08 per cent. The total street taps as per the data is 2,08,034, out of which 1,62,568 are in Panchayats and 18,131 and 27,335 in Corporations and Municipalities respectively (see Appendix 4.80).
A study by Centre for Water Resources Development and Management Kozhikode in 2013 in selected areas of Calicut Corporation reveals that irrespective of the high levels of sanitation coverage the bacterial contamination in drinking water sources is high. The important findings of the study is that majority of water samples collected from open wells of Calicut Corporation area is bacteriological contaminated and the contamination is mainly of fecal origin. E-coli were present in majority of the samples, and high level of fecal streptococcus present in the wells of polluted areas. The study is a pointer for the state to look into the issues prevailing in the sector. The important factors that can be attributed to the situation are wrong positioning of well and toilets without considering the distance and gradient, direct discharge of toilet waste into canals and water bodies in high water table and low lying areas, insanitary toilets due to damage of digester part sewage from flats, hospitals, commercial complexes reaching water sources directly . The coverage of sewerage shows that the Thiruvananthapuram city has only 37 per cent coverage with about 90,000 connections and it is only 1000 connections in Ernkulam district.
Working Group on Drinking Water and Sewerage
As part of the 13th five year plan, a working group has been constituted on Drinking Water and Sewerage by Kerala State Planning Board with Sri. V.J Kurian IAS, Addl. Chief Secretary, Department of Water Resources as Co-chairperson. The committee was asked to look specifically into the identification and formulation of set of output and outcome indicators for the sector, location specific needs and remedies, setting up of criteria for rain water harvesting and ground water recharge and the preparation of scientifically verified data base to make it accessible to every person.
Save water! Save life!
Kerala has been facing severe drought for the last several years primarily due to rainfall deficiency. There are three types of droughts classified by scientific community and they are meteorological, hydrological and agricultural. Kerala is presently in the transition stage of meteorological to hydrological and agricultural drought, where water stress and crop drying is reported from selected highly drought susceptible parts of the State. Drought in Kerala principally relates to drinking water shortage. The State’s economy, which depends on the South West Monsoon rainfall for majority of the electricity production, increases the vulnerability of the State to drought, particularly hydrological drought.
In the year 2016, the annual monsoon rainfall had registered a shortfall of 34 per cent in the State. An alarming 70 per cent deficit is reported in this year’s North East Monsoon as well. Taking into account the seriousness of the situation, Government of Kerala has declared the entire State as drought affected. The expected acute shortage of drinking water, water for irrigation, lowering of water in the dams of power stations resulting in power crisis is threatening the very same existence of life in the State
It is scientifically ascertained that the frequency of monsoon breaks are increasing , total amount of rainfall is showing a declining trend, and onset of monsoon is getting delayed . This also leads to the unsustainable land use practices. Polluting drinking water sources and dumping solid and liquid waste into perennial water sources have become a common practice. The techniques like mazhapolima, jalavarshini, rubber check dams and atmospheric water maker were introduced as drought reduction strategies supported by Kerala State Disaster Management Authority (KSDMA). The newly announced Harithakeralam Mission has also given emphasis to rejuvenate the water resources with the participation of local bodies and the public. The concept of Water Kiosk is a highly effective method in mitigating the problem of drought. Kiosk is a 5,000 to 10,000 litres of PVC water tank located on a pedestal in a public area with a tap attached to it. The water is filled and distributed by the district administration. The scheme has been implemented in Kannur (355), Kasargode(1), Thiruvananthapuram(27), Kozhikode(6), Alappuzha(264), Malappuram(34) and Ernakulam (77). Mazhapolima is another effective method of recharging the ground water, which is used widely in some districts. Rubber check dams are inflatable or hardened rubberised impediments that could be installed in streams to delay water flow. Jalavarshini- aims to identify and provide financial support to model water conservation projects. ‘EntaeKulamErnakulam’, 2016:- cleaned 51 ponds with the help of ‘Anbodu Kochi’, a social media group of likeminded individuals, ‘Kulam Koru BiriyaniTharam’ scheme of Kozhikode district, 2016:-cleaned 26 ponds. Atmospheric water maker is a device to produce potable and purified water from the air.
With a vision towards a ‘Safer State’, the entire state must be ready to face the crisis looming over us. A concentrated effort from the part of all individuals is essential in addressing the issue, Every drop saved may help in saving a life. In the long run, for a water secure future of the State we must join hands in rewriting 3Rs-Reduce, Reuse and Recycle as 4Rs-Respect, Reduce, Recycle and Reuse.
Source: SDMA, Kerala
Jalanidhi
Jalanidhi Phase I was implemented during the period 2000 to 2008. The GramaPanchayaths have a pivotal role in implementing community based water supply projects under Jalanidhi. The schemes are implemented through community participation with the involvement of NGOs. Though, KWRSA is mainly involved in small water supply schemes, it also engages in the distribution of bulk water supply through GramaPanchayaths. There were 3,694 small water supply schemes and 16 large water supply schemes commissioned benefiting 10.56 lakh population during the first phase (2000-2008). The second phase (2012-2018) which is being implemented is based on the need of the people with the participation of beneficiaries in planning and execution of projects. The project aims to cover about 18 lakh rural people for water supply and sanitation services in 200 Gramapanchayaths of Kerala. The funding pattern of scheme implementation is shared by State, Panchayath and beneficiaries with the percentage of 75, 15 and 10 respectively. The total project expenditure of Jalanidhi Phase II up to March 31, 2016 was `573.09 crore, and the total fund mobilised from the stakeholders is `729.27 crore. The total number of population covered by the Water Supply Schemes of Jalanidhi is13.65 lakhs. The details are given in Appendix 4.81. The Rain Water Harvesting (RWH) Structures under Jalanidhi Project helped 18,239 households to meet their demand of drinking water in acute summer. Data on RWH by the KRWSA is given in Appendix 4.82. Apart from the water supply schemes, KWRSA is also involved in ground water recharge activities. 53 GWR structures have been constructed up to September 30, 2016 during Phase II. The details of Jalanidhi phase II project are given in Appendix 4.83.
Income From Water Charges
The major income for KWA is from the sale of water and KWA is the only state in the country with 100 per cent metered water connections. During 2015-16 an amount of Rs. 460.25 crore has been collected as income from water charges by KWA. The details of income from the water charges from 2007-08 to 2015-16 is given in Appendix 4.84. The government has fixed varying tariff based on the category and consumption level. The water tariff set in 2014 is given in Appendix 4.85. The details of district wise and category wise rural and urban water supply schemes implemented in Kerala and district wise slipped back habitations are given in Appendix 4.86 and Appendix 4.87. The receipts of Kerala Water Authority from various sources and plan and non-plan expenditure are given in Appendix 4.88 and Appendix 4.89 respectively.
Issues And Concerns
Safe drinking water and proper sanitation is essential for a healthy life. One of the major challenges faced by Kerala Water Authority is interruption in providing water supply to the public due to frequent leakages of pipes. Due to lack of preventive maintenance and replacement of old pipes, a considerable portion of the produced water has been reported as distributional loss. It is estimated that around 40 per cent of the produced water in Kerala is lost in distribution.
Way Forward
To provide quality drinking water, there should be an integrated water resources management system in water supply. The distribution of water should be equitable across users. Waste water collection and disposal are equally important like supply of protected water in maintaining public health. The challenge is to find ways of managing the available water resources and use it in a sustained manner without degrading the environment so as to sustain the resources for the future generations. The conservation of traditional water resources and effective implementation of rain water harvesting is essential for resource sustainability. The role of local bodies in this regard is very important and there is a need for the convergence of State line Departments and Local Bodies to work towards water conservation.