Agriculture in Kerala
While the agriculture sector in Kerala has much potential, it is facing many challenges with regard to growth. According to data from the Directorate of Economics and Statistics (DES), the year-on-year growth rate of agriculture and allied activities were (-) 3.1 per cent in 2012-13, (-) 3.8 per cent in 2013-14, 0.75 per cent in 2014-15, and (-) 7 per cent in 2015-16. Thereafter, the sector witnessed growth of 2.5 per cent in 2016-17. The share of Agriculture and allied sectors in total GSVA of the State has also declined from 13.7 per cent in 2012-13 to 10.5 per cent in 2016-17 (Table 2.1).
| Sl. No | Year | Share of Agriculture and allied sectors in Total GVA (India) |
Share of Agriculture and allied sectors in GSVA (Kerala) |
| 1 | 2012-13 | 17.8 | 13.7 |
| 2 | 2013-14 | 17.7 | 12.36 |
| 3 | 2014-15 | 16.5 | 11.91 |
| 4 | 2015-16 | 15.4 | 10.85(P) |
| 5 | 2016-17 | NA | 10.58(Q) |
| (P) Provisional, (Q) Quick Source: National Accounts Statistics 2017 and Directorate of Economics and Statistics. |
|||
Monsoon, 2017
Kerala is characterised by the existence of a series of micro-environments suited to diverse kinds of agriculture and related activity. It is our task to translate the potential of Kerala’s biodiversity into incomes for our people. Classification of seasons of Kerala is shown below (Table 2.2).
| Sl. No | Seasons | Duration |
| 1 | Wet season a. Kalavarsha (South West Monsoon) b. Thulavarsha (North East Monsoon |
June to September October to November |
| 2 | Dry Season (Winter) | December to February |
| 3 | Hot Season (Summer) | March to May |
The realised rainfall during south west monsoon season (June to September), “Kalavarsha” 2017 over the country as a whole was 95 per cent of Long Period Average (LPA) and it was in the normal (90-100 per cent of LPA) category. The seasonal rainfall over three of the four geographical regions of the country except south peninsula was less than the respective LPAs. The realised rainfall during south west monsoon 2017 over the country as a whole and in the four broad geographical regions is given in Table 2.3.
| Region | Long Period Average (mm) |
Actual Rainfall (mm) |
Rain fall % of LPA |
| All India | 887.5 | 841.3 | 95 |
| Northwest India | 615 | 552.9 | 90 |
| Central India | 975.5 | 918.8 | 94 |
| Northeast India | 1438.3 | 1386.4 | 96 |
| South peninsula | 716.1 | 717.6 | 100 |
| Source: 2017 Southwest Monsoon end of Season Report, IMD | |||
Out of the total 36 meteorological subdivisions, 25 subdivisions (constituting 65 per centof the total area of the country) received normal seasonal rainfall, 5 subdivisions (18 per cent of the total area) received excess rainfall and 6 subdivisions (17 per cent of the total area) received deficient seasonal rainfall. Out of the 6 deficient subdivisions, 4 subdivisions were from Northwest India (West and East Uttar Pradesh, Punjab and Haryana, Chandigarh and Delhi) and 2 subdivisions were from the Central India (East Madhya Pradesh and Vidarbha) and out of the 5 excess subdivisions, 2 subdivisions were from South Peninsula (Rayalaseema and Tamil Nadu and Pondicherry) and one each from Northwest India (West Rajasthan), Central India (Saurashtra and Kutch) and Northeast India (Nagaland, Manipur, Mizoram, and Tripura (NMMT)).
The southwest monsoon reached parts of southeast Bay of Bengal, south Andaman sea and Nicobar Islands on May 14, 6 days ahead of its normal date of 20th May and set in Kerala on 30th May 2017. The south west monsoon covered the entire country by 19th July, 4 days later than its normal date of July 15.
The monsoon withdrawal was delayed and commenced from parts of northwest India on September 27 (with a delay of nearly 3 weeks). It withdrew from some more parts of northwest India on September 30. As on October 11, the monsoon has withdrawn from most parts of northwest India except east Uttar Pradesh.
The actual rainfall received in Kerala during Southwest monsoon (June 1 to September 30, 2017) was 1855.9 mm as against the normal rainfall of 2039.7 mm in 2017 showing (-)9 percent departure from normal. All the districts except Wayanad received normal rainfall during the period. The percentage departure from normal rainfall in Wayanad district was (-)37 percent (Figure 2.1).
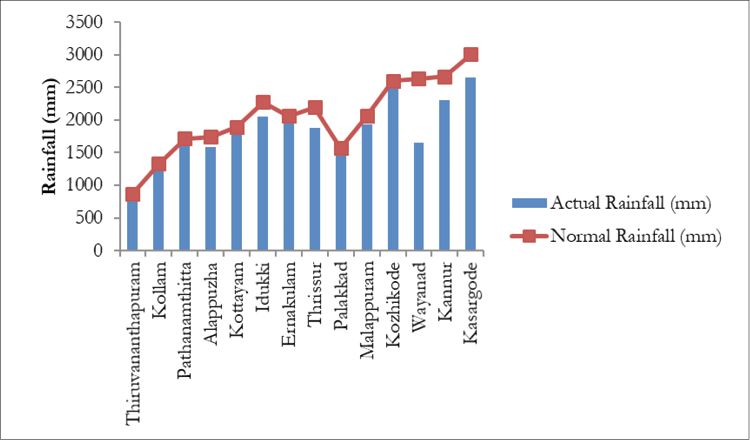 Source: Report of Indian Meteorological Department
From October 1 to November 1, the actual rainfall received in Kerala was 236.3 mm against the normal rainfall of 301.9 mm (22 per cent lower than normal). The seven districts - Thiruvananthapuram, Kollam, Pathanamthitta, Kottayam, Ernakulam, Idukki and Kozhikode - shows normal rainfall in this period. Other Districts received deficient rainfall. Highest percentage of departure from normal was in Palakkad District ((-)62 per cent).
Pre-monsoon Rainfall in Kerala, 2017
The pre monsoon rainfall received in the State from March 1, 2017 to May 31, 2017 was normal this year with a departure of (-)7 percent from the normal. The actual rainfall received during the period was 354.3 mm against the normal rainfall of 379.9 mm. Excess rainfall was received in the districts of Kollam and Pathanamthitta. 4 Districts (Thrissur, Malappuram, Kannur and Kasaragod) received deficient rainfall and 8 districts received normal rainfall. The percentage departure from normal was highest in Kasaragod District ((-)68 per cent). (Figure 2.2 and Appendix 2.1).
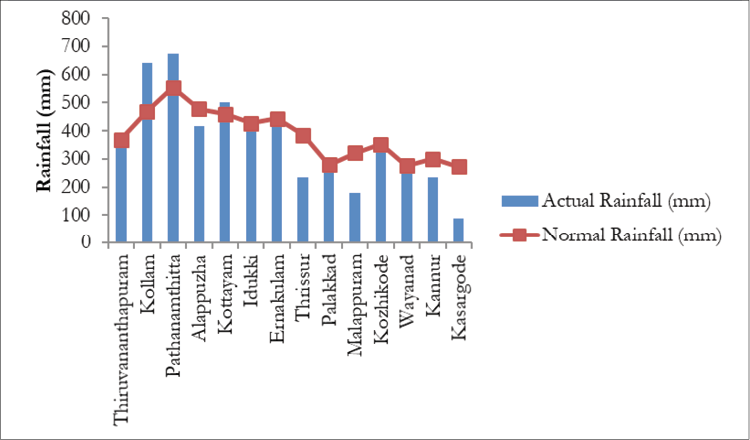 Source: Report of Indian Meteorological Department
Northeast Monsoon in Kerala, 2017
The rainfall received during North East Monsoon (October 1, 2017 to December 31, 2017) was normal with a departure of (-)8 per cent from the normal. The actual rainfall during the period was 441.8 mm against the normal rainfall of 480.7 mm. Excess rainfall was received in 3 districts viz. Thiruvananthapuram, Kollam and Pathanamthitta while 4 districts (Alappuzha, Ernakulam, Idukki and Kottayam) received normal rainfall. Other districts received deficient rainfall. The percentage departure from normal was highest in Palakkad district ((-)59 per cent).
The total cropped area of the State has been declining consistently, from 30 lakh hectare in 2000 to 25.84 lakh hectare in 2016-17. Net sown area has recorded a slight decline of 8.64 per cent, and the area sown more than once has declined by 30.29 per cent. Current fallows have decreased 7.5 per cent whereas the "fallows other than current fallows” as well as “cultivable waste land" have recorded an increase of 63.38 per cent and 71 per cent respectively. Thus the land that is available for cultivation but is not being cultivated is on the rise signaling the tendency of people to keep land fallow for various reasons.
The land utilisation statistics of Kerala show that in 2016-17, out of the 38.86 lakh hectare of geographical area, the total cropped area was 25.84 lakh hectares (66 per cent), area under forest was 28 per cent, and land put to non agriculture uses accounted for 11 per cent. Cultivable waste and fallow land constituted 3 per cent each. Year on year there has been a 2 per cent decline in the gross cropped area. This is mainly due to factors like decline in area sown more than once, diversion of economic activity from agricultural operations to non-agricultural operations due to high input prices and labour cost, shift in cropping pattern skewed towards cash crops, etc. (Appendix 2.2 and Appendix 2.3).
Cropping pattern in Kerala is dominated by cash crops. It constitutes 62.46 per cent of the total cropped area while food crops consisting of rice, tapioca and pulses constitute just 9.35 per cent. Among cash crops, coconut has the largest area under crop cover (30 per cent) followed by rubber (21.3 per cent) pepper (3.3 per cent) and coffee (3.28 per cent). Rice has the third largest area under crop cover (6.6 per cent). Year on year there has been a drastic reduction in the area of food crops, area under rice recording a heavy decline from 1.96 lakh hectare to 1.71 lakh hectare, area under pulses declining by half and that of tapioca declining by close to 1000 hectares (Appendix 2.4).
Rice
Rice is the most important food crop in the State. It occupies around 6.6 per cent of the total cropped area. However, the area under it has been falling at an alarming rate ever since the 1980s from around 8 lakh hectare to 1.96 lakh hectare in 2015-16 and further to 1.71 lakh hectare in 2016-17. The production has also declined from 12.9 lakh MT in 1980s to 5.49 lakh MT in 2015-16 and 4.37 lakh MT in 2016-17. Season-wise trends also show that there has not been much of a decline in virippu, but a drastic decline in mundakan and puncha crop (Appendix 2.5 and Appendix 2.6).
Inter-district analysis shows that the area under rice declined in almost all the districts except Alappuzha, Kottayam, and Pathanamthitta. Maximum decline occurred in Palakkad followed by Thrissur, Malappuram, Wayanad and Kozhikode. District-wise trends also show that among the major rice producing districts of Palakkad, Alappuzha, Thrisur and Kottayam in Alappuzha there has been an increase in production while in Kottayam there has been a marginal decline. However, in Thrissur and Palakkad there has been a drastic decline resulting in overall decline in the production of rice (Appendix 2.7 and Appendix 2.8).
The sharp decline in the area, production and productivity of rice was due to the severe drought experienced in the State during 2016-17. It is estimated that drought affected a total area of 50,917.62 ha of rice cultivation including crop damage in 36,927.62 ha in various districts.
In order to augment rice production during 13th Five-Year Plan, focussed interventions including Special Agricultural Zones (SAZ) for focussed project based activities, assistance for fallow land and waste land cultivation, promotion of high yielding varieties and special varieties, promotion of insitu processing and value addition including branding and marketing etc. were introduced.
Coconut
In terms of area under cultivation, coconut is the most important crop in the State with over 7.81 lakh hectare under it. It accounts for the largest share in the Gross Cropped Area followed by rubber and paddy. Kerala has the largest area under the crop in the country, but in terms of production it comes third. This indicates the low productivity of the crop in the State with just 6883 nuts per hectare. For Tamil Nadu it is 14873 nuts per hectare and for Andhra Pradesh it is 13808 nuts per hectare. Also, Kerala’s share in area as well as production of coconut in the country is declining over time. While it accounted for 69.58 per cent of the area and 69.52 per cent of the production in the country in 1960-61, the corresponding shares declined to 40.2 per cent and 42.12 per cent respectively in 2011-12. However the area and production of coconut in the State has been increasing. From 29.88 per cent of the net sown area in 1980-81 the share of coconut has increased to 41.96 per cent in 2000-01. Although it declined to 37.19 per cent in the start of the next decade, it was made good by 2011-12 to 40.24 per cent. This could be because part of the paddy fields were reclaimed and planted with coconut during the period. The production also increased concomitant to increase in the area during this period. From 3220 million nuts in 1960-61, the production increased to 5536 million nuts in 2000-01. After that the production plateaued and was more or less stagnant in the next decade. Thus the increase in output is more on account of increase in acreage as the productivity of the crop is very low in the State. In 2016-17 there was a marginal decline in the production from 5873 million nuts in 2015-16 to 5379 million nuts. Area, production and productivity of coconut in Kerala are given in Appendix 2.9.
The main cause for falling productivity is the prevalence of root wilt disease, poor management and existence of senile and unproductive palms. Hence massive replanting of root wilt palms by elite palms and elimination of senile palms, setting up of nurseries for production of quality seedlings and their subsequent distribution is required for increasing productivity. Restructuring of the cluster development programme is also essential for more effectiveness. The attempt made by the Department of Agriculture and Cooperation to restructure two coconut development programmes through convergence approach at the Panchayat level in 2014-15 coupled with price advantage is expected to revive coconut production in the State. The isolated attempts of production of dwarf coconut seedlings and hybrids need to be scaled up substantially with the support of Research and Development institutions. Entrepreneurial ventures for the production of value added products like desiccated coconut, beverages, shell based products, coconut cream, neera etc has to be promoted with appropriate tie up with credit and marketing agencies. The coconut procurement system through Krishi Bhavans in association with Kerafed was introduced in 2012-13 which needs further streamlining now. The initiative taken by Government in promoting neera and value addition are expected to revive coconut economy of the State.
State Government has declared the period from 2017 Chingam 1st to 2018 Chingam 1st as Coconut Year, with a range of programmes designed to promote cultivation of the crop and its value addition. Nurseries would be set up to provide high-yielding and dwarf varieties of coconut. Special Agricultural Zones and processing units would be set up for coconut and disease control measures stepped up.
Pepper
India comes third in the production of pepper in the world after Vietnam and Indonesia. However the production of pepper in the country has been stagnant around 50000 tonnes in the last few years and hence is fast losing its status as a leading producer and exporter of pepper. Grown mostly in the slopes of Western Ghats in Kerala, Karnataka, and Tamil Nadu the cultivation base of pepper has come down drastically in the last decade hitting production and export. In 2016-17, pepper production recorded an increase to 55,500 tonnes from 48,500 tonnes a year ago. However, Kerala which accounts for 75 per cent of the total production in the country recorded a drastic decline from 42 thousand tonnes to 34 thousand tonnes in 2016-17.
With regard to prices, there has been a rally in pepper prices since 2010 but in 2015 the price registered a decline by 16.48 per kg compared to previous year to 646.79 per kg. The average prices during the first six months of 2016 suggests continuation of bullish phase in pepper prices despite bumper crop in India and in global supplies. The price realisation during 2016 (Jan to June) was at 669.29 per kg compared to 619.76 per kg during the corresponding period of June 2015, an increase of 49.53 per kg.
This stagnant nature of pepper production in recent years was mainly due to low productivity and disease affected pepper gardens. In order to revive spices development in the State, the Department of Agriculture had initiated comprehensive pepper development programme in all districts of the State in 2014-15. An integrated action plan was prepared for the revival of the crop in the State, covering reorientation of planting material production, expansion of grafting wherever possible, area wide disease management, liming and nutrients management and revival of pepper samithies. The increase in production achieved could be because of this concerted effort by the GOK.
Cashew
India continued to be the largest producer of raw cashew nuts in the world. The other main producing countries are Vietnam, Brazil, Tanzania and Ivory Coast. The production of raw cashew nuts increased from 670 thousand MT in 2015-16 to 779.35 thousand MT in 2016-17. The area under cashew cultivation however recorded an increase from 1034 thousand hectares to 2034 thousand hectares in the respective years.
On the contrary in Kerala as per the statistics of Economics and Statistics Department in the last one decade, there has been a continuous and considerable decline in both area under cultivation as well as production of cashew. Its alarming to note that the production which stood at 60 thousand MT in 2004-05 declined to 33.3 thousand MT in 2013-14 and to 24.73 thousand MT in 2015-16. While area dwindled from 81 thousand hectares to 49 thousand hectares and to 43 thousand hectares during the same period. However, in 2016-17, there has been an increase in production by 3211 tonnes despite decline in area of 1430 hectares caused by an increase in productivity. Productivity of the crop which was around 900 kg per hectare during the late eighties also dwindled to 654 kg per hectare in 2014-15. Details are given in Appendix 2.10.
Area and production are increasing steadily in other producing states in the country. Even though the major share of area under cashew comes from Andhra Pradesh (18.3 per cent), Maharashtra is the leading producer with 32.9 per cent share in production in 2013-14 while its share was only 10 per cent in 1990-91.
Plantation crops in general are either export oriented or import substituting and therefore assume special significance from the national point of view. It is estimated that nearly 14 lakh families are dependent on the plantation sector for livelihood. Each of the four plantation crops of South India has its distinct characteristics and economic problems. Consequent to the removal of quantitative restrictions on import, plantation crops in general are facing the threat of low quality imports.
Kerala has a substantial share in the four plantation crops of rubber, tea, coffee and cardamom. These four crops together occupy 7.04 lakh ha, accounting for 27.29 per cent of the gross cropped area in the State. Details are given in Appendix 2.11.
Rubber
India produced 5.62 lakh tonne of natural rubber (NR) during the year ended March 2016, lower by 0.83 lakh tonne. However, in Kerala the total production increased from 4.38 lakh MT in 2015-16 to 5.4 lakh MT in 2016-17. Details are given in Appendix 2.12, 2.13, and 2.14.
The price of NR reported significant gains during 2011 and thereafter the prices headed south. The latest trends in prices during January-June 2016 indicate that the price growth continued to falter. The average price realisation in RSS-4 was lower by 13.56 per kg while RSS 5 was lower by 3.58 per kg and accordingly the average price was 115.82 per kg (RSS-4) and 112.73 per kg (RSS-5).Overall, the market trend stayed weak and subdued. Demand from the NR consuming segment remained lack lustre, weak macroeconomic cues pressured prices to south. The declining price of rubber is a cause of concern.
Coffee
Domestic coffee production for 2016-17 was estimated at 312 thousand tonnes, which represents a decrease of 36 thousand tonnes compared to previous year. Initially the Coffee Board had projected 2016-17 crop (Post Blossom estimate) at 320 thousand tonnes which was subsequently revised downwards to 312 thousand tonnes. As per the revised figure, the Arabica production was estimated at 95 thousand tonnes (30.4 per cent) and Robusta at 217 thousand tonnes (69.6 per cent). However as per FAO estimates, yield and lower productivity in India is due to limited mechanisation, pest infestation, existence of old/senile plants and labour shortage. Thus on the productivity side much more needs to be done and towards this concerted efforts are required both at the policy and farm level. The only way to address this issue is by providing positive research and development which can directly contribute in achieving higher yield.
With regard to Kerala the production of coffee registered a slight decline from 69230 MT in 2015-16 to 63,476 MT in 2016-17. Major variety grown in Kerala is Robusta with a share of 97.1 per cent in planted area. Productivity of the crop in terms of bearing area in Kerala is 808 kg/ha which is lower than the national level of 852 kg/ha during 2011-12. Among the States, Kerala stands next to Karnataka which accounts for 70.4 per cent of total Indian coffee production.
Tea
As one of the largest tea producing countries, India accounts for 24.8 per cent of the total world production. The domestic tea production during 2016 was higher by 58.7 mkg while South Indian production was placed at 212.9 mkg, the lowest in the decade, registering a decline for the second year in succession. This also meant that South India is not having any reprieve from the low crop trap which indeed is a matter of concern.
Kerala accounts for 5.03 per cent of the area and 6.3 per cent of the total domestic production of tea in the country. In 2016-17, tea production increased by 3607 tonnes despite area remaining the same on account of increase in productivity. The major issues plaguing the tea industry are stagnant productivity, acute labour shortage, high cost of machines, and lack of indigenous machinery (Appendix 2.15).
Cardamom
India is the second largest producer of small cardamom and plays an important role in the international trade of cardamom. The output of cardamom is dependent on prevailing climatic conditions as the cardamom plant requires intermittent spells of rains and good sunshine during the growth stage. Cardamom production in the country during 2016-17 was estimated at 19.63 thousand tonnes compared to 23.89 thousand tonnes in 2015-16, a decline of 4.26 thousand tonnes. The turn around in cardamom prices since 2006-07 continued upto 2014-15 reaching the highest level of 754, but thereafter the prices had fluctuated. During the current season 2016-17(August-June), the prices had increased to 1105.67 per kg reporting an increase of 481.94 per kg. Meanwhile in Kerala, cardamom production has declined to 17147 tonnes in 2016-17 from 19500 tonnes in 2015-16.
Collective farming through Kudumbashree
Collective farming is an important area of Kudumbasree, which aims at food security both at household and community level. The major crops cultivated are paddy, vegetables, banana, pineapple and tubers. In 2016-17 area brought under cultivation of paddy was 9,475 ha, vegetables contributed to 13,569 ha and 29,678 ha of area was covered by other crops (banana, pineapple and tubers) through 78,746 Joint Liability Groups (JLGs). Details of area covered are depicted in Appendix 2.16. More hand holding support including facilitation with banks and technology support are essential for improving livelihood of the women groups involved in farming.
Overview of 12th Five-Year Plan
The major thrust areas envisaged during 12th Five-Year Plan was promotion of Integrated Food crop production, revival of coconut based systems and pepper development, Agro Ecology Unit (AEU) wise technology packages, augmentation of productivity of crops, revitalisation of agricultural extension services, institutionalisation of service delivery for agriculture, strengthening of Krishi Bhavans, promotion of new technologies, strengthening organic farming, soil and plant health management, basic infrastructure for inputs and marketing and special focus to value addition.
During 12th Five-Year Plan, the area and production of vegetables increased from 40837 ha to 52830 ha and 5.51 lakh MT to 7.25 lakh MT respectively. In order to achieve the target, the activities initiated are project based vegetable cultivation in 1380 institutions, established 39 block level nurseries, developed 269 A Grade clusters and commercial cultivation through 800 clusters. The coconut development scheme was restructured and focused in continuous areas called Keragramams. Around 60 Keragramams were established for integrated management of coconut gardens covering irrigation, nurseries and value addition, production of dwarf coconut seedlings, hybridisation of newly selected dwarf coconut palms from nontraditional areas, bar-coding of palms and seednuts for identification of lineage. Decline in paddy area arrested and more land brought under sustainable paddy cultivation. 3000 ha in Kasargod was registered under organic farming. As part of strengthening agriculture extension, introduced ATMA PLUS first in the country, established 456 farm schools, 250 Farmer Field Schools, 205 integrated farming system models, mobility support to field level officers and introduction of Toll free ATMA Call Centre for advisory services (1800-425-1661). Further 64 Agro Service Centres established for improved service delivery, issued 1.41 lakh nos of soil health cards, prepared Panchayat/Block/District level nutrient management plan, registration of 18.77 lakh farmers completed and direct benefit transfer made fully functional. A holistic Agriculture Policy was drafted after 23 years. Around 5,772 pest surveillance units,152 plant health clinics at Panchayat level and 4 district referral clinics were established. Portable biogas plants installed in 3825 schools for conversion of organic waste into energy and enriched manure. Promotion of NEERA for boosting the economic viability of coconut sector, support to pilot project on neera and coconut sugar production by KAU, Incubation centre started at Central Tuber Crops Research Institute (CTCRI), and Ginger value addition project in collaboration with NIIST (Wayanad). The outlay earmarked during 12th Plan under State Plan was 3,413.91 crore and the expenditure during the period was 3,303.93 crore (97 per cent).
Vision of 13th Five-Year Plan
Key Initiatives of Annual Plan, 2017-18
The key initiatives undertaken in Annual Plan 2017-18 were the following. Integrated food crop production programme focusing on self-sufficiency in vegetable production, enhancing rice production, comprehensive fallow land cultivation with people’s participation, keragramams for integrated management of coconut gardens, promotion of organic farming and safe food production, modernisation and establishment of labs, institutional mechanism for marketing, production and distribution of quality planting materials, strengthening extension activities at AEU level, Agricultural Technology Management Agency (ATMA) plus model of extension, rejuvenation of spices economy, crop health management covering pests and disease surveillance and application of drones to assess crop health, new plant health clinics, improved service delivery by establishing 20 Agro Service Centres (ASCs) and strengthening the existing ASCs, crop insurance, revival package for pepper in Wayanad and setting up of Special Agricultural Zones (SAZ) for five crops viz. rice, vegetables, coconut, banana and flowers for convergence based result oriented scheme preparation and implementation for focused project based interventions in identified potential zones.
Crop Insurance Schemes
In Kerala large majority of agricultural producers are small farmers and agriculture is heavily dependent on the weather and the uncertainty of the weather makes agriculture a highly risk venture. Thus the uncertainty of crop yields is one of the basic risks that every farmer has to face. As crop production is affected by the vagaries of nature and damages occur due to droughts, floods, attacks of pests and diseases, crop insurance can play a vital role in sustaining farms income.
During 2016-17, the State crop insurance scheme was restructured by bringing considerable enhancement in the crop loss compensation and under the scheme 89,862 farmers were enrolled covering an area of 53,161 ha and an amount of 159.87 lakh disbursed towards claim amount for 2478 farmers insured under the scheme. The Restructured Weather Based Crop Insurance Scheme (RWBCIS) was notified in 12 districts except Alappuzha and Pathanamthitta covering 10 crops (paddy, banana, ginger, turmeric, pineapple, arecanut, cardamom, pepper, nutmeg and sugarcane). Under RWBCIS, during kharif 2016 season, 31,532 farmers were insured covering an area of 21,435 ha and an amount of 17.19 crore was paid as claims to 21,046 farmers and during rabi season, 27459 farmers were insured covering an area of 18,703 ha. Cool season crops of Idukki and Wayanad districts viz. cabbage, carrot, garlic, french bean and potato were notified under RWBCIS for the first time during the period. The Coconut Palm Insurance Scheme (CPIS) is being implemented in all districts and a total claim of 2.70 lakh was settled among 403 insured farmers covering an area of 250 ha. During 2016-17 Rabi season, the State government had notified the scheme Prime Ministers Fasal Bima Yojana (PMFBY) covering the crops such as paddy, banana, tapioca and plantain. Paddy is notified in the districts of Alappuzha, Kottayam and Pathanamthitta. Under PMFBY, 18,415 farmers were insured covering an area of 12961 ha and an amount of 55 lakh paid to 341 farmers as claims.
Special Agricultural Zone
A new concept of Special Agricultural Development Zone (SAZ) was introduced during 2017-18 for convergence based result oriented scheme preparation and implementation for focused project based interventions in identified potential zones. Production, marketing, processing, value addition, Storage, irrigation etc will be covered for each zone. The facilities in each SAZ are Agro Service Centres including soil testing labs and call centre, plant health clinics, weather stations and advisories, biopharmacy including on farm production units, planting materials production units, markets, processing and value addition units, irrigation support, credit interventions if required, extension including ICT based initiatives, community Radio, farmers markets supported by LSGIs, procurement system for surplus production, promotion of farmer technology development and training to farmers on convergence mode. A separate monitoring system for projects in SAZ is also included. The SAZ suggested are:
State Horticulture Mission (SHM)
The State Horticulture Mission was formed in 2005 to implement the programme of the National Horticulture Mission, a centrally sponsored scheme, with 85 per cent central share and 15 per cent State share which was restructured as Mission for Integrated Development of Horticulture (MIDH) from 2014-15 onwards. Subsequently, GOI changed the sharing pattern of the scheme as 60:40. The main objective of the mission is a holistic development of the horticulture sector covering fruits, plantation crops, spices, flowers, aromatic and medicinal plants and mushroom. The important programmes under the mission include production and productivity improvement, post harvest management and marketing.
During 12th Five-Year Plan, a total amount of 190.74 crore was released to SHM including 145 crore from GoI and 45.74 crore from State share and the total expenditure incurred was 209.37 crore. Establishment of nurseries for production and distribution of quality seeds and planting material, establishment of new gardens, establishment of integrated pack houses, sorting and grading units, cold storage units, establishment of rural markets, strengthening of wholesale markets, market intelligence, extension quality awareness and market led extension activities for fresh and processed foods are the components implemented during the Plan period.
At present a number of agencies and private individuals are actively involved in the field and therefore an integrated approach is needed to enhance the participation of the agencies so as to achieve the desired deliverables.
Vegetable and Fruit Promotion Council, Kerala (VFPCK)
Vegetable and Fruit Promotion Council, Kerala (VFPCK) has been implementing various schemes in fruits and vegetable sector with the financial assistance of both State and central Governments. Formation of Self Help Groups (SHGs), awareness creation on Participatory Guarantee System (PGS), dissemination of Participatory Technology Development/capacity building programmes, production of quality seeds and planting materials, participatory credit and insurance support, group marketing and Haritha Nagari programmes for the promotion of vegetable cultivation in urban areas are the major activities. During 2016-17, the council had inducted 4465 farmers and formed 106 new SHG’s for the promotion of fruits and vegetables. At present the council has a total of 1,89,902 registered farmers in 9,540 Self Help Groups. The council had initiated 4 new farmer markets and 10 collection centres during 2016-17. Now there are 278 Swasraya Karshaka Samithies and 177 collection centres under the purview of the council. During 2016-17, 1,00,213 MT of fruits and vegetables worth 280 crore were traded through 277 swasraya karshaka samithies. Ready to cook vegetables were made available in packets to public through cut vegetable scheme implemented in Thiruvananthapuram, Ernakulam, Calicut, Thrissur and Pathanamthitta districts. The seed processing plant at Alathur produced 17 items of vegetable seeds through registered seed growers and 68.30 MT vegetable seeds and 6.56 lakh tissue culture banana plantlets were distributed throughout the State. An amount of 71.69 crore was disbursed as agriculture loan to 8919 farmers. A total of 23.92 lakh banana plants and 500 ha of vegetables were covered under crop insurance and an amount of 80 lakh was disbursed to farmers as claim. During 2016-17, 190 vegetable retail markets were organised all over the State during onam season to control price hike in vegetables. The farmers of the council had cultivated vegetables in 14622 ha, banana in 19964 ha and tuber crops in 2845 ha during the period. Total production during the period was 1.02 lakh MT vegetables, 1.86 lakh MT banana and 25266 MT of tubers. VFPCK has been appointed as the regional council for Participatory Guarantee System (PGS) organic certification for fruits and vegetables in Kerala. As part of it, awareness creation of PGS to promote organic farming was undertaken and there are 213 local groups wherein 1470 farmers are cultivating 725 ha under PGS certification. Agro meteorological data have been collected from 26 Automated weather stations installed in different parts of the State with the participation of farmers. Other details of the sector are given in Appendix 2.17, 2.18, 2.19, 2.20, 2.21 and 2.22.