India exports approximately 7500 commodities to about 190 countries, and imports around 6000 commodities from 140 countries. As per the statistics published by the Ministry of Commerce and Industry, Government of India, there is a positive growth of 4.71 in the value of exports during 2016-17. The value of exports was 1,841,314.39 crore as compared to 1,716,377.99 crore during 2015-16. In continuation with the positive growth exhibited by exports for the last twelve months, exports during August 2017 have shown growth of 5.39 per cent valued at 152,365.23 crore as compared to 144,570.03 crore during August, 2016. Refined petroleum, gems; precious metals; coins, vehicles, machines; engines; pumps, organic chemicals, pharmaceuticals, cereals, iron and steel, clothing and electronics are the top ten commodities exported from India.
During August 2017, major commodity groups of export showing positive growth over the corresponding month of last year are Engineering Goods (19.53 per cent), Petroleum Products (36.56 per cent), Organic and Inorganic Chemicals (32.41 per cent), Drugs and Pharmaceuticals (4.21 per cent), and RMG of all Textiles (0.56 per cent). Cumulative value of exports for the period April-August 2017-18 was 763,145.37 crore as against 731,420.12 crore registering a positive growth of 4.34 per cent over the same period last year.
Imports in 2016-17 was 2,550,926.19 crore as against 2,490,298.03 crore registering a positive growth of 2.43 per cent over the same period last year. Imports during August 2017 were valued at 226,849.74 crore which was 15.65 per cent higher over the level of imports valued at 196,154.44 crore in August, 2016. Cumulative value of imports for the period April- August 2017-18 was 1,169,589.74 crore as against 961,178.43 crore registering a positive growth of 21.68 per cent over the same period last year. The top ten imported commodities to India are Oil, Gems; precious metals; coins, electronics, machines; engines; pumps, organic chemicals, plastics, iron and steel, animal/vegetable fats and oils, ores, slag and ash, medical and technical equipment.
Major commodity group of imports showing high growth in August 2017 over the corresponding month of last year are petroleum, crude and products (14.22 per cent), electronic goods (27.44 per cent), machinery, electrical and non-electrical (18.35 per cent), gold (68.90 per cent) and pearls, precious and semi-precious stones (30.88 per cent).
In order to address the declining trend in exports, Government of India launched a new Foreign Trade Policy (FTP) for the period 2015-20 with a focus on supporting both manufacturing and services exports and improving the “Ease of Doing Business”. The policy provides a road map to align trade with the "Make in India" and "Digital India" programmes.
Kerala plays an important role in the export prospects of the nation by contributing to spices and marine products exports. The external trade in Kerala is mainly operated through Cochin Port. Major items of trade are cashew, coir and coir products, tea, coffee, pepper cardamom, ginger, other spices and spices oil and marine products, machinery, chemicals, coal, fertilizers and raw materials. Total traffic handled by the Port during 2016-17, both coastal and foreign, was 250.07 lakh MT registering an increase of 13.16 per cent as against 220.18 lakh MT in 2015-16. The growth percentage was only 2.33 per cent during 2015-16. Out of the total traffic, exports accounted for 47.59 lakh MT and imports 202.48 lakh MT in 2016-17 (Table 3.4.1).
| Traffic | Export | Import | ||||||||||
| 2011-12 | 2012-13 | 2013-14 | 2014-15 | 2015-16 | 2016-17 | 2011-12 | 2012-13 | 2013-14 | 2014-15 | 2015-16 | 2016-17 | |
| 1 | 2 | 3 | 4 | 5 | 6 | 7 | 8 | 9 | 10 | 11 | 12 | 13 |
| Coastal | 14.86 | 14.05 | 17.18 | 16.48 | 12.86 | 14.18 | 51.74 | 52.12 | 60.63 | 52.15 | 60.4 | 56.56 |
| Foreign | 28.25 | 24.29 | 25.32 | 24.10 | 26.28 | 33.41 | 106.06 | 107.99 | 105.73 | 123.22 | 121.44 | 145.92 |
| Total | 43.11 | 38.34 | 42.50 | 40.58 | 39.14 | 47.59 | 157.80 | 160.11 | 166.36 | 175.37 | 181.84 | 202.48 |
| Source: Annual Report 2016, Cochin Port Trust. | ||||||||||||
Coastal and foreign exports through Cochin Port increased by 21.59 per cent during 2016-17 with 47.59 lakh MT as against 39.14 lakh MT in 2015-16. Coastal export which was 12.86 lakh MT increased to 14.18 lakh MT and foreign export increased from 26.28 lakh MT to 33.41 lakh MT from 2015-16 to 2016-17. Total import during the above period was 202.48 lakh MT that is 11.35 per cent higher than the import during 2015-16. This is mainly due to increase in foreign import from 121.44 lakh MT to 145.92 lakh MT during the period. Coastal imports registered a decrease of 6.35 per cent during this period.
Tea, cashew, coir and coir products, coffee, pepper cardamom, ginger, other spices and spices oil and marine products are the major items exported through Cochin Port. Export of tea& cashew kernals through Cochin Port continued to decrease during 2016-17 as recorded in preceding years. The exports of tea dropped by 4.19 per cent and cashew kernals by 22.75 per cent. After a long period, the export of coir products showed a substantial increase of 69.89 per cent from 2015-16 to 2016-17 registering 211177 MT of exports. Export of sea foods and coffee increased by 16.43 per cent and 2.11 per cent respectively during this period. Export from the State, which touched 47.59 lakh MT in 2016-17 from 43.11 lakh MT in 2011-12, increased by 10.39 per cent over a period of six years. (Appendix 3.4.1).
Imports through Cochin Port continued to increase in 2016-17 touching 202.48 lakh MT compared to 181.84 lakh MT in 2015-16 showing an increase of 11.36 per cent. Fertilizers and raw materials, iron and steel and machinery, newsprint, raw cashew nut, food grains, POL are the main items of import. During 2016-17, import of fertilizers and raw materials slightly decreased by 0.41 per cent. The growth rate of import of miscellaneous items which includes POL increased to 11.74 per cent during 2016-17 from 4.63 per cent in 2015-16. With regard to iron, steel and machinery, import decreased by 35.33 per cent in 2016-17 as against the increase of 44.47 per cent in 2015-16. During the review period, 174344 MT of food grains were imported through Cochin Port. There was no import of newsprint reported during 2015-16, but import of raw cashew nut decreased by 44.21 per cent. All items except fertilizers and raw materials, miscellaneous items and raw cashewnut marked a decreasing trend of imports during the review period. (Appendix 3.4.2).
Exports of Marine Products
Riding on a robust demand for its frozen shrimp and frozen fish in international markets, India exported 11.35 lakh MT of marine products worth 37870.9 crore in 2016-17 as against 9.46 lakh MT and 30,420.83 crore a year earlier. This indicated an increase of 19.98 per cent and 24.49 per cent respectively in quantity and value of exports of marine products during 2016-17 as compared to 2015-16. Marine products exports from Kerala also, increased both in quantity and value, in 2016-17. Quantity enhanced from 1.49 lakh MT in 2015-16 to 1.59 lakh MT in 2016-17 and value from 4,644.42 crore to 5,008.54 crore for the same period. The share of Kerala in Indian exports of marine products declined from 15.77 per cent to 14.02 per cent in case of quantity and from 15.27 per cent to 13.23 per cent for value during the period under review. Value of export of marine products from India and Kerala increased to 193.54 per cent and 150.16 per cent respectively between 2010-11 to 2016-17. (Table 3.4.2).
| Year | India | Kerala | Kerala’s share per cent | |||
| Quantity (Tonnes) | Value (lakh) | Quantity (Tonnes) | Value (Lakh) | Quantity | Value | |
| 2010-11 | 813091 | 1290147 | 124615 | 200210 | 15.33 | 15.52 |
| 2011-12 | 862021 | 1659723 | 155714 | 298833 | 18.06 | 18.00 |
| 2012-13 | 928215 | 1885626 | 166399 | 343585 | 17.93 | 18.22 |
| 2013-14 | 983756 | 3021326 | 165698 | 470636 | 16.84 | 15.58 |
| 2014-15 | 1051243 | 3344161 | 166754 | 516608 | 15.86 | 15.45 |
| 2015-16 | 945892 | 3042083 | 149138 | 464442 | 15.77 | 15.27 |
| 2016-17 | 1134948 | 3787090 | 159141 | 500854 | 14.02 | 13.23 |
| Source: The Marine Products Export Development Agency (MPEDA). | ||||||
The major export items of marine products are frozen shrimp, frozen fish, frozen cuttle fish, frozen squid, dried items, live items and chilled items. Item wise details of marine products export from India and Kerala in 2016-17 are given in Appendix 3.4.3.
Frozen shrimp maintained its position as the top export item from India in 2016-17 accounting for 38.28 per cent in quantity and 65.25 per cent of the total earnings in value. Shrimp exports increased by 16.21 per cent in terms of quantity and 23.28 per cent in value. Frozen fish was the second largest export item, accounting for a share of 26.15 per cent in quantity and 11.78 per cent in value, registering a growth of 28.84 per cent.
In Kerala also, frozen shrimp is the largest export item from 2013-14 onwards but there is a decline of 10.56 per cent and 8.56 per cent respectively in the quantity and value of shrimp exported during 2016-17. Around 45133 MT of frozen shrimp accounting for a share of 28.36 per cent and worth 2178.01 crore (43.49 per cent share) was exported in 2016-17. Frozen fish was the second largest item of export with a share of 24 per cent in quantity and 11.65 per cent in value in 2016-17. In value terms, frozen squid was in the second position with 19.10 per cent.
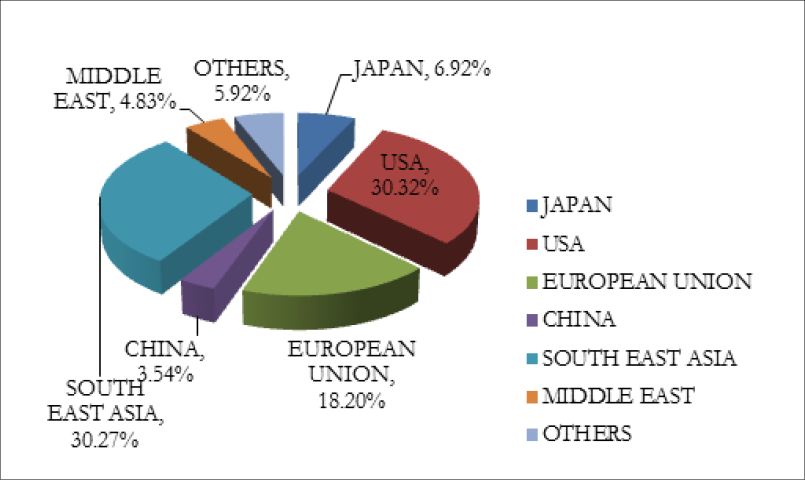
US and South-East Asia retained their position as major importers, followed by the European Union and Japan. USA is the largest market for Indian marine products with a share of 30.32 per cent followed by South East Asia (30.27 per cent), European Union (18.20 per cent), Japan (6.92 per cent), Other countries (5.92 per cent), Middle East (4.83 per cent) and China (3.54 per cent). USA imported 1,88617 MT of Indian seafood, registering a growth of 22.72 per cent in terms of quantity and 33 per cent in terms of value.
Major importers of marine products from India and their share in 2016-17 is shown in Figure 3.4.1.
 Source: Cochin Port Trust
Exports of Cashew
As per the export-import statistics, the share of agricultural products in the total export earnings of the country in 2015-16 was 6.84 per cent and cashew kernels ranked 6th among them contributing 4.28 per cent of the agri product exports. The total exports of cashew kernels from India in 2016-17 was 82,302 MT valued at 5168.78 crore as against 96,346 MT valued at 4952.12 crore in 2015-16. There has been a decrease of 14.58 per cent in quantity and increase of 4.38 per cent in value terms. The major markets for Indian cashew kernels in 2016-17 were USA, UAE, Japan, Saudi Arabia, Netherlands, France, Spain, Germany, Belgium, Korea, etc. In the history of Indian cashew industry, it is the first time that UAE became the largest importer of cashew kernels from India moving USA to the second position. UAE’s share is 23 per cent of the total and that of USA is 21 per cent. Among major markets, Singapore, Qatar, Algeria and Jordan recorded an increase and other major markets showed a decreasing trend in terms of quantity.
Exports of cashew kernels from Kerala showed a sharp decline in quantity by 24.87 per cent and 6.36 per cent in value terms in 2016-17 as compared to the preceding year. The exports of cashew kernels stood at 38054 MT valued at 2415.32 crore in 2016-17 which was 50652 MT valued at 2579.49 crore in 2015-16. Kerala’s share in total exports of cashew kernels from India in quantitative terms, which was 52.57 per cent in 2015-16 declined to 46.24 per cent in 2016-17. In value terms it was 52.09 per cent in 2015-16 and reached 46.73 per cent in 2016-17 (Table 3.4.3).
| Year | Kerala* | India | Share of Kerala (per cent) |
|||
| Quantity | Value | Quantity | Value | Quantity | Value | |
| 2010-11 | 56578 | 1478.67 | 105755 | 2819.39 | 53.50 | 52.45 |
| 2011-12 | 68655 | 2295.84 | 130869 | 4383.82 | 52.46 | 52.37 |
| 2012-13 | 53624 | 2138.47 | 100105 | 4046.23 | 53.57 | 52.85 |
| 2013-14 | 65679 | 2861.75 | 114791 | 5058.73 | 57.22 | 56.57 |
| 2014-15 | 68150 | 3098.75 | 118952 | 5432.85 | 57.29 | 57.04 |
| 2015-16 | 50652 | 2579.49 | 96346 | 4952.12 | 52.57 | 52.09 |
| 2016-17 | 38054 | 2415.32 | 82302 | 5168.78 | 46.24 | 46.73 |
| *Export through Cochin Port. Source: The Cashew Export Promotion Council of India | ||||||
The export of cashew nut shell liquid/cardanol from India during 2015-16 was 11677 MT valued at 57.59 croreand it decreased to 11422 MT valued at 44 crore in 2016-17. The quantity of cardanol exports decreased by 2.18 per cent and value by 23.63 per cent. Export of cardanol through Cochin Port was 111 MT with a value of 0.27crore in 2015-16. (Appendix 3.4.4).
India continued to be the largest producer of raw cashew nuts in the world. Production of raw nuts in India during 2016-17 was 779,335 MT as against the estimated production of 670,300 MT during 2015-16. Vietnam, Brazil Tanzania, Ivory Coast, Guinea,Bissau, Mozambique and Indonesia are the other main raw nut producing countries in the world. The total raw cashew nuts imported into India during 2016-17 was 770,446 MT valued at 8839.42 crore which was 958,339 MT valued at 8561.01 crore in 2015-16. The substantial increase in the value of imported raw cashew nuts was due to the change in the unit price of raw cashew nuts from 89.33 per kg to 114.73 per kg. Import of raw cashew nuts through Cochin Port which was 157905 MT in 2015-16 declined by 45 per cent to reach 86821 MT in 2016-17.
Exports of Coffee
Export of coffee from India during 2016-17 was reported as 35,5665 MT (provisional) valued at 5,634.84 crore. There is an increase of 11.83 per cent in quantity and 8.87 per cent in value over the previous year in which export was 31,8039 MT valued at 5,175.61 crore. Export of coffee from Kerala through Cochin Port during 2016-17 was 5,5874 MT valued at 885.22 crore, as against 54720 MT valued at 858.16 crore in 2015-16. The 3 per cent decrease in the value is due to the fall in price of coffee.
Exports of Tea
Export of tea from India during 2016-17 was reported as 227,630 MT valued at 4,632.50 crore against 2,329,209 MT valued at 4,493.1 crore in 2015-16. The export slightly decreased by 2.27 per cent while the value increased by 31.02 per cent. Export of tea from Kerala ports stood at 69,706 MT valued at 1,025.34 crore in 2015-16 as against 69,343 MT valued at 948.78 crore in 2014-15. The exports slightly increased by 0.52 per cent in volume and 8.07 per cent in terms of value. (Table 3.4.4).
| Year | Kerala | India | ||
| Quantity | Value | Quantity | Value | |
| 2010-11 | 48104 | 552.12 | 222019 | 3058.31 |
| 2011-12 | 71784 | 742.87 | 214355 | 3304.83 |
| 2012-13 | 69017 | 904.62 | 216231 | 4005.93 |
| 2013-14 | 75036 | 1064.67 | 225764 | 4509.09 |
| 2014-15 | 69343 | 948.79 | 199077 | 3823.64 |
| 2015-16 | 69706 | 1025.34 | 232920 | 4493.10 |
| 2016-17* | - | - | 227630 | 4632.50 |
| *April-September. Source: Tea Board, India. |
||||
Coir and Coir Products
Export of coir products from India increased from 7,52,020 MT in quantity and 1901.43 crore in terms of value in 2015-16 to 9,57,045 MT valued at 2,281.64 crore in 2016-17. In terms of quantity exports increased by 27.26 per cent and 19.19 per cent in terms of value. Main items of exports are coir pith, coir fibre, tufted mat, coir mat, coir yarn, handloom mat/mattings, geo textiles and other coir products. Leading market of coir products in value terms during 2016-17 are USA(23 per cent), Netherland (8 per cent) and UK ( 4.85 per cent). USA imported 133,536.72 MT coir products worth 532.87 crore and Netherland 82487.53 MT worth 181.48 crore during this period. Major market of coir mats/mattings during the period 2011-17 were USA& UK. USA imported 595.89 MT coir mats worth 6.27 crore and 28,604.63 MT coir mattings worth 301.60 crore during this period. Major market of coir yarn during the above period was Netherlands followed by Italy. The Netherlands imported 1,547.89 MT of coir mats worth 11.69 crore during this period.
Export trend of coir and coir products through Cochin Port for the period from 2010-11 to 2016-17 is shown in Figure 3.4.2.
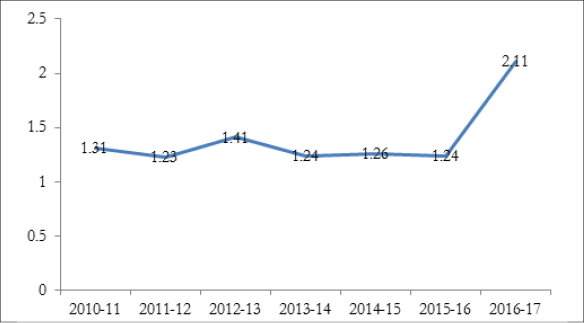 Source: Cochin Port Trust.
Exports of Spices
Indian spices exports continue its upward trend and attained an all time record in 2016-17 in both volume and earnings. During the above period, a total of 947,790 MT of spices and spice products valued at 17,664.61 crore was exported from India, as against 843,255 MT with a value of 16,238.23 crore in 2015-16. It indicates an increase of 12.39 per cent in volume and 8.78 per cent in value.
The export of spices from Kerala (through Cochin and Thiruvananthapuram Ports) decreased to 84,656.95 MT valued at 3,857.88 crore in 2016-17 from 10,0076 MT with a value of 3,905.18 crore during 2015-16, registering a decline of 1.21 per cent in value and 15.41 per cent in volume. Pepper, cardamom, chilli, turmeric, coriander, cumin, fenugreek, other seed spices, nutmeg and mace, other miscellaneous spices, curry powder/mixture, spice oils and olernes and mint products are the main spices exported through Kerala’s ports. Even though total export of spices from Kerala decreased during 2016-7, export of certain spices like turmeric, cumin, celery, fennel, fenugreek, garlic, nutmeg, mace and curry powder/mixture increased both in volume and value during the review period compared to the previous year.