The Gender Inequality Index (GII) issued by UNDP every year since 2010 has placed India in the position of 125 in a list of 159 nations (Human Development Report, 2016). The GII captures the three core areas of gender inequality namely, 1) reproductive health (measured by maternal mortality ratio and adolescent birth rates), 2) empowerment (measured by proportion of parliamentary seats occupied by females and proportion of adult females and males with secondary education) and 3) economic status expressed as labour market participation; India however has scored a higher inequality score of 0.563 whereas the top 10 countries' score remained less than 0.05. This indicates the ineffective policies of our government and its gross failure to deal with gender inequalities. It is well known that India, unlike some other Asian developing economies, has posted very low female work participation rates (WPRs), which in fact have also shown a declining trend despite high growth rates since the mid-2000s. An IMF working paper says that India, which has one of the lowest female labour force participation rates among developing nations, needs to increase the number of women workers to boost economic growth. India's female labour force participation in 2011-12, at 33 per cent, was substantially less than the 50 per cent global average. ‘Depending on the relevant policies, economic growth could increase by between 1.5-2.4 percentage points per annum,' the paper said (IMF, 2015)1. Hence it makes economic and business sense to increase women's work participation rates. The Human Development Report published in the year 2015 observed that the continued plight of women in the country signify the “need of critical policy intervention, proactive thinking and public policy to overcome systematic disadvantages of women” (HDR, 2015).
While the national scenario continues, the State of Kerala, known for its model of social development, reported counter currents with regard to the position of women in the State. The State has remained the only one in the whole country to have a consistent positive sex ratio with a proportion of 1,084 females for 1,000 males reported in the 2011 Census. The impressive record of the State with regard to human development indicators impacted on the status of women as well. In the Gender Inequality Index mentioned above the State's performance in terms of low maternal mortality rate, low adolescent birth rates and a high proportion of adult females with secondary education have remained quite impressive. However, the State is yet to improve its performance in order to translate its achievements with regard to two important indicators, increased participation of women in the realms of economy (labour market) and at higher levels of governance structures in politics.2 The labour market participation and proportion of Parliamentary seats occupied by females show that Kerala's figures are very poor and even below the low all India average. This suggests a paradoxical situation, where the achievements of women in education and their health status remain quite impressive while at the same time their economic and political position (at higher levels) remains below average.
An intriguing question in the case of Kerala vis a vis all India is why despite a much smaller proportion of women engaged in collecting fuel, fodder and water3 as revealed by the NSSO data 2011-12 (as shown later) and hence a much lower burden of the most onerous tasks within the household, women in Kerala are increasingly exiting the work force even as job seekers. Female unemployment rates in Kerala are over five times the all India figures; in rural areas educated unemployment rate is as high as 25.8 per cent (9.7 per cent for all India). However, the unemployment rate has also shown a decline in the latest period and the proportion of work seekers among women has declined, suggesting a discouraged worker effect. The specified activities in the NSSO data are unable to capture specifically the work women do at home in Kerala. But even if they did, a large part of it would be unpaid or minimally productive and hence not perceived as work at all.
The State Planning Board constituted a Working Group on Gender as part of the formulation of the 13th Five-Year Plan (2017-22). It undertook a thorough review of the problems relating to (a) creating large scale employment for women and other vulnerable sections through necessary skill acquisition; (b) prevention of gender based violence, redressal and rehabilitation; (c) increasing public investment in women's unpaid household work, in particular child and elderly care; (d) strengthening gendered governance at the local level; (e) addressing problems of transgenders; and (f) integrating Gender Responsive Budgeting with the Planning process in each Department. Different sections of Working Group Report deal with women and work, education and skill development, migrant women workers, issues of marginalised sections, LGBTs and women and local governance (Box 4.3.1).
Working Group has made recommendations on Women's Work, Employment and Skill Development with five sets of policy links which indicate the need for proactive interventions in five areas:
Likewise, in order to address the gender based issues in education, several projects like gender sensitisation trainings to teachers and students, change in the curriculum, short term courses on gender etc. have been suggested.
Addressing violence against women, projects were suggested by considering three aspects of the issue, viz, prevention, redressal and rehabilitation. Working Group also discussed and made specific recommendations regarding the critical areas for interventions for LGBT. The Working Group identified and suggested a) Positive and protective measures to ensure access to secure livelihoods and adequate income; b) Full access to education and assured safety in educational institutions; c)Measures and institutional structures, including networks to ensure full citizenship; and d)Aid to protect privacy and affective ties/alternate domestic spaces for TG persons.
While addressing the area of Decentralizing Governance and Centering Gender, the Working Group has made specific recommendations on Gender Budgeting and Gender Auditing and Gender sensitive/gender transformatory planning at local bodies. The issues of women of vulnerable communities like dalits, fishing community and endosalfan affected areas have specially been addressed.
Demographic Features
With 52 per cent of the population consisting of women, Kerala is a State known for its positive sex ratio. The overall sex ratio of Kerala is 1,084 females per 1,000 males up from 1,058 in 2001 (Appendix 4.3.1). Though child sex ratio has remained more or less constant over the period 1991-2011, yet a fall from 963 in 2001 to 959 in 2011 was a matter of concern. Still, according to 2011 Census, the child sex ratio of Kerala was much better than the national average of 914. However, as per the National Family Health Survey of 2015-16, the sex ratio of age below five population is positive towards girls. It is depicted in Figure 4.3.1.
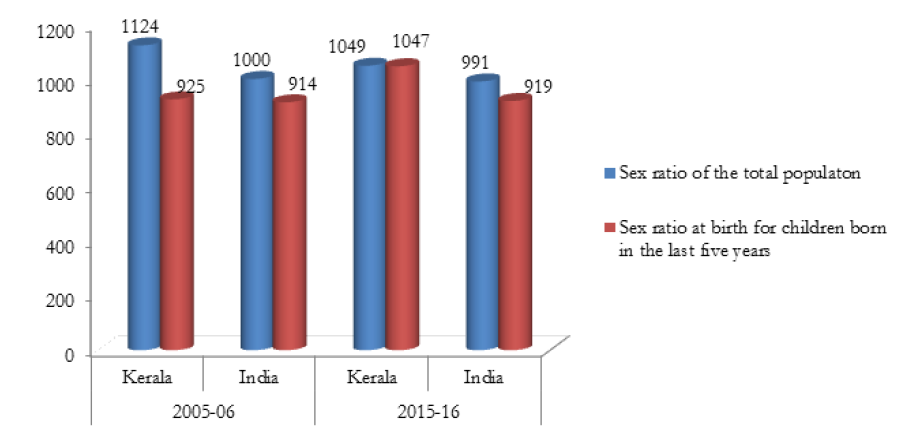 Source: NFHS Report, 2015-16
The proportion of child population in the age group 0-5 constitutes 7.5 per cent while it is higher in India with 9.7 per cent. But the proportion of population in the age group of 60 years and above in Kerala is much higher (12.6 per cent) than that of all India average (8 per cent). The age wise composition of population as depicted in
Table 4.3.1 clearly indicates that the proportion of child population is lower than that of aged population in Kerala while the situation is reverse in the case of all India average (Appendices 4.3.2, 4.3.3, 4.3.4 and 4.3.5).
| Age Group | Total | Rural | Urban | |||||||
| Total | Male | Female | Total | Male | Female | Total | Male | Female | ||
| Age Group 0-5 | India | 9.7 | 9.9 | 9.5 | 10.3 | 10.5 | 10.1 | 8.2 | 8.3 | 8 |
| Kerala | 7.5 | 8 | 7.1 | 7.5 | 8 | 7.1 | 7.5 | 8 | 7 | |
| Age Group 0-14 | India | 29.5 | 30 | 28.8 | 30.9 | 31.5 | 30.3 | 25.5 | 26.1 | 24.9 |
| Kerala | 23.2 | 24.8 | 21.7 | 23.3 | 24.9 | 21.8 | 22.8 | 24.4 | 21.4 | |
| Age Group 15-59 | India | 62.5 | 62.2 | 62.8 | 61 | 60.7 | 61.3 | 66.6 | 66.2 | 66.9 |
| Kerala | 64.3 | 63.4 | 65 | 64.1 | 63.3 | 64.9 | 64.7 | 63.8 | 65.6 | |
| 60 and above | India | 8 | 7.7 | 8.4 | 8.1 | 7.8 | 8.4 | 7.9 | 7.6 | 8.2 |
| Kerala | 12.6 | 11.8 | 13.3 | 12.6 | 11.8 | 13.4 | 12.4 | 11.8 | 13 | |
| Source: Census of India, 2011 | ||||||||||
The sex wise composition of population is favourable to women in Kerala for the group above 15 years of age in both urban and rural areas. Up to 14 years of age, the proportion of male population is higher both in India and Kerala though the difference is comparatively low in Kerala.
Literacy and Education
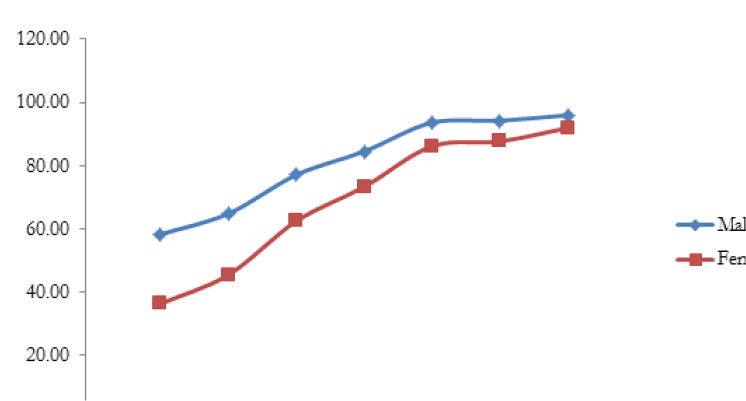
At 92 per cent, the female literacy rate in Kerala is the highest among Indian States. Still a small gender gap exists. But it is seen that the gender gap has narrowed during these 6 decades. (Figure 4.3.2).
 Source: Kerala State Literacy Mission Authority
The educational status of adult women as captured by National Family Health Survey also reveals a positive picture of Kerala in comparison to the all India average. The percentage of women who completed 10 years of schooling and more in the State is more than double that of India (Table 4.3.2).
| Indicators | 2005-06 | 2015-16 | ||
| Kerala | India | Kerala | India | |
| Women who are literate (%) | 93 | 55.1 | 97.9 | 68.4 |
| Men who are literate (%) | 95.5 | 78.1 | 98.7 | 85.7 |
| Population (female) age 6 years and above who ever attended School (%) | 89.8 | 58.3 | 95.4 | 68.8 |
| Women with 10 or more years of schooling (%) | 48.7 | 22.3 | 72.2 | 35.7 |
| Source: NFHS-4, 2015-16 | ||||
In case of education, enrolment is universal at the primary level and gender parity has been achieved; girl students constitute 48.98 per cent of total student enrolment in schools. Girls outnumbered boys in terms of enrolment in higher secondary education at 51.84 per cent. Dropout rates are low for both boys and girls. At the tertiary level also, the enrolment of girls is higher than boys. For example, girls constitute 68.6 per cent of total enrolment for degree courses in various Arts and Science colleges under the four general universities in Kerala during 2016-17. When post graduation is considered, the girls' position is highest with 69.24 per cent. Hence, girls perform well in terms of education in Kerala. But when the intake of girls in engineering colleges and polytechnics is considered, the situation is different. Out of the total enrolled students, girls constitute only 43.74 per cent in engineering colleges and 33.18 per cent in polytechnics (Table 4.3.3). The high levels of education of women do not; however, appear to be translated into marketable skills reflected in low levels of work force participation.
| Boys | Girls | Total | % of Girls | |
| School Education | 1,877,953 | 1,802,787 | 3,680,740 | 48.98 |
| Higher Secondary | 183,979 | 198,072 | 382,051 | 51.84 |
| Graduation | 81,448 | 177,962 | 259,410 | 68.60 |
| Post Graduation | 11,116 | 25,021 | 36,137 | 69.24 |
| B Tech (Govt Colleges) | 9,083 | 6,536 | 15,619 | 41.85 |
| M Tech (Govt Colleges) | 662 | 944 | 1,606 | 58.78 |
| Total Engineering | 4,404 | 3,424 | 7,828 | 43.74 |
| Polytechnic | 18,616 | 9,245 | 27,861 | 33.18 |
| Source: DPI, DCE and DTE, 2017 | ||||
Health Status of Women in Kerala
In Kerala, most of the health indicators are highly favourable to women. Health indicators of women in Kerala are much better than their counterparts in the country as well as their male counterparts in the State. Life Expectancy at birth of women in Kerala at 76.9 years is the highest in India; much higher than for women in India as a whole, which is 67.7 years. As per the figures released by Registrar General of India, all the demographic indicators seem to be favourable to women of Kerala (Table 4.3.4).
| Sl. No. | Indicator | Kerala | India | |
| 1 | Death Rate | 6.6 | 6.5 | |
| Male | 7.6 | 6.9 | ||
| Female | 5.7 | 6.1 | ||
| 2 | Infant Mortality Rate | 12 | 37 | |
| Male | 10 | 35 | ||
| Female | 13 | 39 | ||
| 3 | Maternal Mortality Rate | 61 | 167 | |
| 4 | ||||
| Mean age at effective marriage | Male | 27.3 | 23.2 | |
| Female | 21.4 | 20 | ||
| 5 | Expectancy of Life at Birth | Male | 71.4 | 62.6 |
| Female | 76.9 | 67.7 | ||
| Source: SRS Bulletin, Govt of India and Directorate of Health Services, Kerala | ||||
According to the National Family Health Survey Report of 2015-16, in Kerala as well as in India, the percentage of women whose Body Mass Index is below normal is high compared to their male counterparts even though compared to all India average Kerala women are better off. But in the case of obesity, the percentage of women in Kerala is higher than that of India as well as that of their male counterparts in the State. In case of anaemia, though Kerala's situation is better than that of all India average, it is seen that the percentage has increased between 2005-06 to 2015-16 (Table 4.3.5).
| Indicator | 2005-06 | 2015-16 | ||||||
| Kerala | India | Kerala | India | |||||
| Male | Female | Male | Female | Male | Female | Male | Female | |
| Body Mass Index (BMI) below normal (%) | 21.5 | 18.0 | 34.2 | 35.5 | 8.5 | 9.7 | 20.2 | 22.9 |
| Overweight or obese (%) | 17.9 | 28.1 | 9.3 | 12.6 | 28.5 | 32.4 | 18.6 | 20.7 |
| % of anaemic (age 15-49 years) | 8.0 | 32.8 | 24.2 | 55.3 | 11.3 | 34.2 | 22.7 | 53 |
| Blood Sugar high | NA | 13.1 | 8.7 | 8.0 | 5.8 | |||
| Hyper tension above normal | 7.5 | 5.5 | 10.4 | 6.7 | ||||
| Source: NFHS-4, 2015-16 | ||||||||
However the State has to do much more in certain areas which had been identified in the 11th Five-Year Plan but on which progress has been slow or has to be strengthened: (a) occupational health and (b) violence as a public health issue.
Occupational health
Despite the entry of women into the paid labour market, however low, the sexual division of labour within the household persists. An important consequence of combining the tasks of production and reproduction is that it affects the well being of women through strenuous long hours of work, with very short breaks and irregular meals, even more so if the work (transplanting of paddy, cashew shelling/peeling, coir spinning, cotton spinning, handloom weaving, fish processing) is prone to occupational hazards. For the poor working women the wages received are no compensation for the high work intensity. The Welfare Funds which exist in most of these sectors do not normally provide health support; some do have provision for maternity benefit but very few are able to avail of it. Some steps have been taken by the Factories and Boilers Department to study the health hazards suffered because of being engaged in some specific occupations. A Study on “Health hazards of cashew workers” has already been completed and the Department is yet to undertake study in other areas. This area needs special focus.
Violence as a Public Health Issue
Gender based violence (GBV) is a human rights violation and is increasingly being recognised as a public health issue resulting in short term and long term health consequences, including mental illness and complications in pregnancy. The response of health services to domestic violence has now become an international priority in addressing GBV. The health care providers are most ideally placed to recognise victims of violence and to help them; to undertake screening for identifying women who experience violence which would lead to appropriate intervention and support. This requires intense training and gender sensitisation of health providers. They need to learn to talk routinely and non-judgmentally to clients about violence, become more aware of signs to identify victims of violence. Schemes like Bhoomika and Seethalayam catering specifically to such women were initiated in the 11th Five-Year Plan and are playing a useful role; however, changes have occurred over the years with the National government announcing the One-Stop Centres in 2015 to provide all round support to women in distress. This year the Government of Kerala hopes to get sanction for 5 more centres besides the 9 they have already got. The centres will come up with the assistance of the Central Government and the National Health Mission (NHM) has introduced a Sexual Assault Forensic Evidence (SAFE) kit for doctors that would help them collect all samples in sexual assault cases. A major step of the current government which is for the first time in the country is that SAFE kit is being introduced for doctors in Kerala.
Women's Participation in Employment
In countries with high human development, the share of economically active women seems to be high. Labour Force Participation Rate (LFPR) of women in 10 countries having highest Human Development Index is around 60 per cent and that of men is around 70 per cent (Human Development Report, 2015). It is surprising to note that Female LFPR is much higher in some of our neighbouring countries, whose HDI rank is lower than that of India. For example Female LFPR in Bhutan is 66.4, in Cambodia is 78.9, in Bangladesh is 57.3, in Nepal is 54.3, and in Myanmar is 85.7.(Source: HDI Report 2014).
While tremendous changes have occurred in women's employment in the last few decades with women moving into paid work outside the home, earning a wage and experiencing a semblance of autonomy, there is also a realisation of how much less they are paid than men a gender gap which not only has persisted but has increased over time. They are often still in part time jobs, or the growing informal economy with little protection and few rights. At the same time data shows that young women surpass men in educational attainment (except in technical/engineering fields); in arts and sciences over half of the students are girls. However, their presence in the labour market has been lower than men and more worrying is the very slow progression into positions of leadership. As a recent ILO Report on gender gaps in the labour market reveals:
Gender gaps are one of the most pressing challenges facing the world of work today. Globally, women are substantially less likely than men to participate in the labour market, and once in the workforce, they are also less likely to find jobs than men. Indeed, their access to quality employment opportunities remains restricted. Overall, for example, women are more likely to work longer hours than men when both paid and unpaid work is taken into account. Moreover, when in paid employment, on average, women work fewer hours for pay or profit either because they opt to work part-time or because part-time work is the only option available to them. These gender gaps persist despite the preference of most women worldwide to work in a paid job – underlining the fact that women's choices are constrained by a number of factors (World Employment Social Outlook: Trends for Women 2017, ILO).
It cannot be ignored that less women in labour force means under-utilisation of human resources that holds back production and economic growth.
Women of Kerala outperform their male counterparts in many developmental indicators. But in the case of economically active persons, the outcome is not favourable to women. There are two major sources of data on workers, unemployed, and non-workers Census and the Quinquennial Rounds on Employment-Unemployment of the NSSO. Given the more inclusive definition of “worker” in the NSSO, the latter is generally used for understanding the employment situation in a country/State. The Census has the advantage of readily available data at a disaggregated regional level of the district or even lower. We have largely used the NSSO data in this write-up.
As per the 68th Round of NSSO (for the year 2011-12), a wide gap between male and female LPRs (principal and subsidiary status) is seen in the State. While the State average is 40.3 per cent, female LPR (per 100 persons) in Kerala is 24.8 per cent and that of male is 57.8 per cent. Consequently the difference between male and female LPR in Kerala is very high. Himachal Pradesh with a female workforce participation rate of 49.8 per cent is the best performer. It is surprising that the North-eastern States like Nagaland, Sikkim, Manipur, Mizoram, Arunachal Pradesh and Meghalaya too have higher FWPRs than Kerala. Hence we have to relook at our strategies in this direction; the need to empower Kerala women with decent employment is urgent.
Disaggregating by region, we find that the labour force participation rate of women in rural Kerala is lower than that of India. But in urban areas, labour force participation of Kerala women is better than that of their counterparts at the all India level. Table 4.3.6.
| Year | Rural | Urban | ||||||
| India | Kerala | India | Kerala | |||||
| Male | Female | Male | Female | Male | Female | Male | Female | |
| 1987-88 | 54.9 | 33.1 | 55.8 | 33.6 | 53.4 | 12.9 | 59 | 26.1 |
| 1993-94 | 56.1 | 33 | 56.8 | 26.4 | 54.3 | 16.5 | 59.9 | 25 |
| 1999-2000 | 54 | 30.2 | 58.7 | 27.3 | 54.2 | 14.7 | 59.1 | 25.4 |
| 2004-05 | 55.5 | 33.3 | 58.9 | 32.1 | 57 | 17.8 | 58.3 | 30.1 |
| 2009-10 | 55.6 | 26.5 | 58.3 | 26 | 55.9 | 14.6 | 56.4 | 23.3 |
| 2011-12 | 55.3 | 25.3 | 58.3 | 25.8 | 56.3 | 15.5 | 56.7 | 22.2 |
| Source: Various Reports of NSSO | ||||||||
A comparison of labour force participation of males and females in Kerala is shown in Figure 4.3.3. It is seen that the gender gap is widening over the period. The gender gap in levels of employment is also brought out by the female work participation rates (Table 4.3.7) and while the male WPRs show a mild upward trend or constancy, there is a declining trend in female WPRs; that Kerala women have a higher participation rate in urban areas vis-a vis all India is also seen.
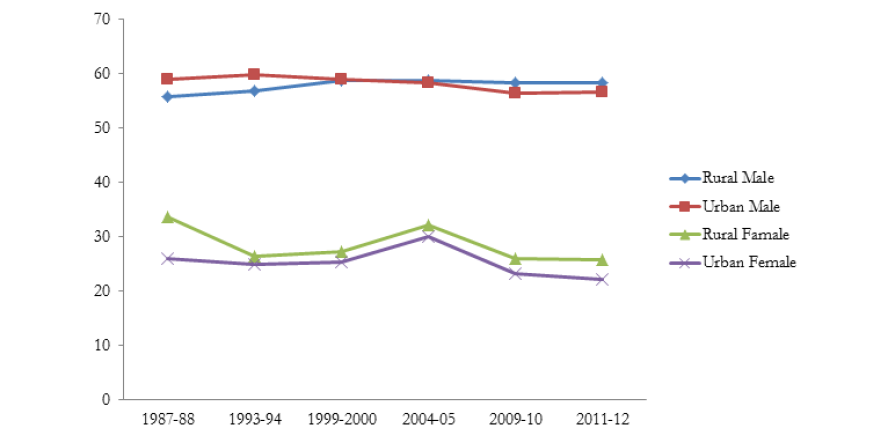 Source: Various Reports of NSSO
| Year | Rural | Urban | ||||||
| India | Kerala | India | Kerala | |||||
| Male | Female | Male | Female | Male | Female | Male | Female | |
| 1987-88 | 53.9 | 32.3 | 56.7 | 31.6 | 50.6 | 15.2 | 59.2 | 21.8 |
| 1993-94 | 55.3 | 32.8 | 53.7 | 23.8 | 52 | 15.4 | 56 | 20.3 |
| 1999-2000 | 53.1 | 29.9 | 55.3 | 23.8 | 51.8 | 13.9 | 55.8 | 20.3 |
| 2004-05 | 54.6 | 32.7 | 55.9 | 25.6 | 54.9 | 16.6 | 54.7 | 20 |
| 2009-10 | 54.7 | 26.1 | 56.4 | 21.8 | 54.3 | 13.8 | 54.7 | 19.4 |
| 2011-12 | 54.3 | 24.8 | 56.5 | 22.1 | 54.6 | 14.7 | 55.2 | 19.1 |
| Source: Various Reports of NSSO | ||||||||
Table 4.3.8 reveals the district wise gender disparity in LFPR. Malappuram recorded the lowest Female LFPR with 12 per cent in rural areas and 8 per cent in urban areas while the respective figures for men are 49 and 43 per cent. Kasargod and Idukki districts have lower gender gap in LFPR both in urban and rural areas respectively. The gender disparity in LFPR is highest in Kozhikode both in urban and rural areas with the gaps of 43.6 and 44.5 respectively.
| Rural | Urban | |||
| District | Male | Female | Male | Female |
| Thiruvananthapuram | 54.4 | 23.9 | 53 | 20.6 |
| Kollam | 53.3 | 21.6 | 54.2 | 28 |
| Pathanamthitta | 62.6 | 25.7 | 56.7 | 15.6 |
| Alappuzha | 58.9 | 24.8 | 56.4 | 22.2 |
| Kottayam | 61.9 | 26.2 | 52.1 | 18.7 |
| Idukkki | 60.7 | 38.5 | 47.7 | 19.3 |
| Ernakulam | 58.9 | 25.9 | 56.9 | 22.2 |
| Thrissur | 56 | 20.3 | 54.5 | 20.9 |
| Palakkad | 51.9 | 20.9 | 53.9 | 16.8 |
| Malappuram | 48.9 | 11.6 | 42.4 | 7.6 |
| Kozhikode | 56.2 | 12.6 | 55.3 | 10.8 |
| Wayand | 61.4 | 22.3 | 56.1 | 27.9 |
| Kannur | 57.7 | 22 | 52.1 | 14.5 |
| Kasargod | 51.6 | 31.8 | 43.1 | 18.9 |
| All | 55.6 | 21.4 | 53.7 | 17.7 |
| Source: NSSO 68th Round (pooled data, Department of Economics and Statistics, GOK | ||||
Gender Gap in Worker Population Ratio (WPR)
The gender gap in WPR under usual status is given in Figure 4.3.4. In both rural and urban areas, female WPRs are considerably lower than male WPRs.Among the districts, Idukki records the highest female WPR in rural areas (35 per cent) while female WPR in urban areas is highest in Wayanad with 23 per cent (Appendix 4.3.6). In both the sectors, Malappuram reported the lowest female WPR with 7 per cent in rural and 5 per cent in urban areas and Malappuram is preceded by Kozhikkode with 10 per cent in rural and 9 per cent in urban.
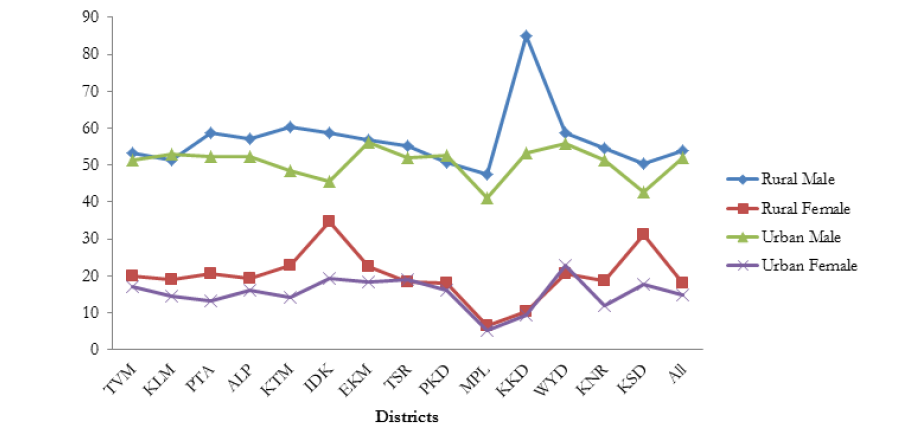 Source: NSSO 68th Round (pooled data, Department of Economics and Statistics, GOK
Both the Census and NSSO estimates depict a picture of low work participation rates of women. As is well known it has been debated extensively in the literature that work participation of women is much higher than what is measured, given the invisibility or non-recognition of economic work that women do at home. Both the investigator (from the official sources of data collection) and women themselves do not perceive the work status of home based women workers, despite intensive efforts at broadening the concept of work. To capture this to some extent, Table 4.3.9 shows that a proportion of women who are enumerated as ‘usually' engaged in household duties and hence non-workers, perform a number of economic activities at home-like poultry keeping, kitchen garden, tailoring etc.
| S No. | Activity | All India Rural |
All India Urban |
Kerala Rural |
Kerala Urban |
| 2011-12 | 2011-12 | 2011-12 | 2011-12 | ||
| 1 | Maintenance of kitchen garden | 23.3 | 7.8 | 16.5 | 11.3 |
| 2 | Maintenance of animal resources | 21.5 | 2.4 | 14.2 | 5.3 |
| 3 | Free collection of fuel/cattle feed | 43.5 | 5.3 | 16.5 | 3.6 |
| 4 | Preparation of cowdung cake | 40.9 | 4.6 | 0.7 | 0.1 |
| 4 | Fetching water from outside | 30.6 | 9.6 | 7.7 | 6.0 |
| 5 | Sewing/tailoring etc | 27.3 | 23.5 | 10.0 | 11.7 |
| 6 | Tutoring own children or other children for free | 6.8 | 12.0 | 12.2 | 13.7 |
| Source: NSSO 68th Round: Participation of Women in Certain Specified Activities along with their Household Duties, Report No.559 | |||||
The role of self employment in enhancing the share of economically active women is very important in a State like Kerala where the educational level of women is very high and women appear unwilling to take up wage employment in low paid informal jobs. Surprisingly, even with a large number of opportunities for self employment, the share of female self employed workers seems to be significantly lower in Kerala than many other States in India. The percentage of female self employed workers (FSEW) in Kerala is 36.4 in rural areas and that in urban areas is 36.3. But in rural areas, percentage of FSEW is 89.5 in Arunachal Pradesh, 87.9 in Himachal Pradesh, 94.9 in Nagaland and 90.2 in Sikkim. In all these North Eastern States, FWPR is above 35 per cent (NSSO Report, 68th Round).
Gender disaggregated data on employment can capture more clearly a picture of women's economic involvement. The sectoral distribution of employment of women in Kerala (Table 4.3.10) shows that relative to men, a larger proportion of women are engaged in the agricultural sector. The percentage share of males engaged in service sector is much higher compared to females; however in the industry sector the relative proportions are not very different; but a further disaggregation would show that this is because large numbers of women are engaged in low productivity, labour intensive traditional industries like handlooms, khadi, coir and cashew.
| Persons | Agriculture | Industry | Service |
| Male | 22.8 | 32.4 | 44.8 |
| Female | 31.9 | 30.4 | 37.7 |
| Total | 25.5 | 31.8 | 42.7 |
| Source: NSSO Report, 68th Round. | |||
Membership of females in different Welfare Fund Boards in Kerala shows the participation of women in some specific industries (Appendix 4.3.7). It is clear that women's participation in traditional industries is very high in which wage/remuneration is comparatively low. For example, among cashew workers and beedi workers, women constitute 95 per cent and 99 per cent of the work force respectively.
Together with low and declining female work force participation rates in Kerala, the inferior economic position of women is aggravated further by high rates of unemployment, in particular of educated women (Table 4.3.11). This suggests that there are large numbers of women who are seeking or available for work but unable to find it. The fact that the unemployment rate shows a fall in the recent year, even as work participation rate has also declined suggests that one of the reasons could be a ‘discouraged worker' effect pushing women out of the workforce due to long waiting periods in the labour market for work. Some scholars argue that the decline in female work participation rate could be on account of ‘income effect', that is with a growth in household income there is a tendency for women to withdraw from labour force. Needless to state this requires further probing.
| Year | Rural | Urban | ||||||
| India | Kerala | India | Kerala | |||||
| Male | Female | Male | Female | Male | Female | Male | Female | |
| 1987-88 | 1.8 | 2.4 | 5.2 | 6.00 | 5.2 | 6.2 | 6.0 | 6.3 |
| 1993-94 | 1.4 | 0.8 | 5.5 | 6.6 | 4.0 | 6.2 | 6.6 | 18.7 |
| 1999-2000 | 1.7 | 1.0 | 5.7 | 5.6 | 4.5 | 5.7 | 5.6 | 20.0 |
| 2004-05 | 1.6 | 1.8 | 5.1 | 6.2 | 3.6 | 6.9 | 6.2 | 33.4 |
| 2009-10 | 1.6 | 1.6 | 3.2 | 2.9 | 2.8 | 5.7 | 2.9 | 16.8 |
| 2011-12 | 1.7 | 1.7 | 3.1 | 14.2 | 3.0 | 5.2 | 2.7 | 13.9 |
| Source: Various Reports of NSSO *Department of Social Justice,State Policy for TGs in Kerala, 2015, p.8 |
||||||||
Inequality in Wage Rates
Women are engaged in agricultural work as well as in traditional industries (which are mainly coming under informal and unorganised sector) in India as well as in the State (Census, 2011). But in terms of wages and remuneration, significant gender inequality exists in unorganised sector. The prevalence of inequality in the wage rates among men and women especially in unorganised and agricultural works have been detailed in the section Labour and Labour Welfare of Chapter 4.
Economic empowerment and social empowerment are complementary to each other. The economic empowerment of women is attained when they become an integral part of labour force and be gainfully employed without having to bear the full burden of household and care responsibilities. It is necessary that this is recognised, and efforts are taken to reduce and redistribute unpaid household and care work in more just ways promoting shared responsibility within the household, and the State playing a crucial role in designing appropriate policies/schemes that support its reduction and redistribution.
Women in Political Leadership
Political representation is taken as an important dimension to measure gender position in many of the indices currently being used. For example, Gender Inequality Index developed by UNDP measures empowerment by the proportion of parliamentary seats occupied by females. The Global Gender Gap Report brought out by World Economic Forum measures political empowerment, economic participation and opportunity, educational attainment and health and survival.
Achievements in health and education have empowered the women of Kerala and enabled them to take part in the practices of democracy. It is an essential condition for democratic citizenship which will be complete only when the women get equal participation in direct decision making too. It is in this regard that the representation of women in legislative bodies becomes important. Political participation must not be restricted to casting votes during elections. Rather women must occupy leadership positions in decision making bodies. Women of the State can be empowered through their direct participation in policy making. An appropriate example is the local governments in Kerala, where 50 per cent of the seats are reserved for women including the higher positions in the local bodies.
However, gender empowerment is politically meaningful only if women have decision making powers in higher bodies like State legislatures and Parliaments. The developed nations with high HDI levels have a much higher representation of women in their legislative bodies. When the top 8 countries of Norway (39.6 per cent), Sweden (44.7 per cent), Iceland (39.1 per cent), Denmark (39.1 per cent), Belgium (38.9 per cent), Finland (42.5 per cent), The Netherlands (37.8 per cent) and Cuba (48.9 per cent) are considered, it can be seen that the percentage of women in legislative bodies is above 37 (The figure in parenthesis is the percentage of women in national parliament in respective country).
However, the achievements of the State with respect to women representation in the Central and State Legislative bodies is not noteworthy. The same is the case when we take women in India as a whole. It is quite surprising that the women's status in the State in this regard is lower than that of many States in India as also the all India average (Table 4.3.12).
| Lok Sabha | ||||||
| Year | All India | Kerala | ||||
| Total No. of Seats | Women | % of Women | Total No. of Seats | Women | % of Women | |
| 2009 | 543 | 58 | 10.7 | 20 | 0 | 0 |
| 2014 | 543 | 62 | 11.5 | 20 | 1 | 5 |
| Kerala Legislature | ||||||
| Kerala Legislative Assembly | Number of Women | Total no of seats | % | |||
| 2006 | 7 | 140 | 5 | |||
| 2011 | 7 | 140 | 5 | |||
| 2016 | 8 | 140 | 6 | |||
| Source: Worked out from data available at the Website of the Lok Sabha, Rajya Sabha and Chief Electoral Officer, Kerala | ||||||
Crimes Against Women
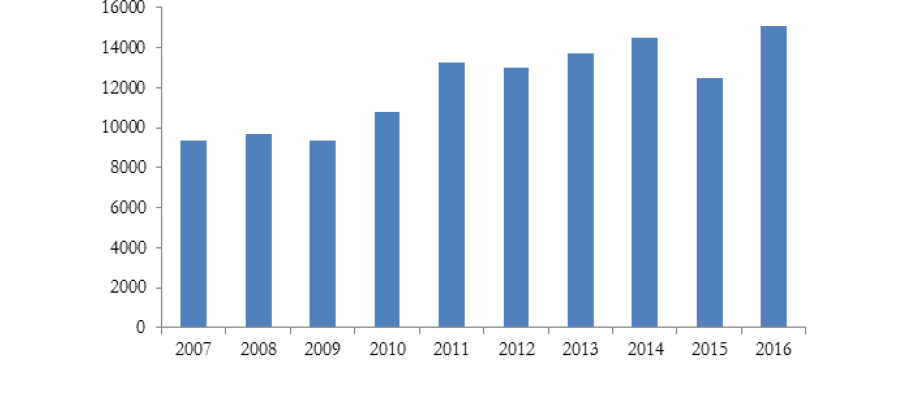
As per the figures brought out by the State Crime Records Bureau, the total reported cases of crime against women are increasing over the period (Figure 4.3.5). The number of ‘Rape cases' has increased from 500 in 2007 to 1,656 in 2016 (Appendix 4.3.8).
 Source: Crimes Records Bureau
The ‘cruelty by husband/relatives' still constitutes a major component in crime against women. Even when we want women to come out of their homes and take up employment, the safety of women is a serious issue. Greater efforts are required in this direction, to enable women to take up gainful economic activities outside the home.
Even though the absolute number of crimes is increasing over the years, it is seen that the proportion of crimes is decreasing. The incidence of crime per lakh of female population has decreased from 1.9 in 2007 to 1.1 in 2016. (Table 4.3.13).
| Year | Estimated female population (in lakh) |
No of crimes reported |
crime per lakh |
| 2007 | 17,426 | 9,381 | 1.9 |
| 2008 | 17,594 | 9,706 | 1.8 |
| 2011 | 17,379 | 13,279 | 1.3 |
| 2016 | 17,366 | 15,114 | 1.1 |
| Estimated from the data from Crime Records Bureau | |||
Transgender Policy in Kerala
It is known that in Kerala, though women may secure many capabilities, often it does not get converted to desired functionings. But the survey conducted by the Social Justice Department on TGs reveals that they are unable to acquire even basic capabilities essential to a life of well-being and dignity. While women's interests and expressed needs are now accepted, at least partially, widespread and intense conservatism denies the same status to the interests and demands of people of non-normative sexual orientations, and though they have gained legal recognition, they face terrible invisibility and violence. “The condition of non-normative sexualities in Kerala cannot be described as only that of deprivation-then lack of resources that cause ill- being. Rather, it is better described as abjection – which refers to a form of ‘enforced invisibility' of these people in the eyes of civil society and the State” (Draft Report of Working Group on Gender, State Planning Board, 2016).
Hence, interventions for inclusion of TGs cannot be limited to merely economic measures. The recent Supreme Court judgments, have given some space to remedy certain of the issues of TGs. While the recognition of all non-normative sexual orientations as legal remains a distant dream still, the Honourable Supreme Court of India (vide Judgment dated April 15, 2014) firmly established the right to equality and equal protection for transgender persons(TGs) and emphasised their right to live free from discrimination on the ground of gender identity. Following the Supreme Court Judgements, to understand the issues faced by TGs, the Social Justice Department of the Government of Kerala (GOK) conducted a State-wide survey seeking information on all aspects of their social and personal life. The survey, which collected information from over 4000 TG individuals, indicated that their population in Kerala may be over 25,000.*
Kerala is the first State in India which declared a Transgender Policy in 2015. GOK has issued a rights based State Policy for Transgenders within a clear results framework. In addition, consistent with the 2014 Supreme Court judgement, the policy allows for the self-identification of a person as a Transgender. The Policy also recommends the establishment of District-level TG Boards that can register TGs and issue identification cards. The Department of Social Justice is planning to establish these Boards as soon as a government order is issued.
Gender Budgeting
As policies and programmes have a differential impact on women and men, it is necessary to strengthen Gender Responsive Budgeting. Gender Budget is not a separate budget for women but one in which gender has been put on the mainstream. The Gender Budget Statement is an important tool for bringing together all information regarding allocations for women. It is now considered as an instrument to address gender inequality and reallocate the resources more favourably to women. It serves as a reporting mechanism and provides an indication of funds flowing to women. Gender Budgeting is a major step in strengthening inclusive growth Kerala is perhaps the first State to undertake a ‘gender aware planning' aimed at a transformatory outcome for women even earlier within the context of decentralised planning in the 9th Five-Year Plan Period. With the inclusion of Women Component Plan (WCP) in local bodies' Annual Plan, an attempt at integrating gender into the budgeting process, a gender-responsive budgeting was introduced in the State of Kerala at the time of the 9th Five-Year Plan itself. With the devolution of 35 to 40 per cent of funds from the State to the Local Self-Government Institutions (LSGIs), the first form of Gender budgeting was seen in the State in 1996 where each Panchayat was directed to prepare a chapter on the status of women in their development Plan document, 10 per cent of the Plan outlay of the local bodies had to be set apart for needs of women or women specific projects. Percentage of Plan allocation and expenditure on WCP of local bodies during 11th and 12th (first three years) are given in Table 4.3.14.
| Five Year Plan | % of WCP allocation | % of WCP Expenditure |
| 11th Plan | 13.22 | 12.35 |
| 12th Plan | 8.84 | 10.22 |
| Source: IKM2017 | ||
It is seen from the table that though 10 per cent is mandatory, in terms of allocation and expenditure, more than 10 per cent of the fund goes to women. Compared to 11th Five-Year Plan, percentage of WCP allocation and expenditure has fallen during 12th Five-Year Plan. Allocation has fallen from 13.22 per cent to 8.84 and expenditure from 12.35 to 10.22. The WCP allocation for the last two year of 12th Five-Year Plan is below the mandatory figure (Table 4.3.15).
| Year | Allocation | Expenditure | ||||
| Total | WCP | % of WCP | Total | WCP | % of WCP | |
| 2012-13 | 3870.32 | 431.01 | 11.14 | 2741.97 | 294.20 | 10.73 |
| 2013-14 | 5057.59 | 530.34 | 10.49 | 3918.27 | 407.47 | 10.40 |
| 2014-15 | 9914.79 | 613.16 | 6.18 | 4033.94 | 441.32 | 10.94 |
| 2015-16 | 6069.18 | 604.57 | 9.96 | 4467.76 | 433.43 | 9.70 |
| 2016-17 | 6629.98 | 610.44 | 9.21 | 3839.88 | 366.35 | 9.54 |
| Total | 31541.86 | 2789.52 | 8.84 | 19001.82 | 1942.77 | 10.22 |
| Source: Annual Plan Documents | ||||||
Since then, there has been considerable debate on the type of schemes/projects implemented under the WCP, some of which may not be gender sensitive. While the special attention given to gender in decentralised planning has left some positive imprints on outcomes and a number of good practices can be identified across the State, WCP has fallen short of expectations on advancing gender equality and is being reviewed in the context of the renewed emphasis on LSGIs and people's participation in the 13th Five-Year Plan.
A conscious attempt was made at Gender Responsive Budgeting in Kerala's 11th Five-Year Plan, integrating gender into the Planning/Budgeting process with a visible increase in Annual Plan allocations flowing to women over the years addressing women's felt needs, including women friendly infrastructure. The problem has been that since many projects benefit both women and men it may not be possible to capture a total estimate of the resource outlay for women due to non-availability of gender differentiated data.
The 13th Five-Year Plan is focussing on Gender Responsive Budgeting. As per the Guidelines of 13th Five-Year Plan, all departments have been directed to address the gender perspective needs during the formulation and implementation of the plans. Since women are more vulnerable, greater focus will be on ensuring that women are mainstreamed in all possible ways. The initiative on Gender Responsive Budgeting aims at categorisation of specific schemes/components/programmes with a direct focus on women and girls. 13th Five-Year Plan aims to include the specific need based programmes to address the concern of women/girls wherever feasible.
The important schemes benefiting women under the major departments are given in Table 4.3.16.
| Sl. No. | Name of the Scheme | Objective of the scheme | |
| Agriculture and Allied Sectors | |||
| 1 | Theeramythri and micro enterprises scheme | Stabilization package to promote diversifications in livelihood activities and to improve the income level of fishermen families through women members of the family | |
| Rural Development Sector | |||
| 2 | Indira AwaazYojana (IAY) | Comprehensive rural housing programme of GOI provides dwelling units to the homeless rural poor | |
| 3 | Mahatma Gandhi National Rural Employment Guarantee Programme | Flagship programmes of GOI for employment generation. Majority of beneficiaries are women | |
| Industries | |||
| 4 | Mahila Coir Yojana | First women oriented self-employment scheme in the Coir industry which provides self-employment opportunities to the rural women artisans | |
| Health Sector | |||
| 5 | Women Health Care Centre (Seethalayam) | Seethalayam provides homeopathic treatment. to women. | |
| 6 | Bhoomika – Gender Based Violence Management centre (GBVMC) |
Provide counseling services and medical and legal assistance to the victims of gender based violence. | |
| 7 | Maternity hospitals, maternity units, Women and children hospitals (included in Ayurveda and Modern Medicine) | For special infrastructure and facilities for women and children | |
| SC and ST Development Sectors | |||
| 8 | Assistance for Marriage of SC girls | 50,000 for the marriage of SC girls below BPL | |
| 9 | Assistance to Marriage of ST girls | 50,000 for the marriage of ST girl and 1 lakh for the marriage of ST orphan girl | |
| 10 | Janani Janma Raksha | Provides maternal care | |
| 11 | Housing scheme for the Divorcees/Widows/Abandoned Women | Housing scheme for the women in these categories | |
| Education | |||
| 12 | Sarva Siksha Abhiyan | To ensure universal elementary education | |
| 13 | Counselling and training programmes for adolescents girls | The programmes are conducted by Directorate of Public Instruction as well as by Directorate of Higher Secondary Education to create awareness | |
| Social Security and Welfare Sector | |||
| 14 | Institutional care to women | There are 17 welfare institutions under the aegis of Social Justice Department (SJD) for the care, protection and rehabilitation of women in distress | |
| 15 | Pension schemes for women | Indira Gandhi National Widow Pension (IGNWP) and pension for unmarried women above 50 years are the major pension schemes. | |
| 16 | Nirbhaya | Envisages setting up of Nirbhaya Homes for sexually abused women. It imparts skill development training for providing employment opportunities. 10 such homes were started in 9 districts and 200 women were provided shelter. | |
| 17 | SOS Model Homes for Nirbhaya Inmates | Envisages to arrange shelter to Nirbhaya inmates just as in SOS homes | |
| 18 | Maternity Benefit Programme | Provides cash assistance to pregnant and lactating women from the end of first trimester of pregnancy upto 6 months after delivery | |
| 19 | One Stop Centre | To support women subjected to violence, in private and public spaces | |
| 20 | Swadhaar Greh | To cater to the primary need of shelter, food, clothing, medical treatment and care of women in distress and who are without any social and economic support. | |
| 21 | Ujjawala scheme | Prevention of trafficking and rescue, rehabilitation and re– integration of victims of trafficking for commercial sexual exploitation | |
| 22 | Gender Park | It is a platform where the State, Non-Government organizations (NGO), academia and civil society can come together for learning and research on gender equality as well as to formulate innovative and new interventions to support the empowerment of women and gender equality | |
| 23 | Beti Bachao Beti Padhao | Financial assistance to the State to empower the girl child and enable her education | |
| 24 | Snehasparsham | Aims to address the problems of unwed mothers | |
| 25 | Rajiv Gandhi Scheme for Empowerment of Adolescent Girls |
It aims at empowering the nutritional and health status of the adolescent girls in the age group of 11-18 years | |
| 26 | Kerala Women Commission | The Commission implements gender awareness programmes and undertakes legal workshops/seminars, adalaths, and DNA test, etc. | |
| 27 | Kerala State Women's Development Corporation |
Self-employment schemes for women, flagship programme on gender awareness and finishing school for girls/women (largely from the poorer households) are the major programmes of the Corporation | |
| Local Self Government Department | |||
| 28 | Kudumbashree | State's poverty alleviation scheme focussing on women members of the family. Kudumbashree works through the Community Organisations at the grass root level. | |
| Source: Plan Documents | |||
It can be seen from the above that development policy in Kerala has been more sensitive to gender equality in terms of human resource development as reflected in the much lower gender gap in basic capabilities, such as education and health. However, this did not result in improving women's position in society. The high ranks in both literacy and health did not translate into growth of paid employment for women nor into upward occupational mobility; female work participation rates (WPR) in Kerala remain low, even among the educated women; levels of gender based violence remain high and insecurity in the public sphere are the disturbing trends. Patriarchy in contemporary Kerala is apparent in a generalised social commitment to women's domestic role, implicit in their withdrawal from the labour force aggravated by high levels of unemployment in particular educated unemployment.
Over time policy approaches to women have changed, from ‘welfare' to ‘development', ‘empowerment' and now ‘inclusion', seemingly towards more gender favourable outcomes. There has been a proliferation of policies, programmes and schemes since then, to assist poor women and address gender gaps in social, economic and political spheres. This has been reflected in the Gender Vulnerability Index (GVI) estimated by Child development NGO Plan India which says that Kerala (with GVI of 0.634) is the safest place for girls in the country next to Goa (with GVI value of 0.649). The composite index has been developed by the research team for the NGO's Plan for Every Child campaign which is aimed at comprehensively understanding the dimensions of various problems affecting children, particularly girls, in difficult circumstances. The GVI report was released by Plan India on November 1 during its national conference in Delhi. This index provides a State-wise ranking which is calculated by analysing four issues pertinent to the situation of girls — child safety/protection, poverty, health and education. The State-wise GVI and ranks are given the Appendix 4.3.9.
1 "Women Workers in India: Why so Few Among so Many" Sonali Das eta l. March 2015, WP/15/55.
2 At the local level, over 50 per cent are elected women representatives which places Kerala among the top States.
3 This implies that such basic services are better available to women in Kerala on average, though there would certainly be regions and socioeconomic groups where deprivation is high.
*Department of Social Justice,State Policy for TGs in Kerala, 2015, p.8.