Over the last two decades, Kerala's experience in decentralisation has been accepted globally as one of the most significant institutional reforms in public governance. Kerala adopted a big bang approach to decentralisation with the launch of People's Plan Campaign on 17th August 1996. The process of decentralised planning was launched in IX Five-Year Plan, consequent to the enactment of Kerala Panchayati Raj Act (1994) and Kerala Municipality Act (1994) and the constitutional amendments. Under the X Five-Year Plan, the decentralisation programme in Kerala was restructured and named "Kerala Development Plan" (KDP). In the XI Five-Year Plan period, the entire process was revamped by giving stress to the concept "People's Planning," focusing on the completion of the institutionalisation of decentralised government. The XII Five-Year Plan approach envisaged some concrete steps to strengthen the planning process with the use of information technology. The second phase of the "People's Plan," campaign has now been inaugurated. The thrust in the XIII Five-Year Plan period is on second-generation social and economic issues confronting the State. The second phase of decentralised planning aims at solving these second-generation problems with genuine people's participation backed by strong administrative and political measures.
The most prominent feature of Kerala's decentralisation is the devolution of Plan resources on formula based, non-discretionary and equitable manner. This has enabled the Local Governments to receive development funds from the State's Plan allocation for implementing schemes formulated at local level. Since the launch of decentralised planning in 1997-98, an average about 25 per cent of the State's investible resources have been devolved to local governments as Development fund. In addition, the State transfers 3.5 per cent of its own tax revenue as General purpose fund and 5.5 per cent of own tax revenue as Maintenance fund every year. Local Governments have absolute freedom in formulating and implementing projects based on their priorities subject to Plan guidelines issued by the State government.
At present, there are 1,200 local governments in Kerala, which include 941 Grama Panchayats, 152 Block Panchayats, 14 District Panchayats, 87 Municipalities and 6 Municipal Corporations. The allocation of development funds to LGs is being done under three categories - General Sector, Scheduled Caste Sub Plan (SCSP) and Tribal Sub Plan (TSP). The outlay for each category during 2011-12 to 2015-16 was fixed on the basis of the recommendations of the IV State Finance Commission (SFC). In the subsequent years, the change in outlay was in accordance with the increase in State Plan outlay. The Commission recommended that at least 25 per cent of the likely Plan size of the State should be devolved to LGs for development purpose. The fund would be inclusive of the devolution from the Central Finance Commission and allocation to LGs for World Bank supported project called the Kerala Local Government Service Delivery Project.
Review of the XII Five-Year Plan
In the beginning of the twelfth Five-Year Plan some changes were made in the Plan guidelines, mainly in sectoral ceilings and project appraisal. There was no mandatory minimum ceiling in productive sector during the first four years. In case of infrastructure sector, the mandatory ceiling was fixed at 45 per cent in Grama Panchayats and Block Panchayats, 55 per cent in Municipalities and Corporations and 50 per cent in District Panchayats under general sector outlay. In addition, 10 per cent of the development fund was mandatorily earmarked for Women Component Plan and 5 per cent to children, old age, differently abled, palliative care and other vulnerable groups. The experience in the first four years was reviewed by the new government in 2016-17 and a decision was taken to restore the mandatory minimum allocation of 20 per cent under productive sector and minimum allocation of 10 per cent for sanitation.
The budget allocation (Development Fund) to Local Governments in the XII Five-Year Plan is outlined in Table 6.1.1.
| Year | State Plan Outlay* | Development Fund to LSGs | % to State Plan Outlay |
| 2012-13 | 14010.00 | 3228.00 | 23.04 |
| 2013-14 | 17000.00 | 4000.00 | 23.52 |
| 2014-15 | 20000.00 | 4700.00 | 23.50 |
| 2015-16 | 20000.00 | 4800.00 | 24.00 |
| 2016-17 | 24000.00 | 5000.00 | 20.83 |
| Total | 95010.00 | 21728.00 | 22.90 |
| *Inclusive of KSEB's contribution | |||
The total development fund available with local governments in a financial year includes unspent balance of the previous year. However, the system of carrying forward the unspent balance to the next financial year was discontinues from April 1, 2016 onwards. In the XII Five-Year Plan, the budgeted outlay of development funds to local governments was 21,728 crore and 19,001.75 crore was utilised (Table 6.1.2).
| Year | Budgeted Outlay | Expenditure | % to Budgeted outlay |
| 2012-13 | 3,228.00 | 2,741.97 | 85.00 |
| 2013-14 | 4,000.00 | 3,918.27 | 98.00 |
| 2014-15 | 4,700.00 | 4,033.94 | 86.00 |
| 2015-16 | 4,800.00 | 4,467.76 | 93.00 |
| 2016-17 | 5,000.00 | 3,839.81 | 76.00 |
| Total XII Plan | 21,728.00 | 19,001.75 | 87.00 |
| *Inclusive of KSEB's contribution | |||
Major Policy Changes Initiated in the First Year of XIII Five-Year Plan
The two decades of Kerala's decentralised planning experience is unique and recognised world over. In the XIII Five-Year Plan period, the State envisages revitalisation of the system of democratic governance by analysing the experiences of the past. The year under review witnessed some major changes in the methodology of local level participatory planning in Kerala. The changes were introduced in accordance with the approach of the Thirteenth Five-Year Plan of the State. The second phase of the democratic decentralisation in Kerala has been initiated with the introduction of a new set of guidelines for formulation and implementation of the Local Government Plans. An important objective of the new guidelines was to simplify the procedures so that delays can be avoided. On account of the cumbersome procedures that existed until now, the Plan formulation and its approval took more time than implementation. Therefore, the Local Governments were forced to rush through the process of implementation during the terminal months of the financial year. It was also responsible for the bunching of payments in the month of March. As a result of the introduction of the new methodology, all the Local Governments in the State could complete the process of formulation of their Annual Plans for 2017-18 before 15 June 2017. This is an unprecedented achievement in the history of local level planning in the State. Accordingly the year also witnessed early beginning of the implementation process. The Local Governments have already started the preparations for making the Annual Plan for 2018-19. The aim is to get it approved well before the beginning of the financial year. As a consequence, it is also hoped that the objective of integrating Annual Plans and the Local Government budgets would be achieved for the first time in 2018-19.
The Thirteenth Five-Year Plan of the State government places special emphasis on the issues arising due to fast moving urbanisationin Kerala. It recognises the importance of developing appropriate strategies and programmes for coping up with challenges and opportunities thrown up by the process of urban growth. Keeping this in view, the Government has issued for the first time a separate set of guidelines for Plan formulation in urban Local Governments. An equally important initiative introduced in the year is the effort to make the district Plans. It is a constitutional mandate that the District Planning Committees make District Plans for integrating development plans prepared by various tiers of governments in the district. The State government has already issued the guidelines for the preparation of the district Plans. The District Planning Committees in the State are now engaged in the task of preparing the District Plans well in advance so that its suggestions can be incorporated in the Local Government Plans for 2018-19.
Although ‘beneficiary committees' were introduced for facilitating people's participation in Plan implementation, as many studies have pointed out, they have over time degenerated as agencies of corruption. The Thirteenth Five-Year Plan proposes to plug such loopholes in the system. The new guidelines, therefore, promotes e-tendering, besides restricting beneficiary committees to areas where they were found effective. The shift in the system of execution of public works is expected to bring about major savings in the cost of public works at the local level.
The new guidelines were designed to extend the autonomy of decision making at the local level. This is sought to be achieved by broadening the scope of subsidies that can be given through local government Plans. Besides the local governments are allowed a window of ‘Innovative Programmes' for designing schemes that are innovative but not allowed under the general rules regarding subsidies.
Other major policy changes are;
Mandatory minimum allocation of 30 per cent for productive sector under general sector fund was ensured in the case of three tier panchayats and 10 per cent in the case of urban local bodies. Also 5 per cent allocation for disabled and children, 5 per cent for old age/palliative population, 10 per cent for WCP and 10 per cent for sanitation were ensured.
Planning Committees were formed in all local government institutions for Plan formulation, implementation and monitoring of Plan schemes. This ensured the active involvement of all stakeholders in the Plan formulation of 2017-18 financial year.
All the local governments in the State prepared Status Reports in 2017-18.
The activities of four Development Missions launched by the Government namely - AARDRAM, HARITA KERALAM, LIFE and Education Mission which seeks to address the developmental problems of the State, are integrated with the Plans of local governments.
To promote multilevel planning and to ensure greater integration between the development needs and priorities of various tiers of local governments and different socio-economic classes in the State and district level, the State initiated formulation of district Plan. Below the State, district occupies a pivotal role in planning because of its administrative advantages. The convergence and integration of various agencies and different tiers of government needs a holistic district development Plan. The co-ordination between various tiers of government and line departments will be strengthened to take up joint projects under district development Plan. In this context comprehensive District Plans which will ensure multilevel planning, will be formulated in districts in XIII Five-Year Plan period. The District Plan formulation intends to achieve a balanced, integrated, and meaningful development of districts through spatial integration, sectoral integration, vertical and horizontal integration of different tiers of government, integration of resources etc. This will help in coordinated development of districts and a closer and more transparent link with State and National priorities.
In accordance with the policy announcement made by the Hon'ble Governor in the Legislative Assembly for the year 2017, the Government has issued, as per GO (P) No. 19/ 2017/ Planningdt. 23-09-2017, detailed guidelines for the preparation of District Development Plans under the auspices of District Planning Committees (DPC). As envisaged in the guidelines, all DPCs have constituted Sub Committees for the preparation of District Plans. As per the calendar approved by the Government, the DPCs should send the final draft of the District Plans to the Government by the first week of January 2018 for approval.
Financing of Local Government Plans - Annual Plan 2016-17
The various sources of funds available to local government institutions include Plan allocation (Development Fund), own fund, State sponsored schemes, centrally sponsored schemes, beneficiary contribution etc. In 2016-17 the total size of the Plans of all local governments was 11,644.62 crore. Out of which the share of development fund released to all local governments constitutes 5,724.90 crore, i.e. 49 per cent of the total allocation from various sources. The own fund contributes only 9 per cent of the total Plan size and the balance fund comes from other sources. Source-wise funding details and the respective percentage share to total fund allocated in 2015-16 and 2016-17 are given in Figure 6.1.1. Source/Sub-sector wise details of 2015-16 and 2016-17 are given in Appendices 6.1.1 and 6.1.2.
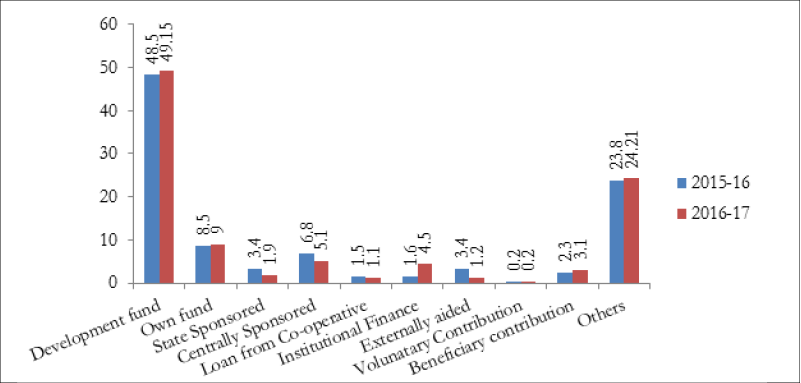 Sources of Financing LGs Plan – 2015-16 and 2016-17, in per cent. Source: Information Kerala Mission, 2017
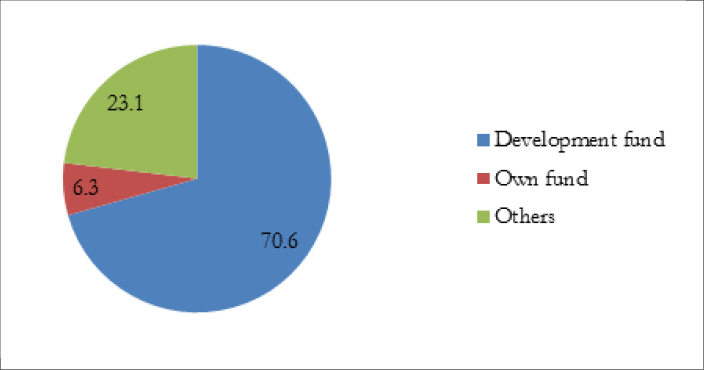
The Appendix 6.1.2 reveals that the share of development fund to total Plan size of local governments is 49 per cent and at the same time, the share of development fund to total expenditure was 70.6 per cent in 2016-17. It shows that the dependency of the local governments on development fund for expenditure responsibilities is very high and the local governments are not adequately exploiting the potential of own revenue generation.
Performance of Local Government – Development Fund
The budget allocation under the category of development funds to local governments in the Annual Plan 2016-17 and 2017-18 are given in Table 6.1.3. It may be noted that the allocation to local government institutions is in accordance with the recommendations of the State Finance Commission and policy decisions thereon. The Appendix IV which is published along with Annual State Budget clearly lists out the share of development fund to each local governments.
The local governments allocate their development funds (Plan allocation) broadly under three sections viz; productive, service and infrastructure sectors according to local government priorities and Plan guidelines. The productive sector mainly includes agriculture and allied sectors, soil and water conservation, irrigation and industries. The service sector consists of education and allied sectors, health and allied services, development of women and children and labour welfare etc. and the infrastructure sector includes energy, transportation and buildings.
In the year 2016-17, the total fund released under the category of development fund was 5,724.90 crore which is higher than the budgeted outlay of 5,000.00 crore. Out of the total fund released, 3,839.88 crore was utilised for different sectors in 2016-17. Thus, the Plan fund utilisation percentage in 2016-17 was 67.07 per cent which was lower compared to the previous year (73.6 per cent). It may be noted that the expenditure pattern shows variations among different tiers of local bodies. Among the three tiers, the performance of Block Panchayat was better with 70 per cent expenditure followed by Grama Panchayats with 69 per cent and District Panchayats with 68 per cent in 2016-17. Municipalities (64 per cent) and Municipal Corporations (59 per cent) have lowest expenditure among various tiers of government in 2016-17. The tier-wise details of outlay, fund available and expenditure in 2015-16 and 2016-17 are given in Figure 6.1.3 and Appendix 6.1.3 and Appendix 6.1.4.
| Type of LGs | 2016-17 | 2017-18 | ||||||
| General | SCP | TSP | Total | General | SCP | TSP | Total | |
| Grama Panchayats | 1968.25 | 516.46 | 88.62 | 2573.34 | 2409.97 | 582.66 | 99.98 | 3092.22 |
| Block Panchayats | 361.66 | 178.69 | 30.76 | 571.11 | 556.20 | 201.59 | 34.71 | 792.50 |
| District Panchayats | 361.66 | 178.69 | 30.76 | 571.11 | 556.20 | 201.59 | 34.71 | 792.50 |
| Municipalities | 642.33 | 95.82 | 5.82 | 743.98 | 761.67 | 108.10 | 6.57 | 876.34 |
| Corporations | 471.19 | 69.22 | 0.01 | 540.43 | 595.81 | 78.10 | 0.02 | 673.94 |
| Total | 3805.10 (4529.6) | 1038.90 (1039.3) | 156.00 (156.01) | 5000.00 (5724.9) | 4879.85 | 1172.04 | 175.99 | 6227.50 |
| Figures in bracket is revised budget estimate for 2016-17 based on actual release. Source: Appendix IV 2016-17 and 2017-18 |
||||||||
Category-Wise Performance
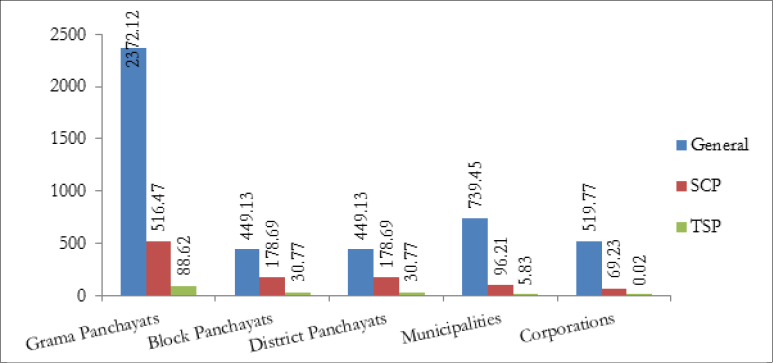
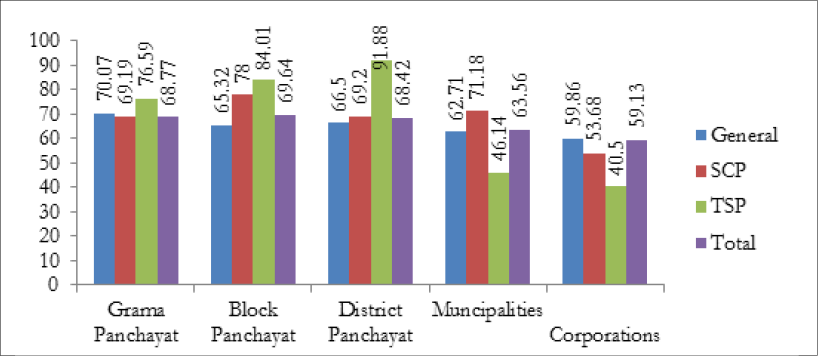
The allocation of development fund to Local Governments falls in three categories – General Sector, Special Component Plan (SCP) and Tribal Sub Plan (TSP). The outlay for each category is fixed on the basis of recommendations of the State Finance Commission. In 2016-17, an amount of 5,724.90 crore was released to different categories, of which general category, SCSP and TSP constituted 79 per cent, 18 per cent, and 3 per cent respectively. An analysis of category-wise utilisation in 2016-17 reveals that the percentage of expenditure under General Sector was 66 per cent of the total fund released and in the case of SCSP and TSP, it was 70 per cent and 80 per cent respectively. Shortfall in expenditure under SCSP/TSP was a common phenomenon for all tiers of Local Governments in previous years. But in 2016-17 the expenditure under SCSP and TSP category was higher than in the general category. This is a remarkable achievement by local governments. The category-wise and local body-wise allocation and expenditure in 2016-17 are given in Appendix 6.1.3 and Appendix 6.1.4 and in Figure 6.1.4.
 Source: Information Kerala Mission 2017
Sectoral Analysis
The LGs allocate their funds mainly in three sectors viz. productive, service and infrastructure. Out of the total expenditure in 2016-17,the share of expenditure by productive, service and infrastructure sectors was 11 per cent, 64 per cent and 25 per cent respectively. It may be noted that the total expenditure under productive sector has increased compared to the previous year. But still it is far below the minimum sectoral allocation prescribed for the year. The improvement in productive sector expenditure in 2016-17 is an indication of the revival in agriculture and allied sectors. The expenditure incurred by urban local bodies shows a dismal picture in productive sector compared to their rural counterparts. The sector-wise expenditure details of 2015-16 and 2016-17 are given in Table 6.1.4. The sub-sector wise expenditure details in 2015-16 and 2016-17 are given in Appendix 6.1.5 and Appendix 6.1.6.
| Type of LGs | 2015-16 | 2016-17 | ||||||
| Productive | Service | Infrastructure | Total | Productive | Service | Infrastructure | Total | |
| Grama Panchayats | 8.81 | 53.21 | 37.98 | 100 | 12.22 | 63.73 | 24.05 | 100 |
| Block Panchayats | 7.92 | 59.43 | 32.65 | 100 | 14.84 | 62.27 | 22.89 | 100 |
| District Panchayats | 6.93 | 60.43 | 32.64 | 100 | 14.73 | 67.71 | 17.55 | 100 |
| Municipalities | 5.27 | 51.37 | 43.35 | 100 | 7.25 | 61.94 | 30.81 | 100 |
| Corporations | 4.30 | 48.59 | 47.10 | 100 | 3.14 | 65.55 | 31.31 | 100 |
| Total | 7.68 | 54.47 | 37.85 | 100 | 11.31 | 63.94 | 24.75 | 100 |
| Source: Information Kerala Mission 2017 | ||||||||
Productive Sector
The productive sector includes sub sectors such as agriculture, animal husbandry, dairy development irrigation, industry, energy conservation, fisheries etc. The total utilisation of Plan resources in the Annual Plan 2016-17 under productive sector was 434.32 crore. Out of the total productive sector expenditure by various tiers of Local Governments, 44 per cent of fund was utilised for the implementation of schemes under agriculture and allied sectors in 2016-17. The LGs have given more weightage to agriculture and allied sectors compared to industries and other productive sectors. The industries sector has not received due consideration over the review period. The rural local bodies, especially Grama Panchayats have given major attention to the implementation of agriculture and allied programmes in productive sectors by spending a major share of the total expenditure incurred in productive sector. The details of productive sector expenditure in 2016-17 are given in Appendix 6.1.7 and Figure 6.1.5.

Service Sector
Social welfare and service sector is the major sub sector under, which the local governments set apart a major source of Plan allocation. The major service sector expenditure incurred by local governments include housing, education, sanitation and waste management etc. and these investments play a crucial role in local public governance. The service sector priorities of local governments enhance the quality of basic services provided to the public through welfare oriented programmes. Service sector fund utilisation in 2016-17 has improved than the productive and infrastructure sectors and achieved 64 per cent of the total expenditure. An amount of 449.11 crore was spent by the local governments in 2016-17 for financial contributions under service sector as per government order. The total expenditure for service sector activities by all the local governments comes to 2,455.24 crore in 2016-17 which is higher than the previous year. The lion's share of service sector expenditure undertaken by all the local governments was in housing and related expenditure. An amount of 434.76 crore was expended on housing, house maintenance and related activities. Sanitation and waste processing activities accounts for (299.44 crore) another major share in service sector expenditure. The expenditure on education and nutrition was 287.9 and 198.01 crore respectively. The expenditure under service sector in 2016-17 is shown in Appendix 6.1.8 and Figure 6.1.6.

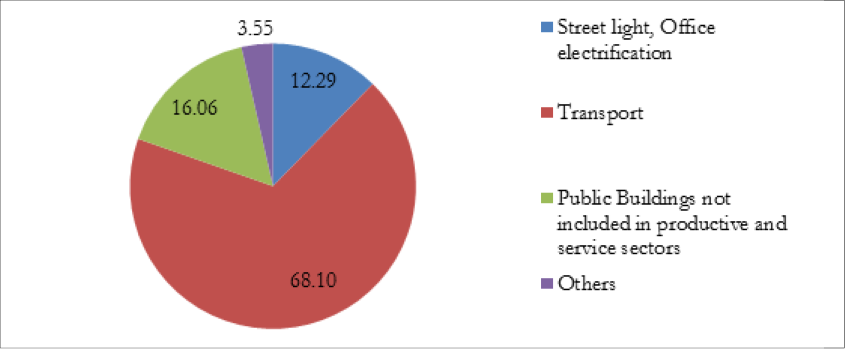
Infrastructure Sector
In 2016-17, the Local Governments set apart 25 per cent of the total expenditure on infrastructure sector activities such as street lighting, transportation, and construction activities etc. The expenditure in 2016-17 shows a marginal decrease and the overall infrastructure expenditure as a share of total expenditure reduced to 25 per cent from 38 per cent of 2015-16. Out of the total expenditure a major portion has been utilised for transport sub-sector which includes roads, bridges etc. Out of the total infrastructure expenditure of 950.32 crore, Grama Panchayats utilised 492.44 crore which is followed by municipalities (164.77 crore). Expenditure details under infrastructure sector in 2016-17 are given in Appendix 6.1.9 and Figure 6.1.7.
Scheduled Caste Sub Plan and Tribal Sub Plan under Decentralisation
The Scheduled Caste Sub Plan and Tribal Sub Plan are prepared based on Article 46 of Constitution of India for providing special protective measures to safeguard the interest of Scheduled Caste (SCs) and Scheduled Tribe (STs). This constitutional mandate requires the State ‘to create a regime of equality including social equality through comprehensive measures of social justice.' As one of the major objectives of decentralised planning is to empower social equity and to improve the socio-economic status of Scheduled Castes and Scheduled Tribes and enhancing their quality of life, the devolution under Special Component Plans has prime importance.
The allocation of Plan funds to SCSP and TSP from State Plan outlay is done according to the ratio of population of SCs and STs to total population of the State. Out of the total SCSP/TSP Plan outlay, a portion of funds are earmarked to LGs for implementation of schemes under decentralised planning. The outlay and expenditure for each category in 12th Five-Year Plan are shown in Table 6.1.5.
| Year | SCSP | TSP | ||
| Budget Allocation | Expenditure* | Budget Allocation | Expenditure* | |
| 2012-13 | 739.46 | 661.58 | 110.98 | 99.65 |
| 2013-14 | 828.2 | 882.49 | 124.3 | 136.89 |
| 2014-15 | 927.58 | 811.56 | 139.21 | 121.61 |
| 2015-16 | 927.58 | 857.03 | 139.21 | 149.78 |
| 2016-17 | 1038.90* | 726.02 | 156.00 | 124.69 |
| *Revised allocation 1039.29 crore. Source: Appendix IV of the Budget and Information Kerala Mission, 2017. | ||||
The expenditure performance of SCSP and TSP funds of local governments has improved over the previous year. The total expenditure incurred by local governments on SCSP compared to total fund released was 70 per cent, which shows an improvement over the previous year. On the other hand utilisation of 80 per cent of the total TSP fund released, is also an indication of effective fund utilisation. The tier-wise expenditure of SCSP shows that the Block Panchayats and municipalities have the highest expenditure. And in the case of TSP, the District Panchayats has the highest expenditure (92 per cent). Municipal Corporations have not effectively utilised both SCSP and TSP funds (Appendix 6.1.4 )
Performance under Special Sector Plans
Women Component Plan and Plan for disadvantaged groups (aged, children, differently abled, palliative and other vulnerability) in the Plan of local governments is one of the salient features in Kerala's decentralised planning. In 2016-17 it was stipulated that of the total Plan size, local governments have to set apart the mandatory provision of 10 per cent for women development and 5 per cent for children and disabled and 5 per cent for aged population. The expenditure on WCP in 2016-17 as percentage to total expenditure was 9.5 per cent, which is slightly lower than the overall WCP sectoral allocation of 10 per cent. In the case of special programme for children and differently abled it comes to 3.5 per cent and 2.3 per cent respectively. The details of expenditure for special sector Plans in 2016-17 are given in Table 6.1.6 and the tier-wise details in 2015-16 and 2016-17 are given in Appendix 6.1.10 and Appendix 6.1.11.
| Special sectors | Expenditure ( in crore) | % to total Expenditure |
| Women Component Plan | 366.35 | 9.5 |
| Special Programme for Children | 134.72 | 3.5 |
| Special Programme for Elderly | 56.88 | 1.2 |
| Differently Abled | 89.8 | 2.3 |
| Palliative Care | 66.61 | 1.7 |
| Youth Welfare Programmes | 77.55 | 2.0 |
| *Inclusive of KSEB's contribution. Source: Information Kerala Mission, 2017. |
||
Strengthening of District Planning Machinery
District Planning Committee, has been created as per Article 243 ZD of the Constitution of India at the district level for planning at district and below. The district planning as a strategy for a balanced, integrated and meaningful development of district has been an accepted concept since the beginning of the planning era. Accordingly, District Planning Committees were constituted in all the fourteen districts in accordance with the spirit of the 74th Amendment of the Constitution so that they can play the nodal role in Plan preparation by LGs, approval of local Plans, providing suggestions to LGs, monitoring of Plan implementation etc. and their integration at district level as also their linkages with the State Plan. The DPC consists of 15 members headed by the District Panchayat President with District Collector being the Member Secretary. All MPs and MLAs are permanent invitees of DPC and the district level officers are ex-officio Joint Secretaries. The DPCs are fully functional in the State. The District Planning Officer being the Joint Secretary (Co-ordination) of DPC assists the Member Secretary in convening meetings, preparation of agenda, minutes and all other secretarial duties. The constitution of DPC has been done every five years without fail in the State consequent to the general election to the Local Governments every five year. The construction of DPC secretariat buildings have been completed in Ernakulam, Thrissur, Kasaragod, Wayanad, Kannur and Alappuzha. In the other districts the work is at various stages of completion.
The World Bank aided Kerala Local Government Service Delivery Project was started in Kerala in the financial year 2011-12. The objective of the Project is to enhance and strengthen the institutional capacity of the Local Government System in Kerala to deliver services and undertake basic administrative and governance functions more effectively and in a sustainable manner. The original project cycle of KLGSDP was 2011- 2015 December 31, however it was extended up to December 2017. The four components of KLGSDP are (i) Performance Grant to Municipalities and Grama Panchayats (ii) Capacity Building (iii) Enhancing State Monitoring of the Local Government System and (iv) Project Management and Implementation. As part of performance grant, 40,000 projects have been created (as on March 31, 2017) and maintenance of capital assets have been done by various Municipalities and Grama Panchayats in various sectors. This includes building for bud schools, bus stations, road connectivity, construction of small check dams, anganwadis, fish markets etc. These projects adhered both procurement and environment and social management framework rules as per the World Bank norms.
| Component | GOK | World Bank | Total |
| Performance Grant | 471.32 | 1,019.59 | 1,490.91 |
| Capacity Building | 0.00 | 73.75 | 73.75 |
| Enhancing State Monitoring of the Local Government System | 0.00 | ||
| Project Management | 0.00 | ||
| Total Project Cost | 471.32 | 1,093.34 | 1,564.66 |
| Component | 2011-12 | 2012-13 | 2013-14 | 2014-15 | 2015-16 | 2016-17 | Total |
| Performance Grant | 93.54 | 190.35 | 271.19 | 115.30 | 276.57 | 217.95 | 1164.90 |
| Capacity Building | 0.09 | 2.82 | 4.18 | 3.14 | 2.49 | 7.27 | 19.99 |
| Monitoring and Evaluation | 0.02 | 0.49 | 0.53 | 0.59 | 0.90 | 1.32 | 3.85 |
| Project Management | 1.02 | 1.99 | 5.02 | 4.04 | 2.95 | 3.64 | 18.66 |
| Total Project Cost | 94.67 | 195.6 | 280.92 | 123.07 | 282.91 | 230.18 | 1207.4 |