
Page 35 - economic review
P. 35
7
and market centres etc. have been created. The geographical features, availability of sub soil water, MACRO ECONOMIC PROFILE
climatic factors, easy access to transportation corridors and the socio economic factors etc. have
contributed to the development of a dispersed settlement pattern spread all over the state. The
effectiveness of investments in infrastructure development is considerably reduced since the scarce
resources are spread too thinly throughout Kerala.
1.14 The high density of population and higher rate of urbanization together cause several problems
which are inherent to the process of urbanization. In order to mitigate the hardships of urbanization
policy towards planned urbanization taking care to reduce the problems faced by the urban
population should be adopted. A detailed account on ongoing schemes may be seen in section 3 of
chapter 5.
Section 3
National Income
1.15 The Gross National Income (GNI) at factor cost at 2004-05 prices is estimated at ` 5673857
crore during 2013-14, as against the previous year’s estimate of ` 5416659 crore (Table 1.2). In
terms of growth rates, the gross national income is estimated to rise by 4.7 per cent during 2013-14,
in comparison to the growth rate of 4.1 per cent in 2012-13. The GNI at factor cost at current prices
is estimated at ` 10344507 crore during 2013-14, as compared to ` 9272110 crore during 2012-13,
showing a rise of 11.6 per cent. The Net National Income (NNI) at factor cost at current prices is
estimated at ` 9171045 crore during 2013-14, as compared to ` 8255978 crore during 2012-13,
showing a rise of over 11 per cent. Details are given in Table 1.1
1.16 GDP at factor cost at constant (2004-05) prices in the year 2013-14 is estimated at
` 5741791 crore showing a growth rate of 4.7 per cent over the Estimates of GDP for the year 2012-
13 of ` 5482111 crore. The GDP at factor cost at current prices in the year 2013-14 is estimated
at ` 10472807 crore showing a growth rate of 11.5 per cent over the estimates of GDP for the year
2012-13 of ` 9388876 crore. The per capita GDP at factor cost in real terms, i.e. at 2004-05 prices, is
estimated at ` 46568 for 2013-14 as against ` 45046 in 2012-13, registering an increase of over 3.4
per cent during the year. The per capita GDP at factor cost at current prices is estimated at ` 84938
in 2013-14 as against ` 77148 for the previous year depicting a growth of 10.1 per cent.
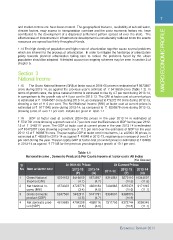
Table 1.1
National Income , Domestic Product & Per Capita Income at factor cost ( All India)
(`in Crores)
Sl At 2004-05 Prices At Current Prices
No Item at factor cost
2012-13 2013-14 2011-12 2012-13 2013-14
(P) (Q) (P) (Q)
1 Gross National 5201163 5416659 5673857 8314861 9272110 10344507
Income (GNI)
(4.1) (4.7) (11.5) (11.6)
2 Net National In- 4573328 4728776 4920183 7434965 8255978 9171045
come (NNI)
(3.4) (4.0) (11.0) (11.1)
3 Gross domestic 5247530 5482111 5741791 8391691 9388876
product (GDP)
(4.5) (4.7) (11.9)
4 Net domestic prod- 4619695 4794228 4988116 7511795 8372744 9299345
uct (NDP) (3.8) (4.0) (11.5) (11.1)
Economic Review 2014